Market Pulse: Are Bitcoin Long-Term Holders Spending Their Coins?
As the market rallies from the recent lows, we inspect whether Bitcoin Long-Term Holders are taking the opportunity to exit positions at or above their aggregate cost basis.


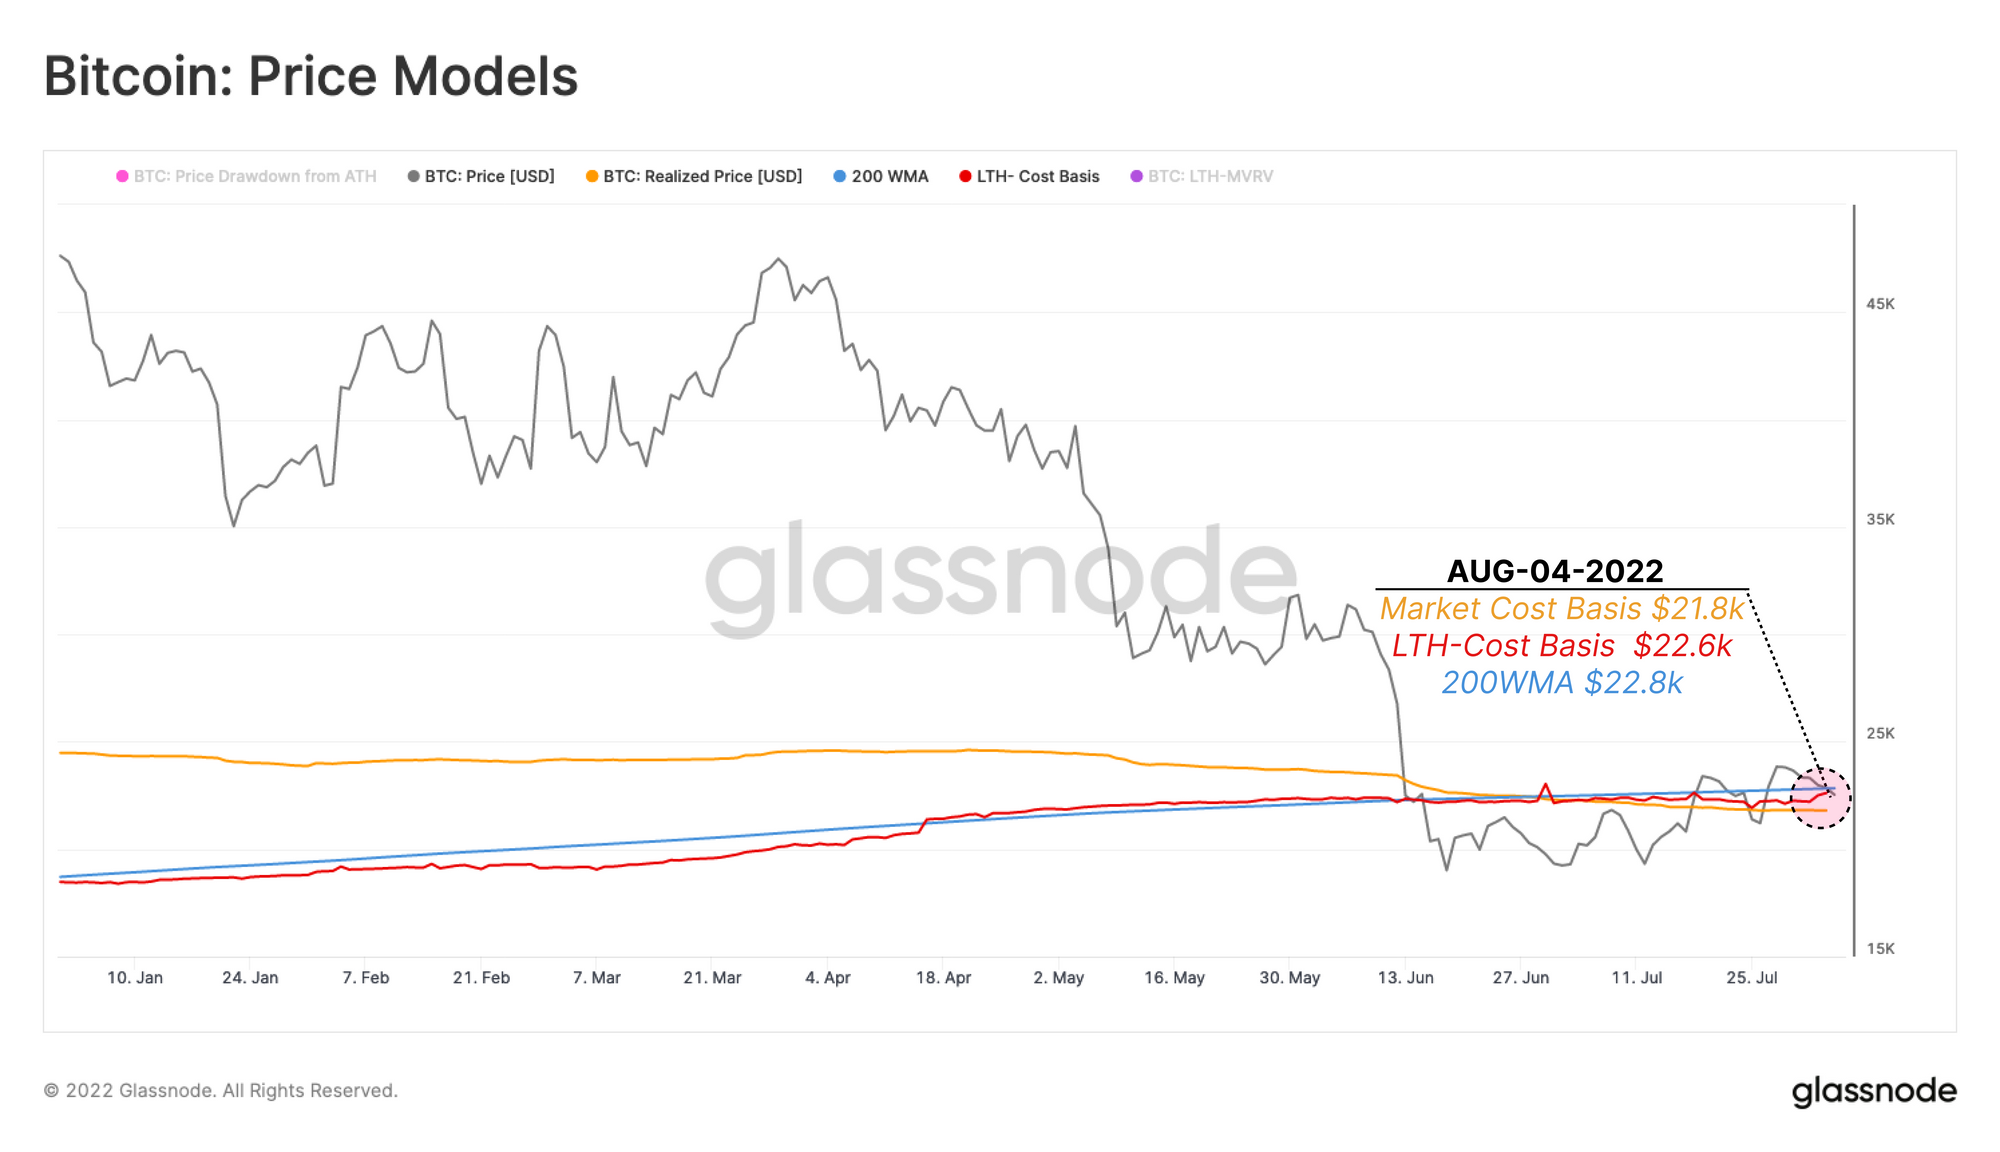
Despite all the uncertainties in the macro landscape, cryptocurrency markets have experienced a meaningful recovery since mid-July. Bitcoin prices have reclaimed two psychologically significant levels, including the 200 WMA, Long-Term Holders’ Cost Basis (LTH-Cost Basis), and Market Averaged Cost Basis (Realized Price), briefly touching the ~24k level.
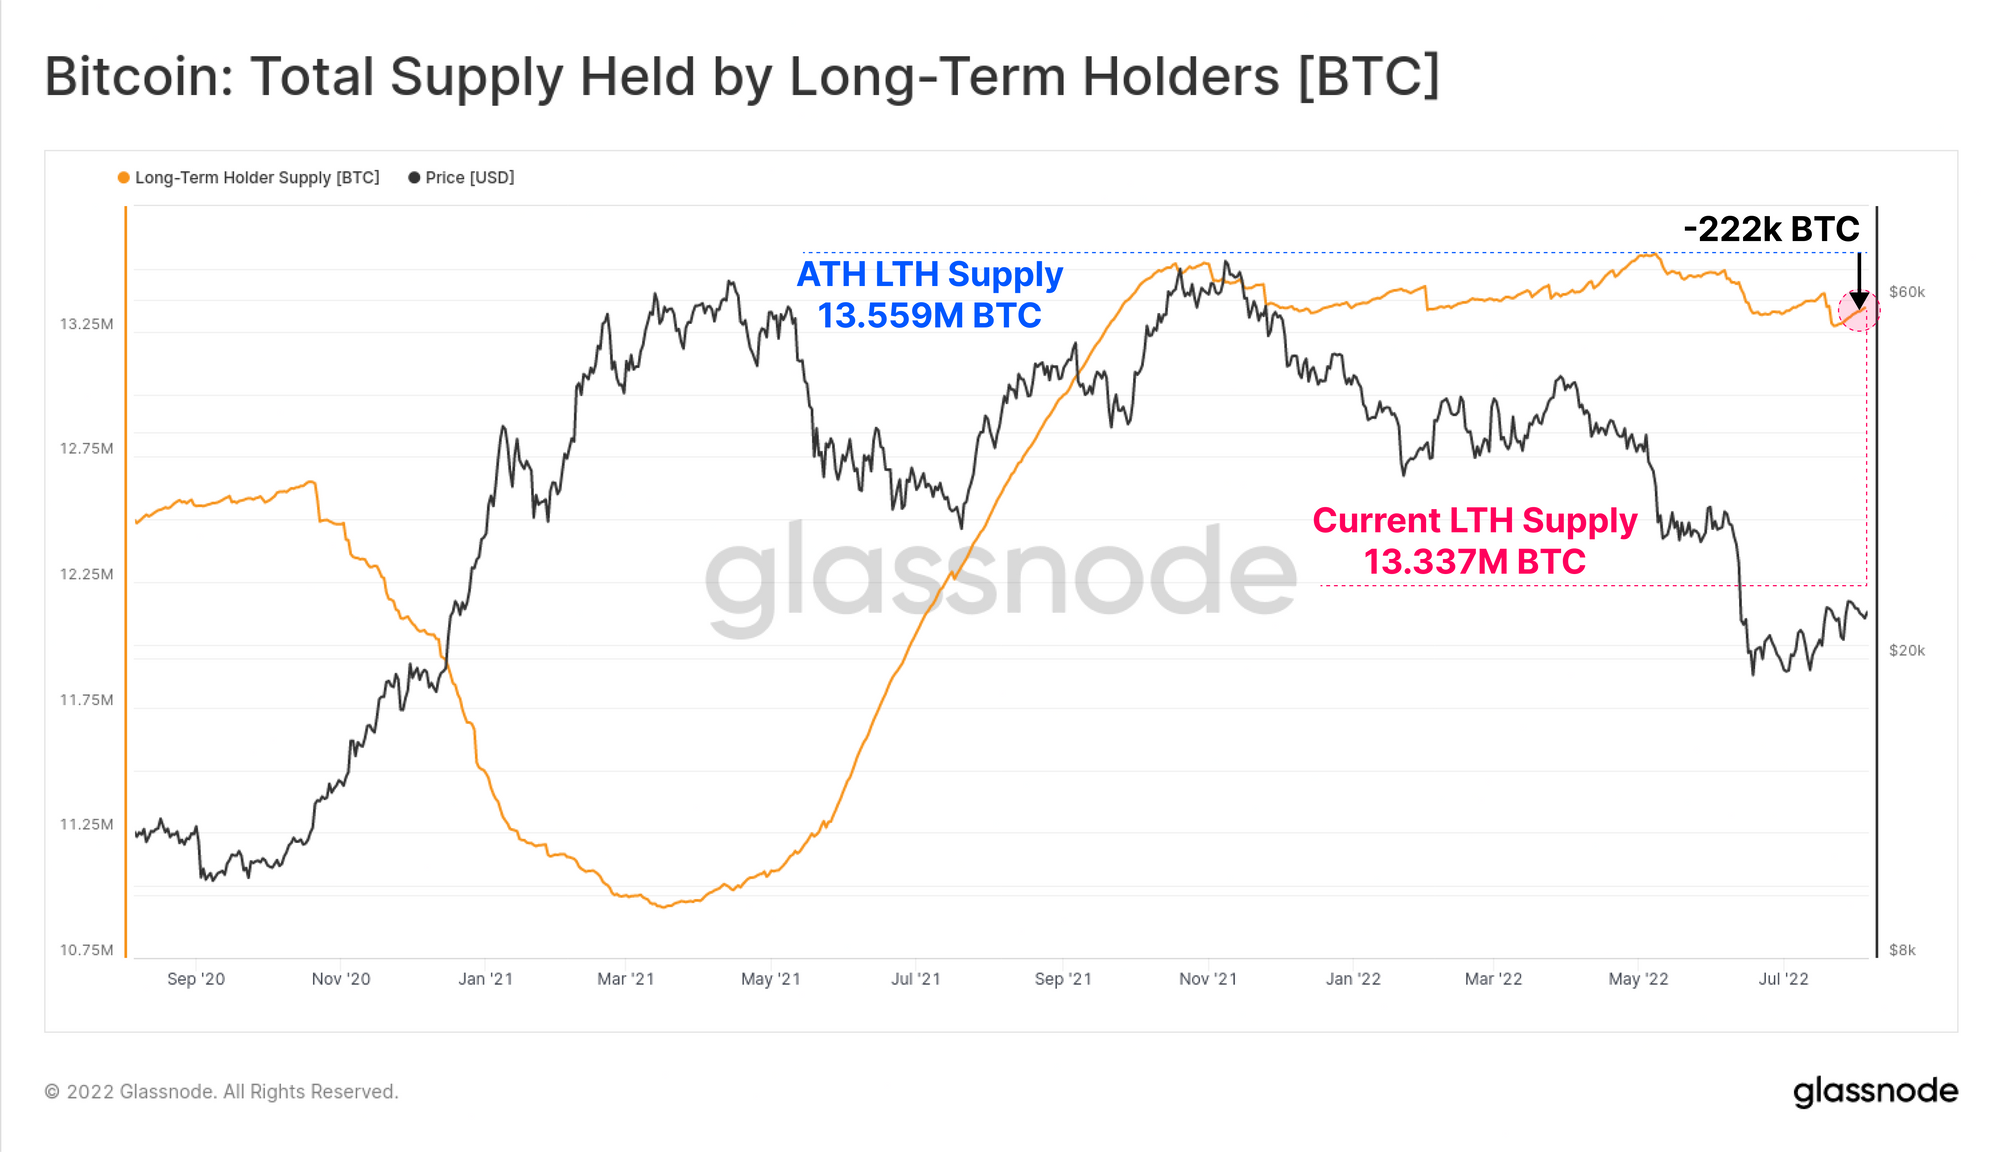
Such an impulsive rally during a bear market leads many to question the sustainability of the ongoing positive momentum. This Market Pulse report aims to trace the behaviour of stakeholders with an emphasis on Long-Term Holders with ~13.337 M (79.85%) of circulating supply in their possession.
Since the start of May, the Long-Term Holder cohort has on net distributed around 222k BTC, which is equivalent to approximately 1.6% of their all-time-high holdings.
The Long-Term holders’ behaviour throughout the recent rally can be inspected from two dimensions: Unrealized Stress (profitability of their holdings), and Realized Stress (profitability of their spent coins).
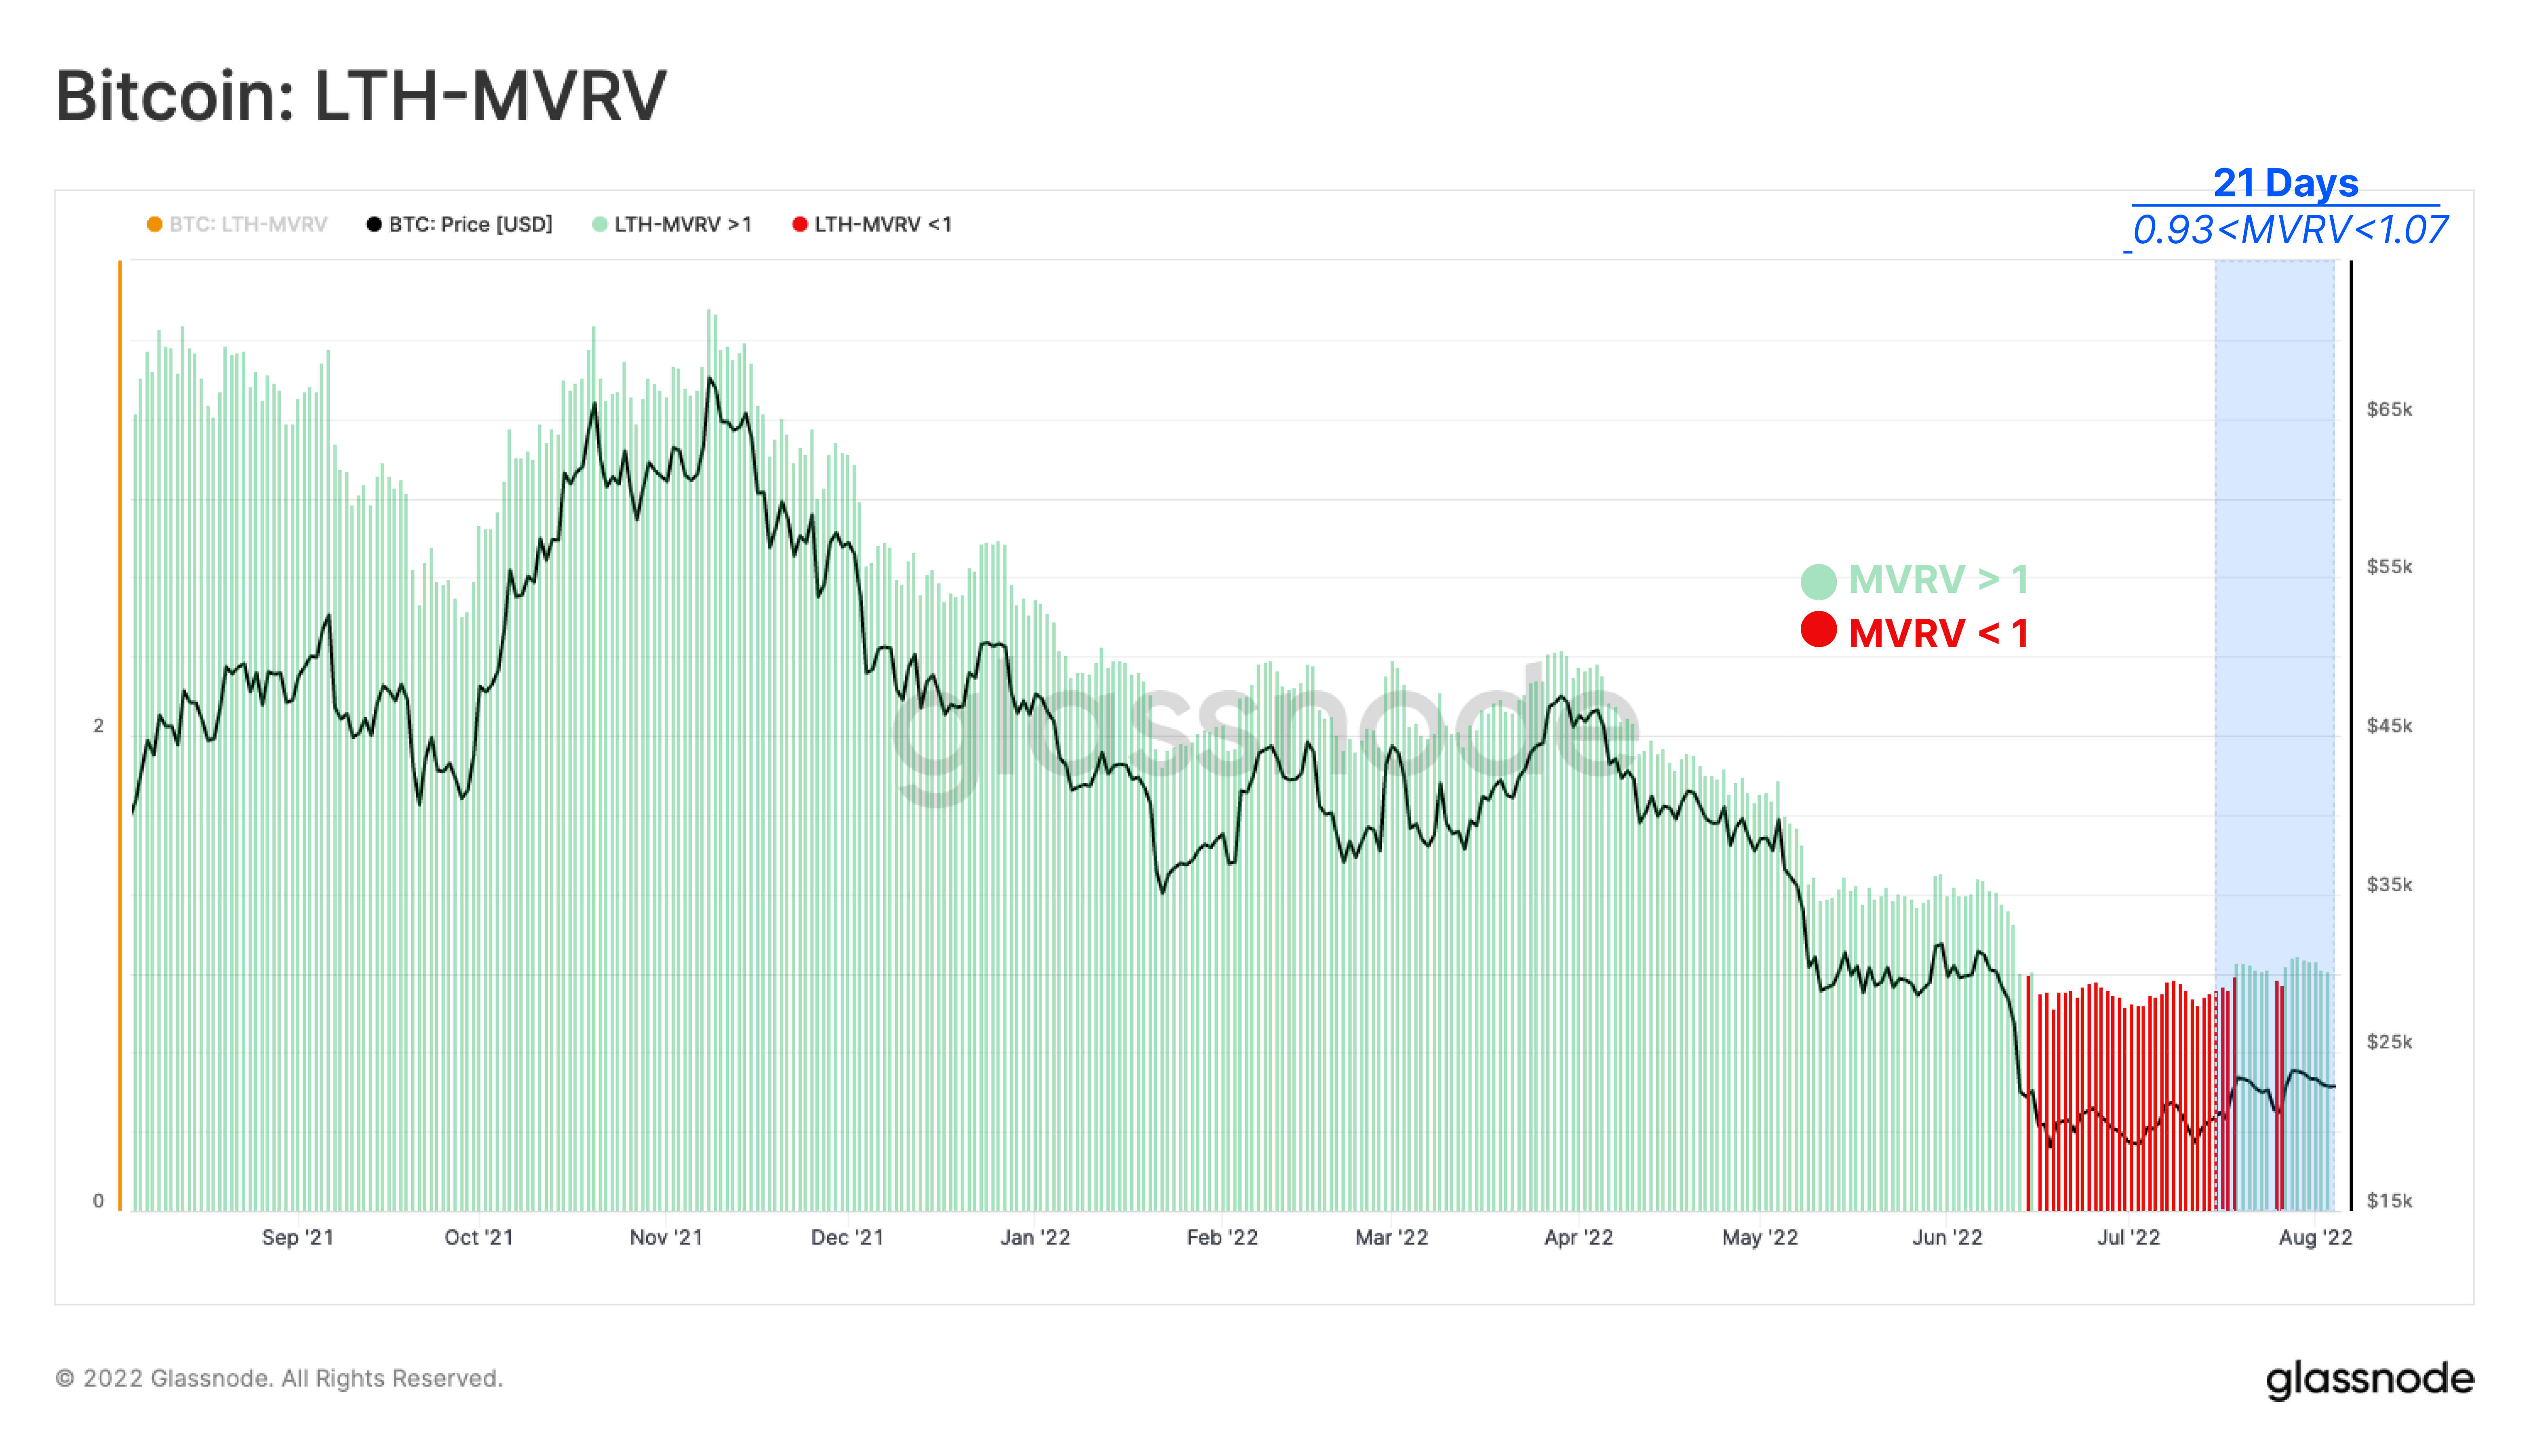
Unrealized Stress on LTH held Supply (LTH-MVRV)
Here, we compare the current spot price with the average acquisition price for Long-Term Holders. Looking back on the last 21 days, the implied stress on Long-Term Holders has diminished as price reclaimed the LTH-Cost Basis (LTH-MVRV>1).
The LTH-Cost Basis is currently trading at $22.6k, which indicates this cohort is currently holding coins at a 1% loss, considering the market price of $22.3k at the time of writing.
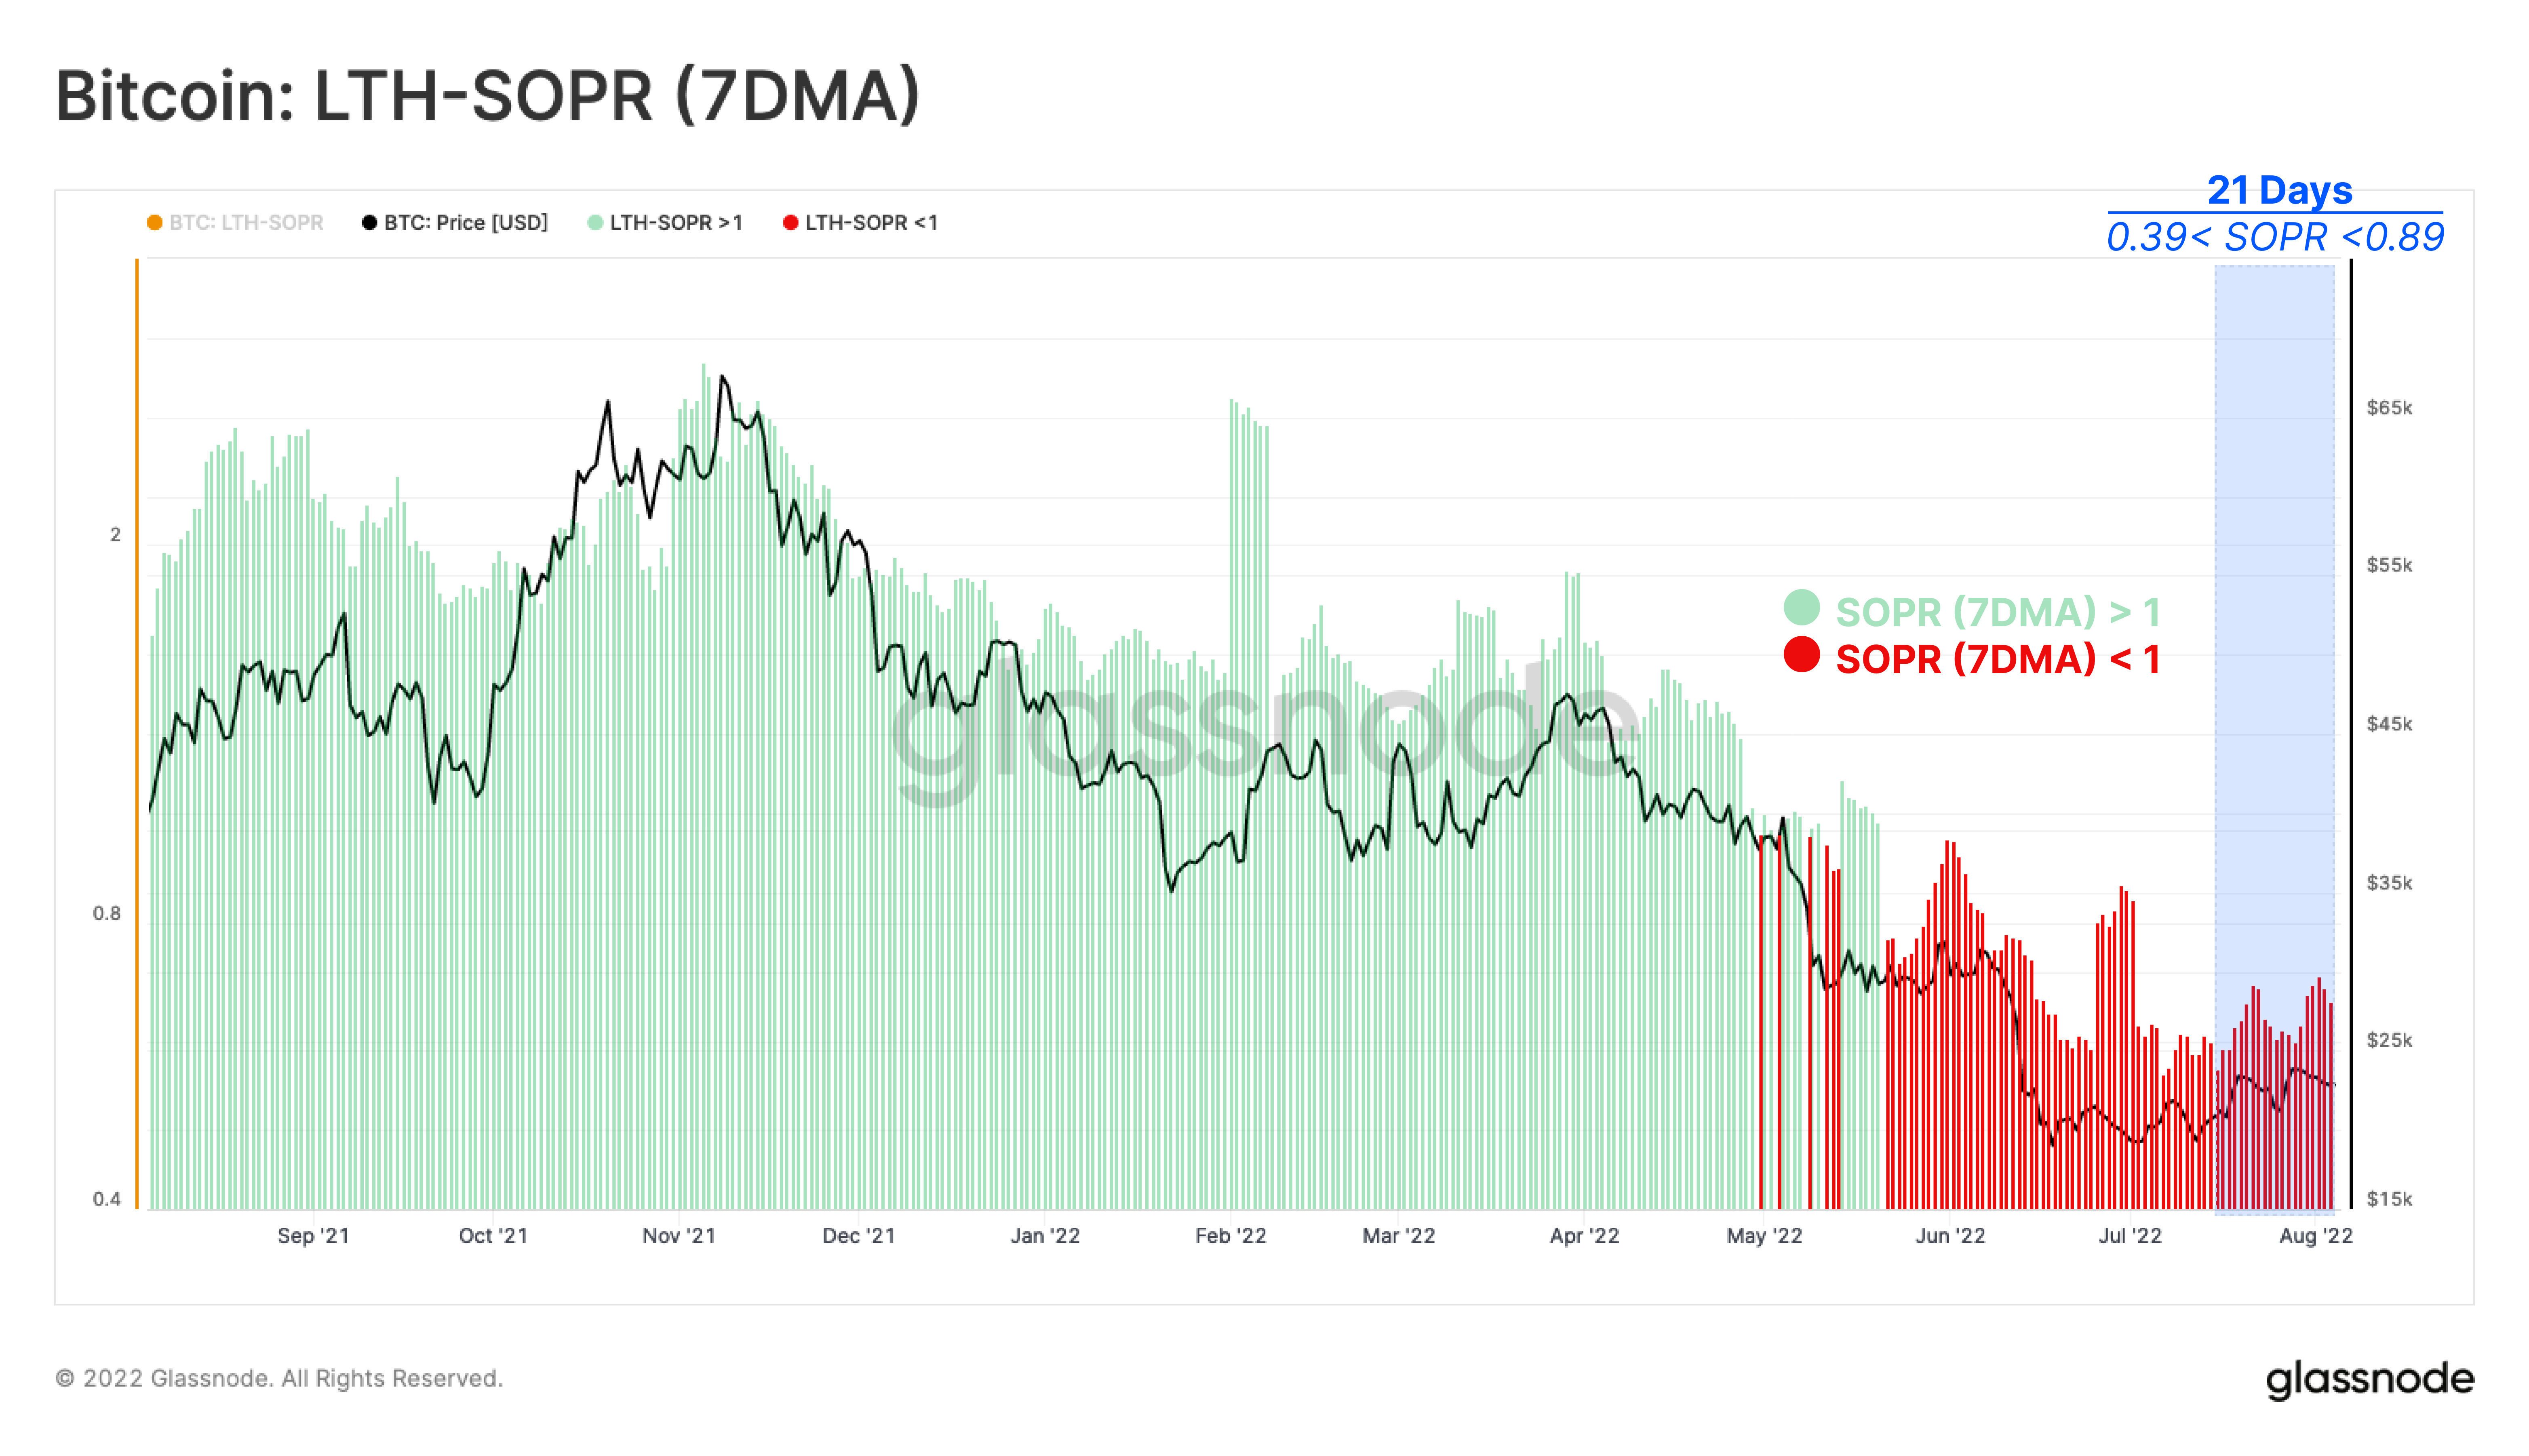
Realized stress on LTH Spent Supply (LTH-SOPR):
LTH-SOPR measures the ratio between the Long-Term Holder disposal price, and the average acquisition price.
Since mid-July, the weekly average of LTH-SOPR shows that Long-Term Holders were spending their coins at loss. With prices finding recent resistance at the $24k level, the weekly averaged value of LTH-SOPR is now at 0.67, indicating a 33% loss locked in on average. This confirms the continuation of spending at loss by Long-Term Holders in the current market.
Despite the spot prices being ~7% above the Long-Term Holder’s Cost Basis ($22.6k) most of the last 21 days, the weekly average value of LTH-SOPR (7DMA) implies that Long-Term Holders realized losses on spent coins ranging from -11% to -61%. This denotes Long-Term Holders who acquired coins at the 2021-2022 market tops are the primary spenders throughout this rally, and those who still hold coins from the 2017-2021 cycle (or earlier) are largely sitting tight.
In response, over the last three weeks, the aggregated behaviour of Long-Term Holders has changed from accumulating at a rate of 79k BTC/month, to distributing up to -47k BTC/month. Remarkably, this cohort seized the opportunity of rallying prices and spent 41k BTC, or 0.3% of their supply, over the last 21 days. (Note that net spending is defined as Accumulation plus HODLing minus Distribution).
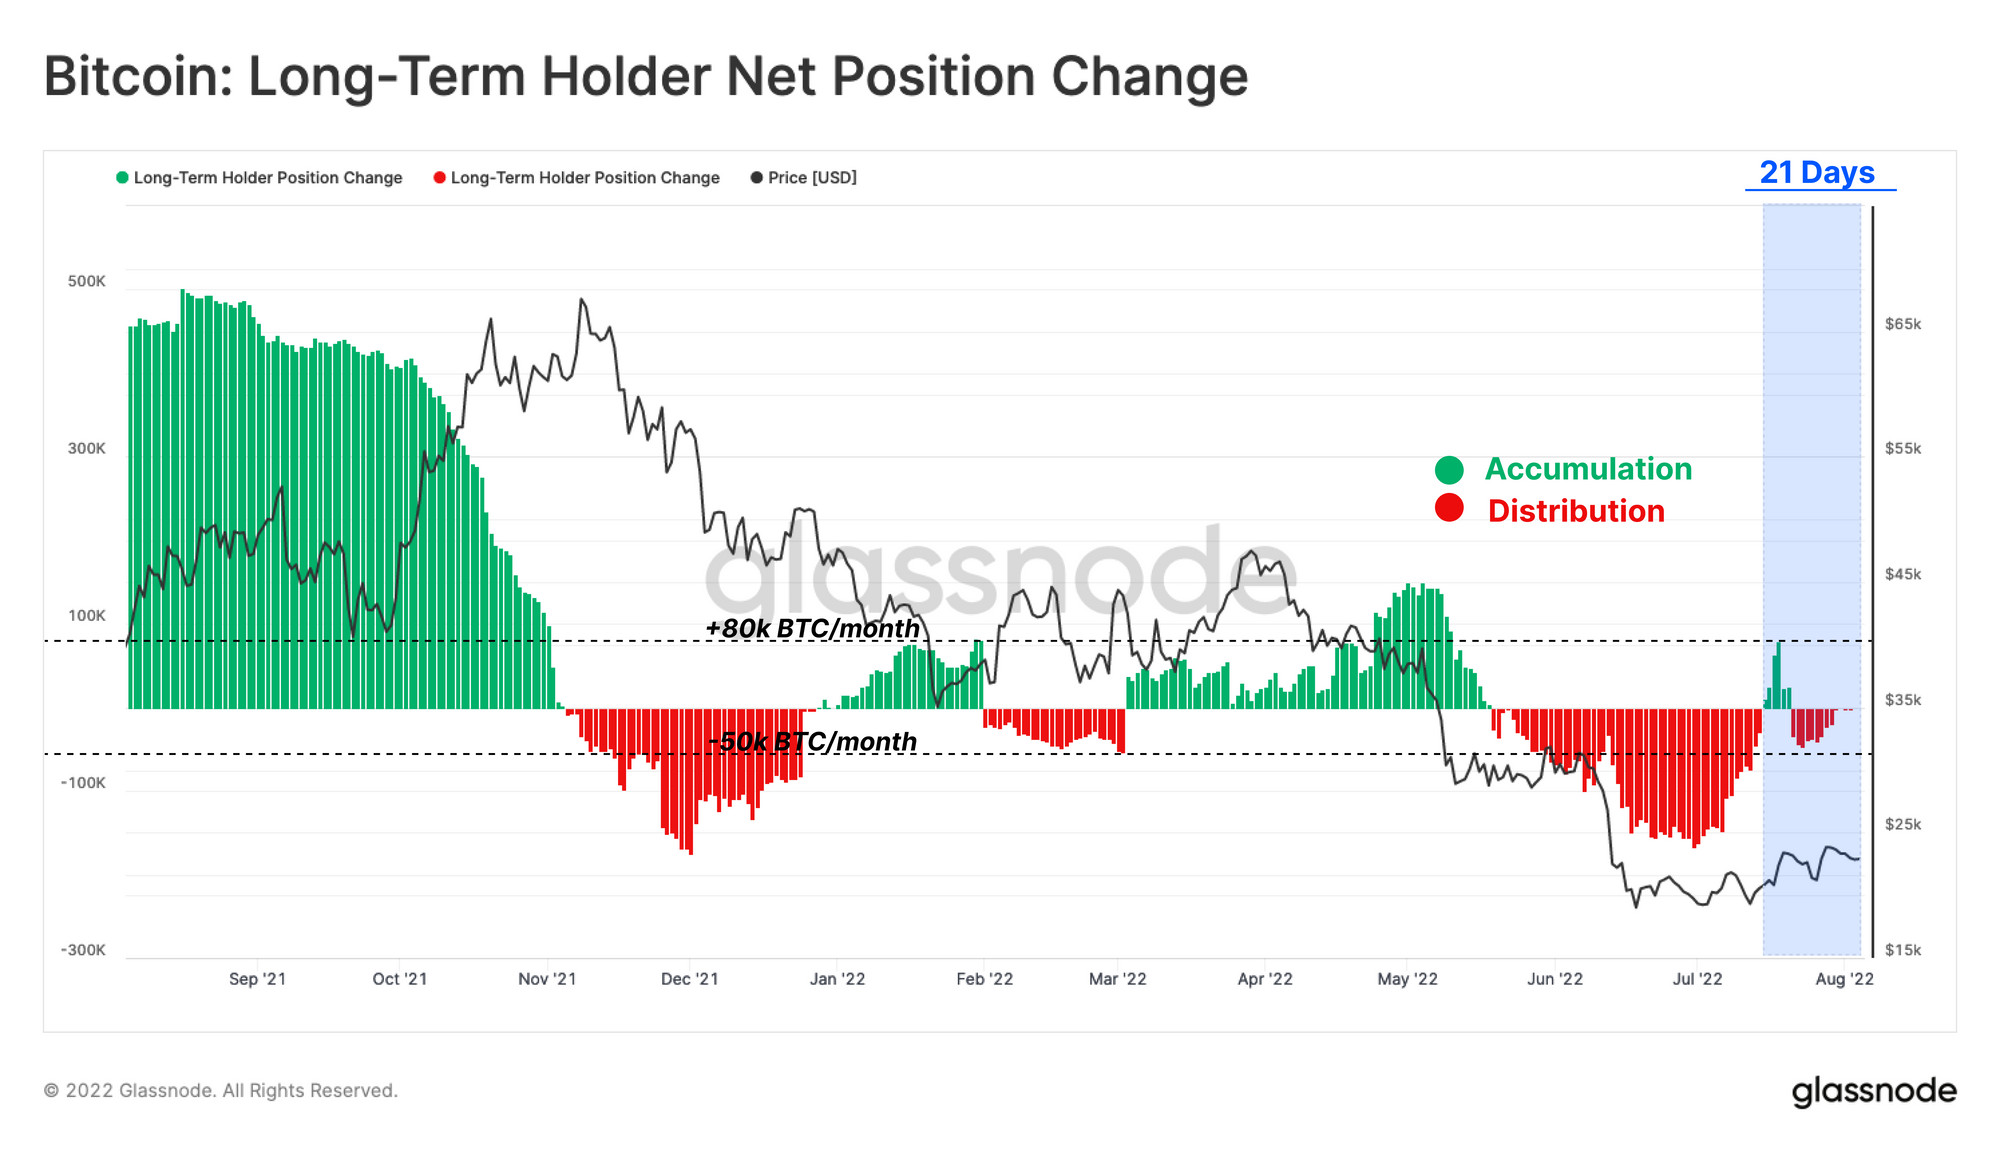
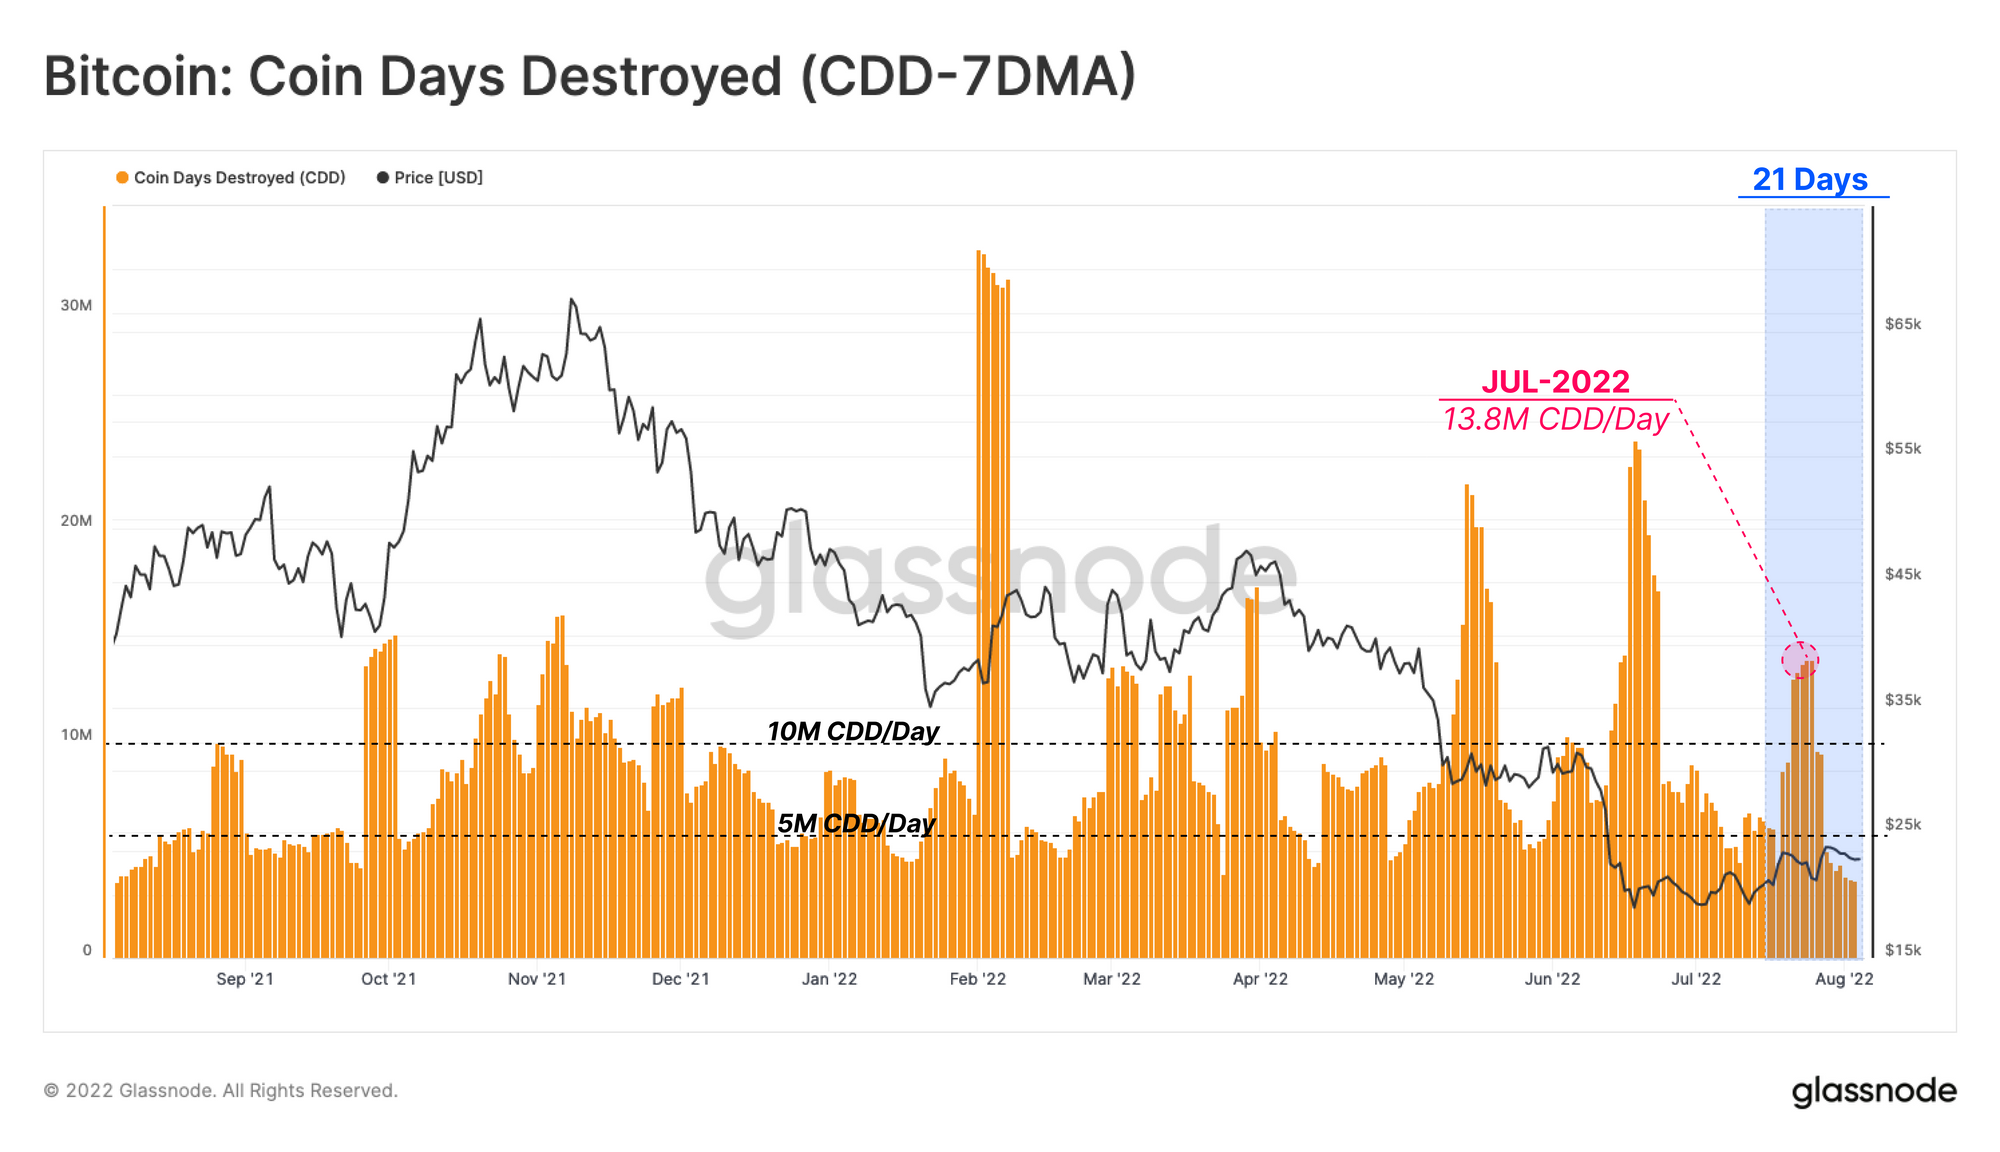
The significance of the mentioned spending from the Long-Term Holders’ side can be underlined by tracing the sudden peaks in the weekly average of Coin Days Destroyed (CDD-7DMA) metric. With CDD-7DMA rising to 13.8M coin-days from its bear market base, it is likely that the recent rally has provided Long-Term Holders with a window to exit some liquidity.
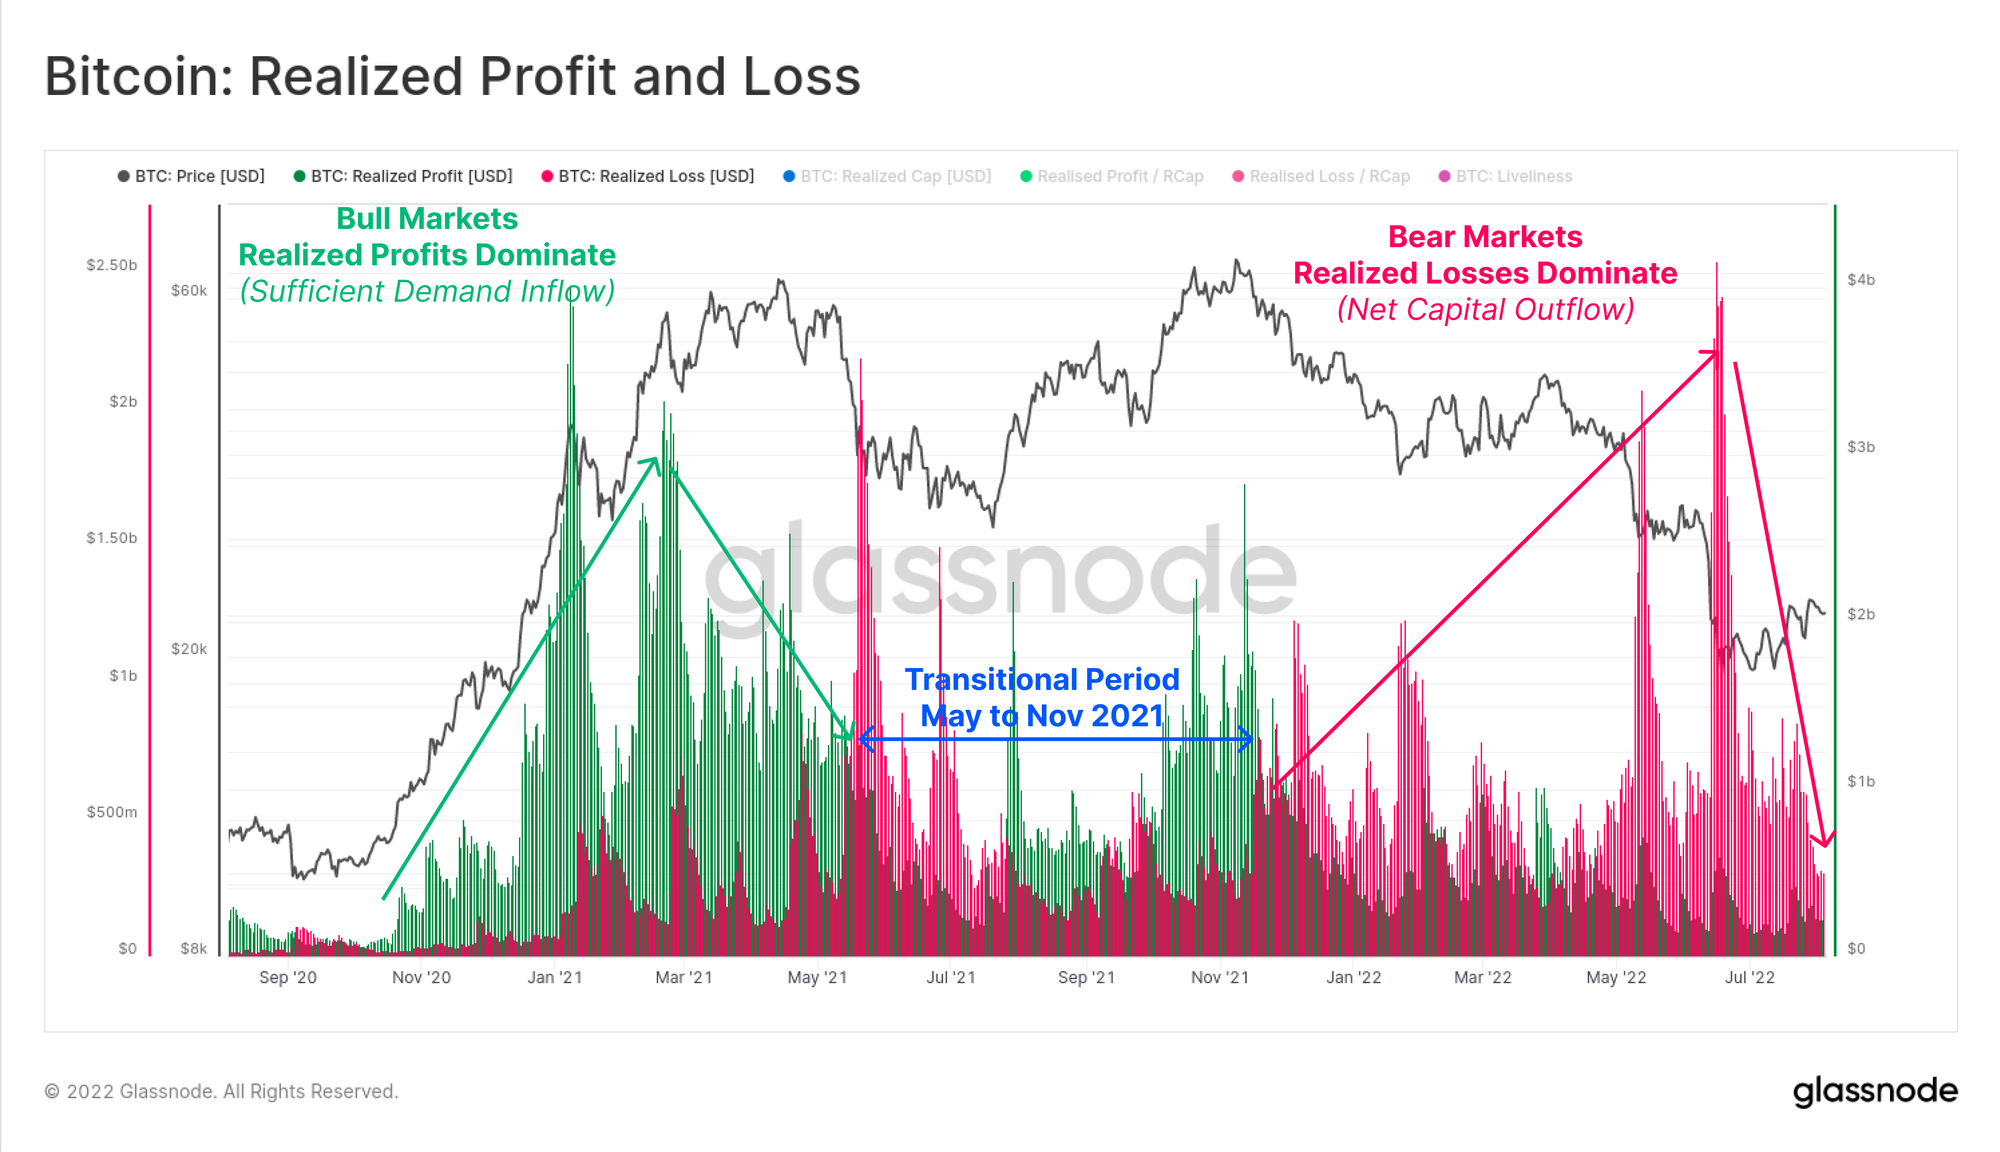
Looking at the market from a macro perspective, investors continue to realize a larger magnitude of losses compared to the profits on spent coins. The latest daily values show Realized Losses at $319M/day and Realized Profits at $226M/day.
Periods, where Realized Losses exceed Profits are a typical part of a bear market structure. However, a reversal of this balance is often associated with a pick-up in demand and could signal market recovery.
However, as it stands, it appears there is still a meaningful degree of expenditure by both the aggregate market and particularly by Long-Term Holders, whom appear to be taking what exit liquidity the market offers them.
Summary and Conclusions
The implied pressure on Long-Term Holders’ hands has reduced slightly as spot prices trade above their average cost basis (of held coins). However, despite the decreased financial pressure, LTHs continue to spend coins at a net loss, locking in between -11% and -61% on average.
A meaningful proportion of selling pressure appears to still be coming from Long-Term Holders, particularly those who accumulated their coins near the market top in 2021-2022. The recent rally has given allowed Long-Term Holders an opportunity to exit a fraction of their holdings at their cost basis, at prices which essentially 'get their money back'.

- Follow us and reach out on Twitter
- Join our Telegram channel
- Visit Glassnode Forum for long-form discussions and analysis.
- For on-chain metrics and activity graphs, visit Glassnode Studio
- For automated alerts on core on-chain metrics and activity on exchanges, visit our Glassnode Alerts Twitter
Disclaimer: This report does not provide any investment advice. All data is provided for information purposes only. No investment decision shall be based on the information provided here and you are solely responsible for your own investment decisions.