The Week On-chain (Week 32, 2021)
The market rallies higher as indications of a Bitcoin on-chain supply squeeze take shape, and Ethereum successfully rolls out EIP1559.


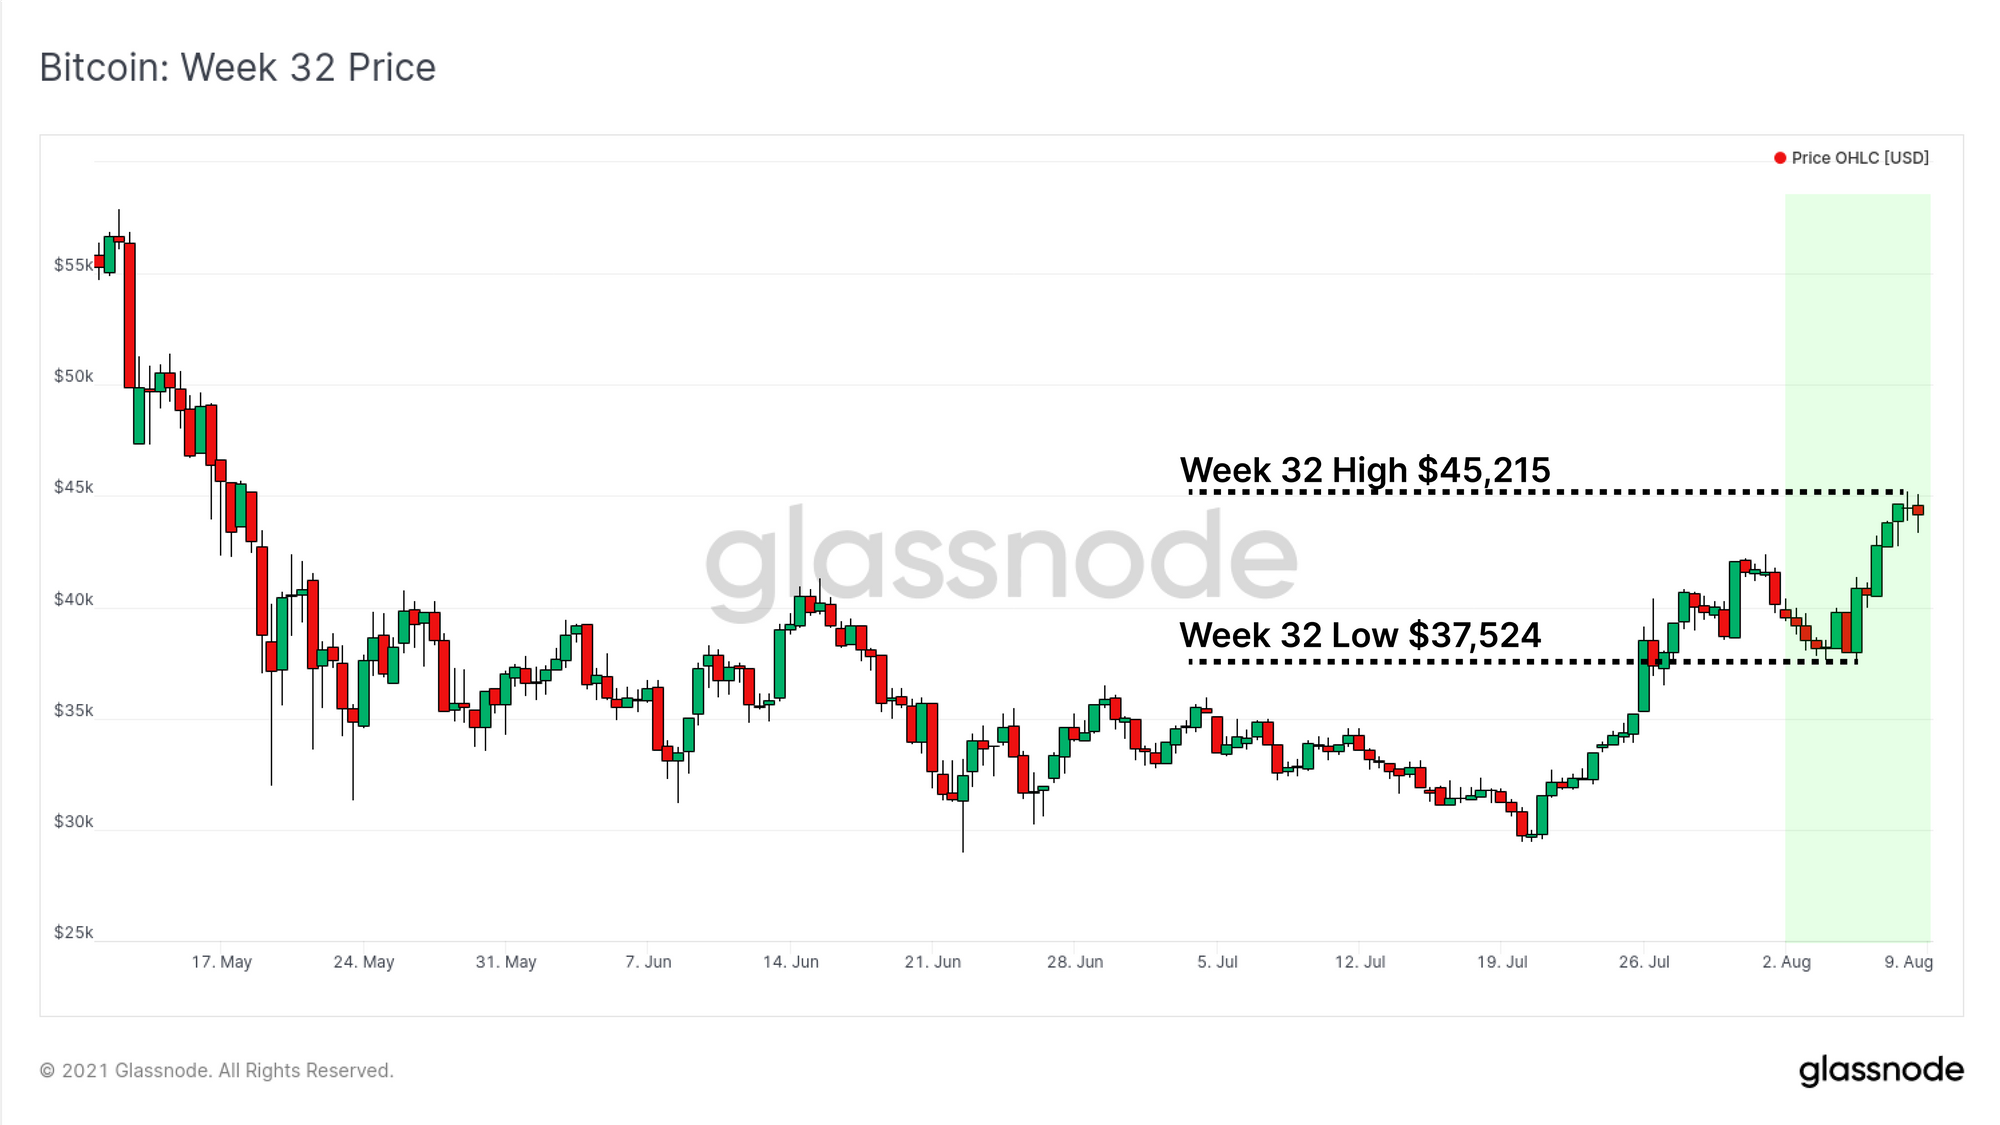
The Bitcoin market has seen another strong week, with prices rallying from lows of $37,524 up to a local high of $45,215. The market briefly traded above the 200-day moving average ($45k) over the weekend, before retracing and commencing consolidation. As a well observed technical indicator for bull/bear bias, the markets response to a rejection or breach of the 200-day MA is likely to be a source of attention over the coming weeks.
As price action confirms underlying market strength, we assess the on-chain response to the rally, seeking to identify whether Bitcoin holders are taking exit liquidity, accumulating, or HODLing on. We will also assess the early stages of Ethereum supply dynamics following the successful release of the EIP1559 fee burn mechanism.
On-chain Spending Behaviour
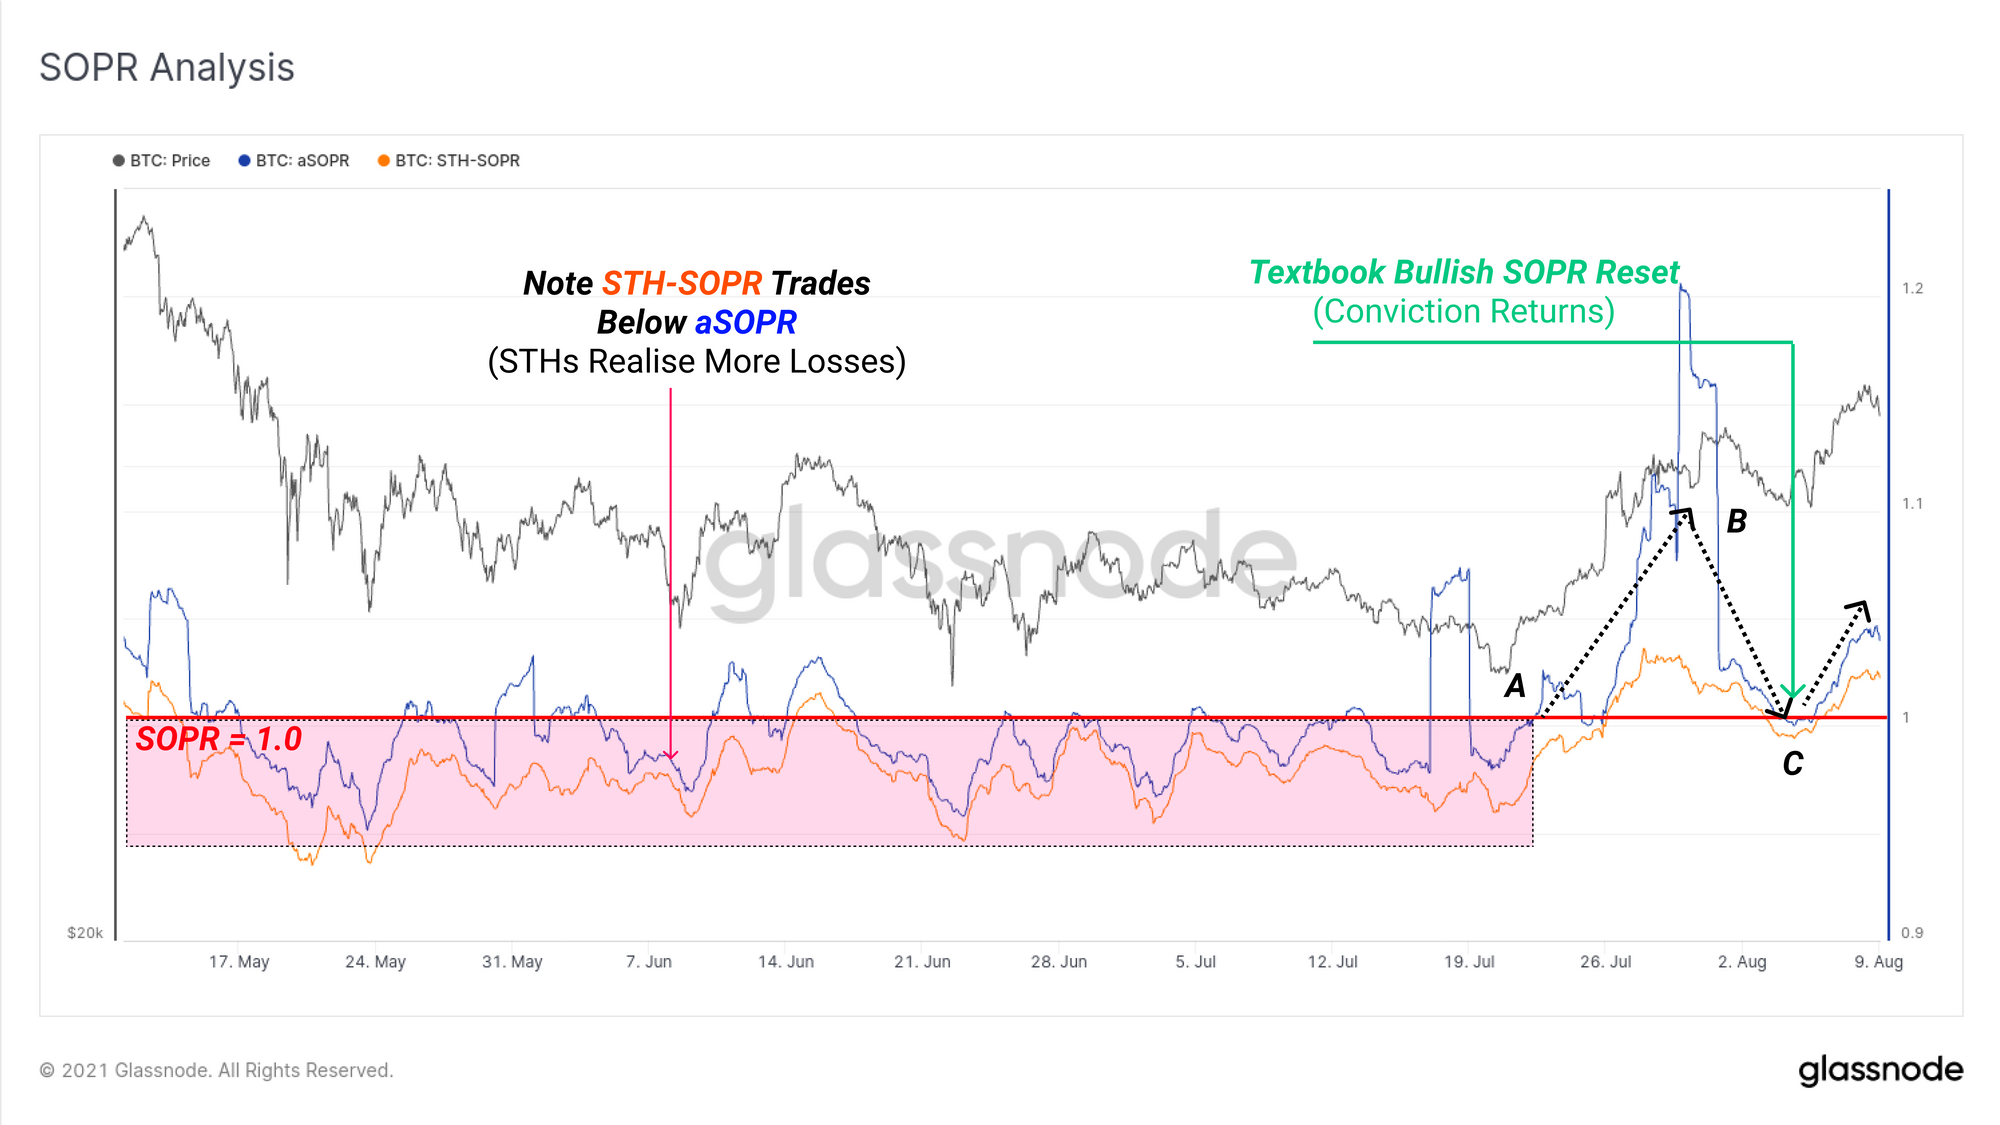
We start our analysis with the Spent Output Profit Ratio (SOPR) metric, which is a relatively short range indicator, presenting a view over the profit and loss realised by coins spent on-chain. Here we have used the Workbench tool to overlay two versions of SOPR:
- aSOPR representing the whole market, but excluding coins younger than 1hr (non-economical relay transactions)
- STH-SOPR representing only the profit/loss of Short-Term Holders.
After many months trading below a value of 1.0 (net realised losses), both SOPR metrics have executed what looks like a textbook bullish reversal. This is described as follows:
- A: SOPR breaks above 1.0 after a sustained period of losses being realised on-chain. This signals profits are realised, and the market was able to absorb that supply.
- B: SOPR reaches a local high profitable coins take advantage of market strength to spend and realise profits. This creates a local top via over-supply, and price corrects.
- C: SOPR resets back to 1.0 signalling profitable coins have stopped being spent and conviction returns to the market and the dip is bought. SOPR then trades higher repeating the rally higher.
Most important to watch is whether SOPR holds above 1.0. Should SOPR continue to trade higher, this reflects a bullish scenario where the market is adequately absorbing profits realised on spent coins. If on the other hand, SOPR falls and trades back below 1.0 on a sustained basis, it would suggest a general weakness in the market and potentially a fake-out rally.
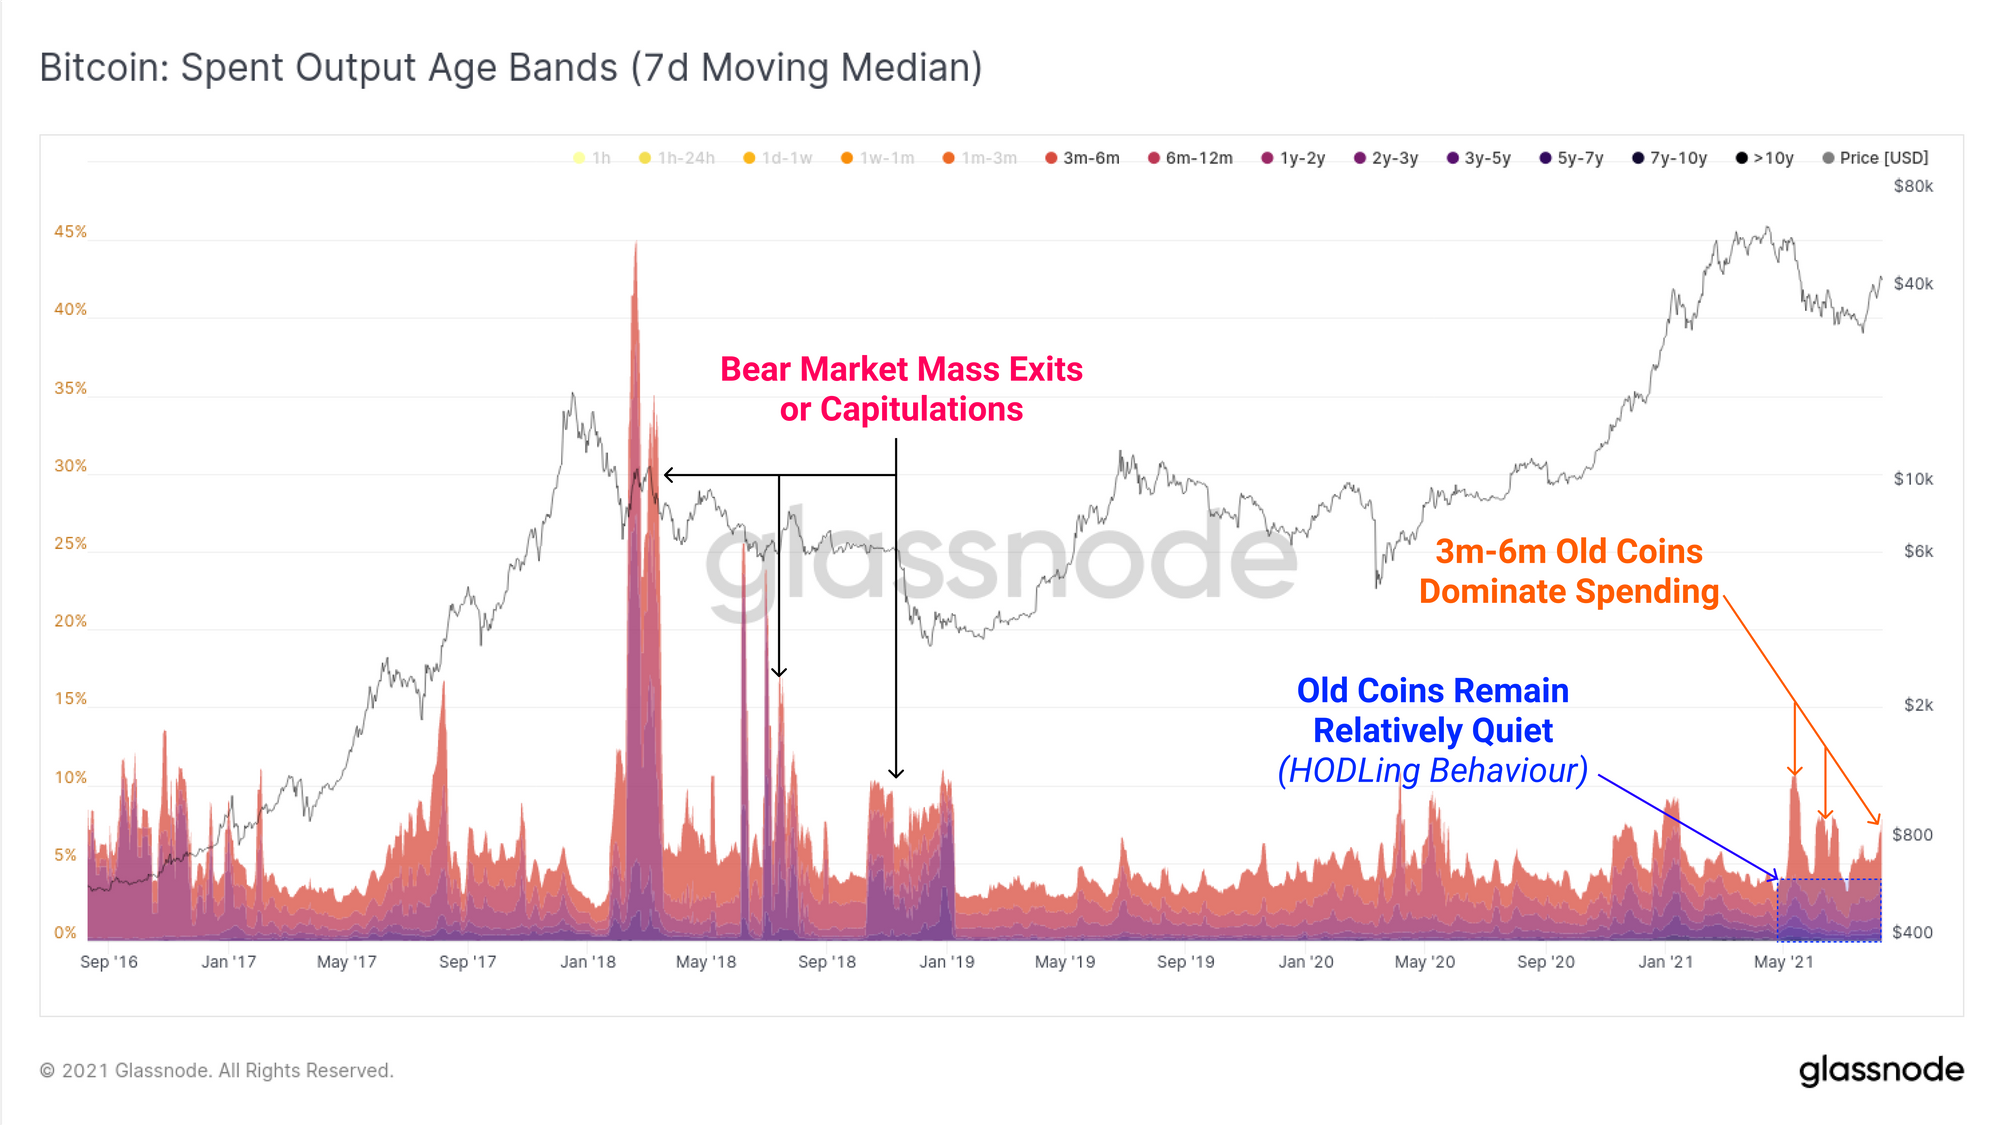
The Spent Output Age Bands demonstrate that on the whole, middle age (3m-12m) and old coins (> 1y) remain relatively dormant, and are not exiting the market seen in 2018. The majority of spending in this cohort are younger and aged between 3m-6m, representing bull market buyers. These transactors may be exiting or de-risking closer to their cost basis.
Overall, this metric remains fairly bullish in that urgent exit selling by old hands does not seem to be occurring.
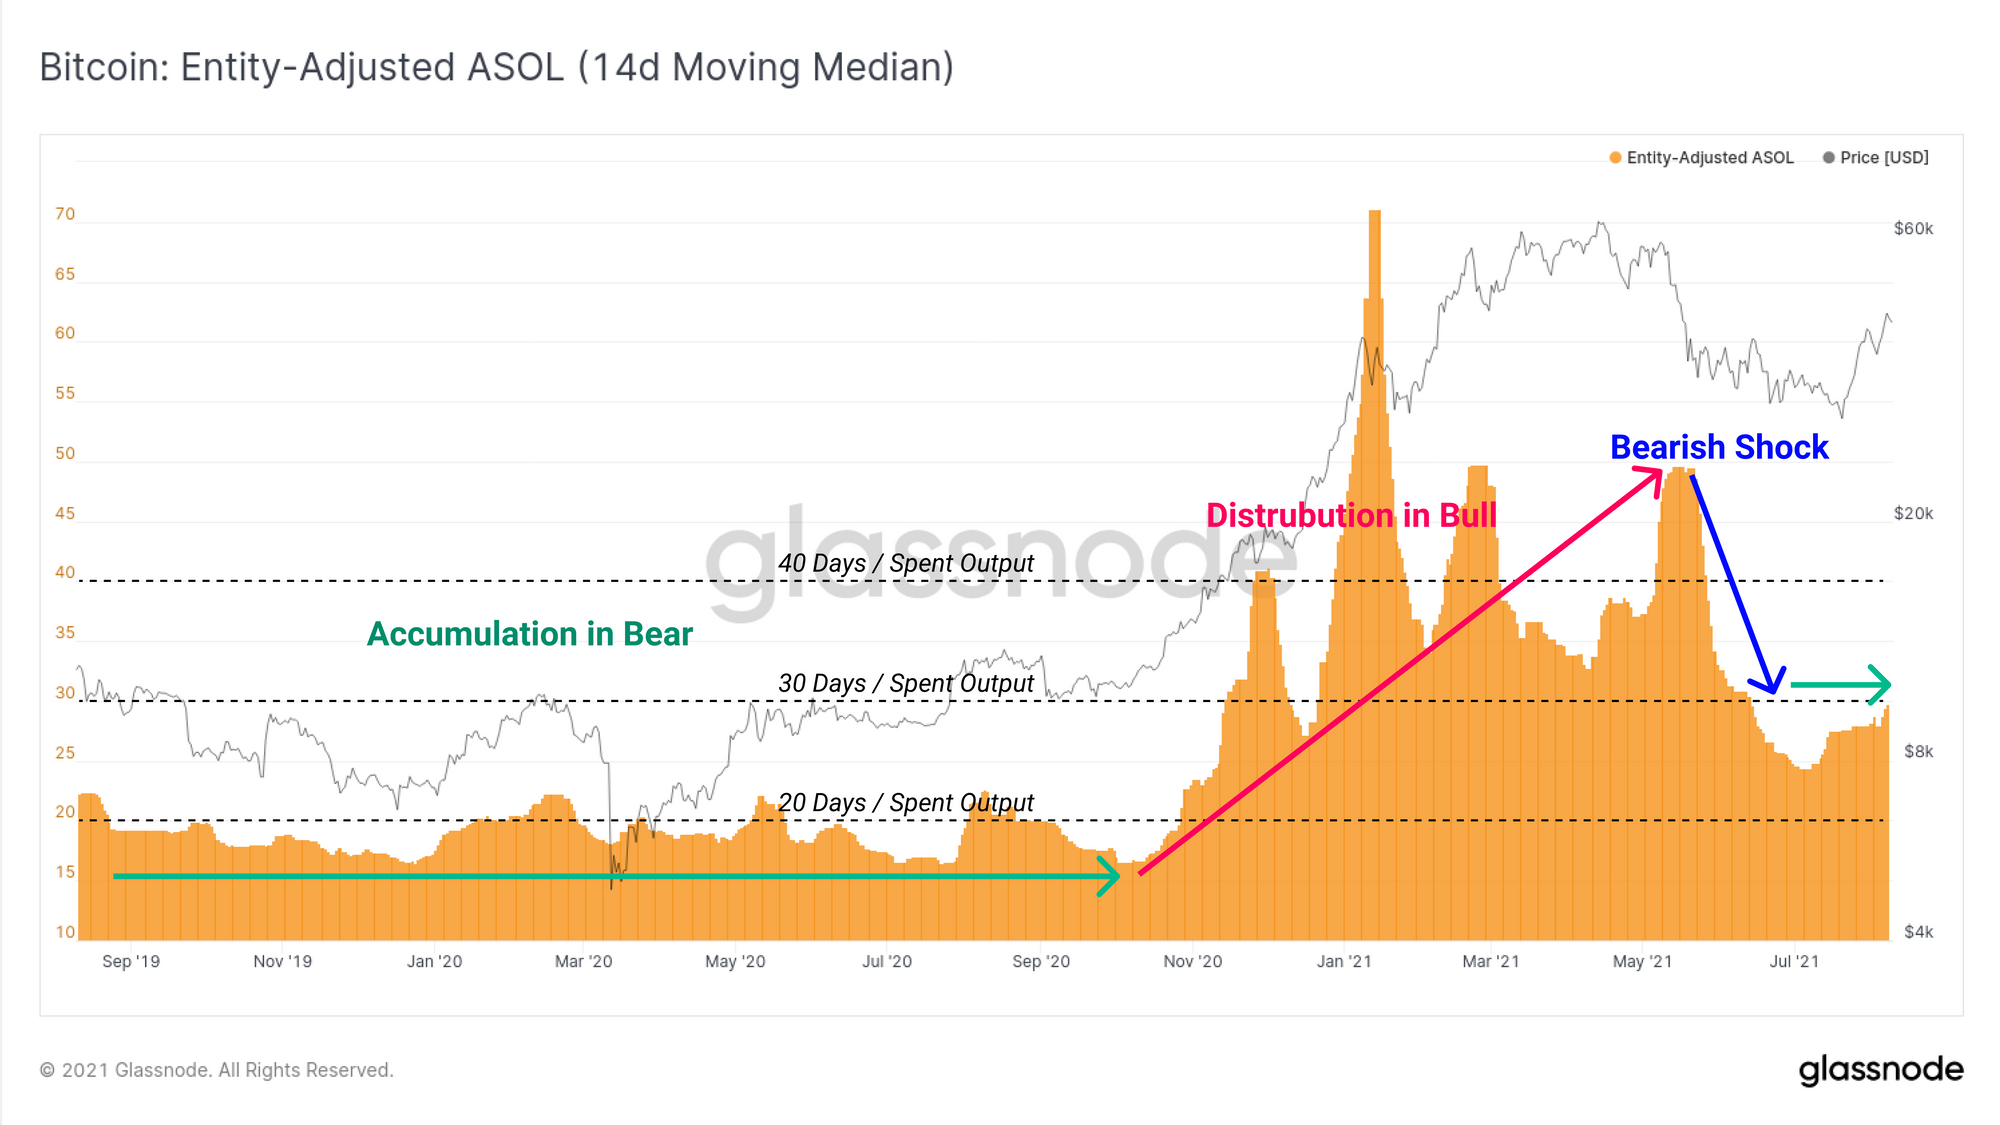
ASOL is a lifespan metric that generally confirms this observation. ASOL reflects the average age of spent outputs on a per transaction basis (no influence from coin volume spent).
ASOL traded higher throughout Q1 and Q2 as old coins were distributed, eventually putting the top in. The bearish shock in May caused this metric to collapse lower, indicating that owners of older UTXOs were largely unwilling to sell at those prices (and did not panic sell).
ASOL hasn't returned to the 2020 lows (~20-days), however appears to be trading sideways again. A strong uptrend in ASOL from here would be bearish as it indicates old coins are spent back into liquid circulation. Conversely, ASOL trading sideways to down (as it currently is) would suggest conviction, accumulation and HODLing prevails.
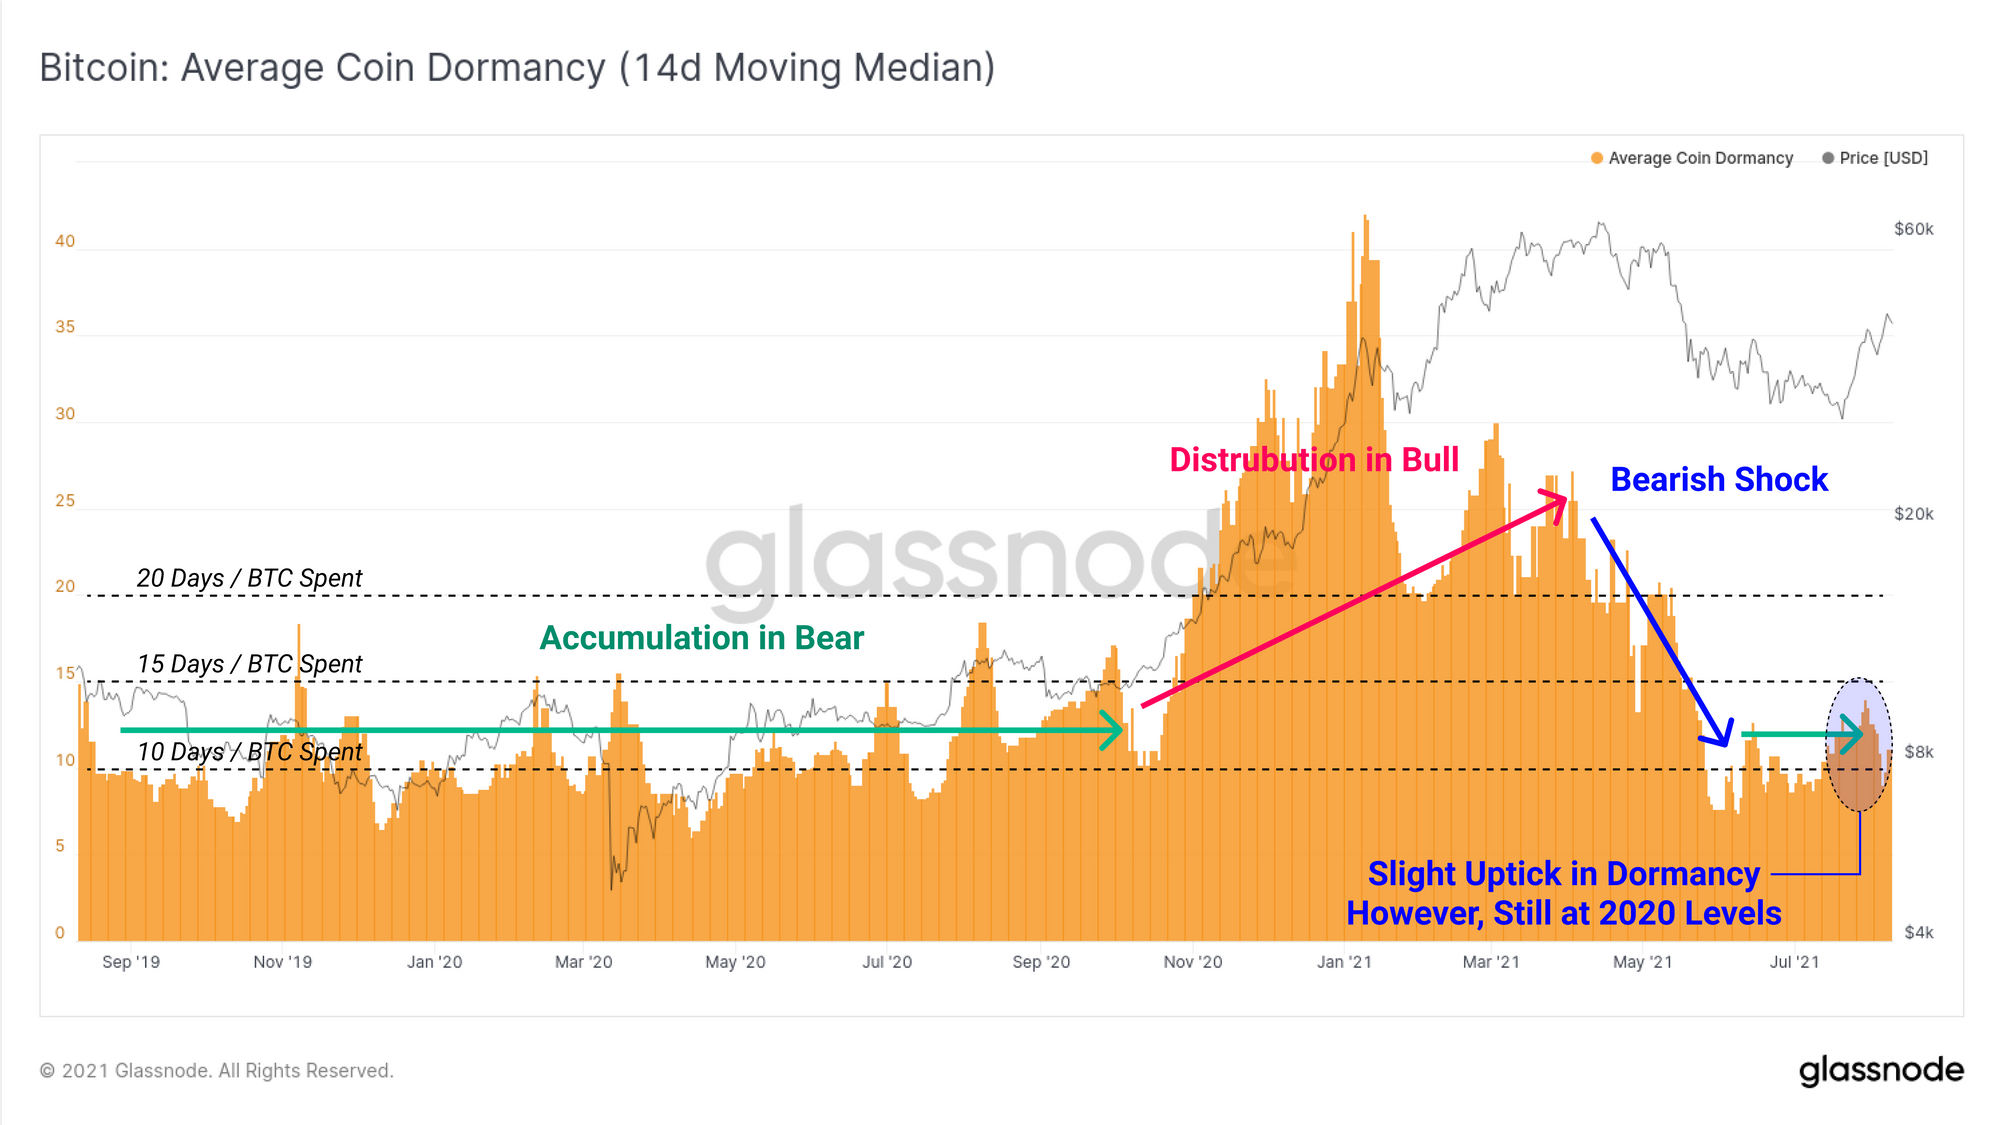
On a 14-day median basis, Average Coin Dormancy has returned to around 10-days, the same level as the period of accumulation throughout 2019 and 2020. This lifespan metric presents the average lifespan of spent coins on a per BTC spent basis. It provides further evidence that old hands are not taking exit liquidity at this stage.
This is likely constructive for prices ahead.
Large Transactions Dominate
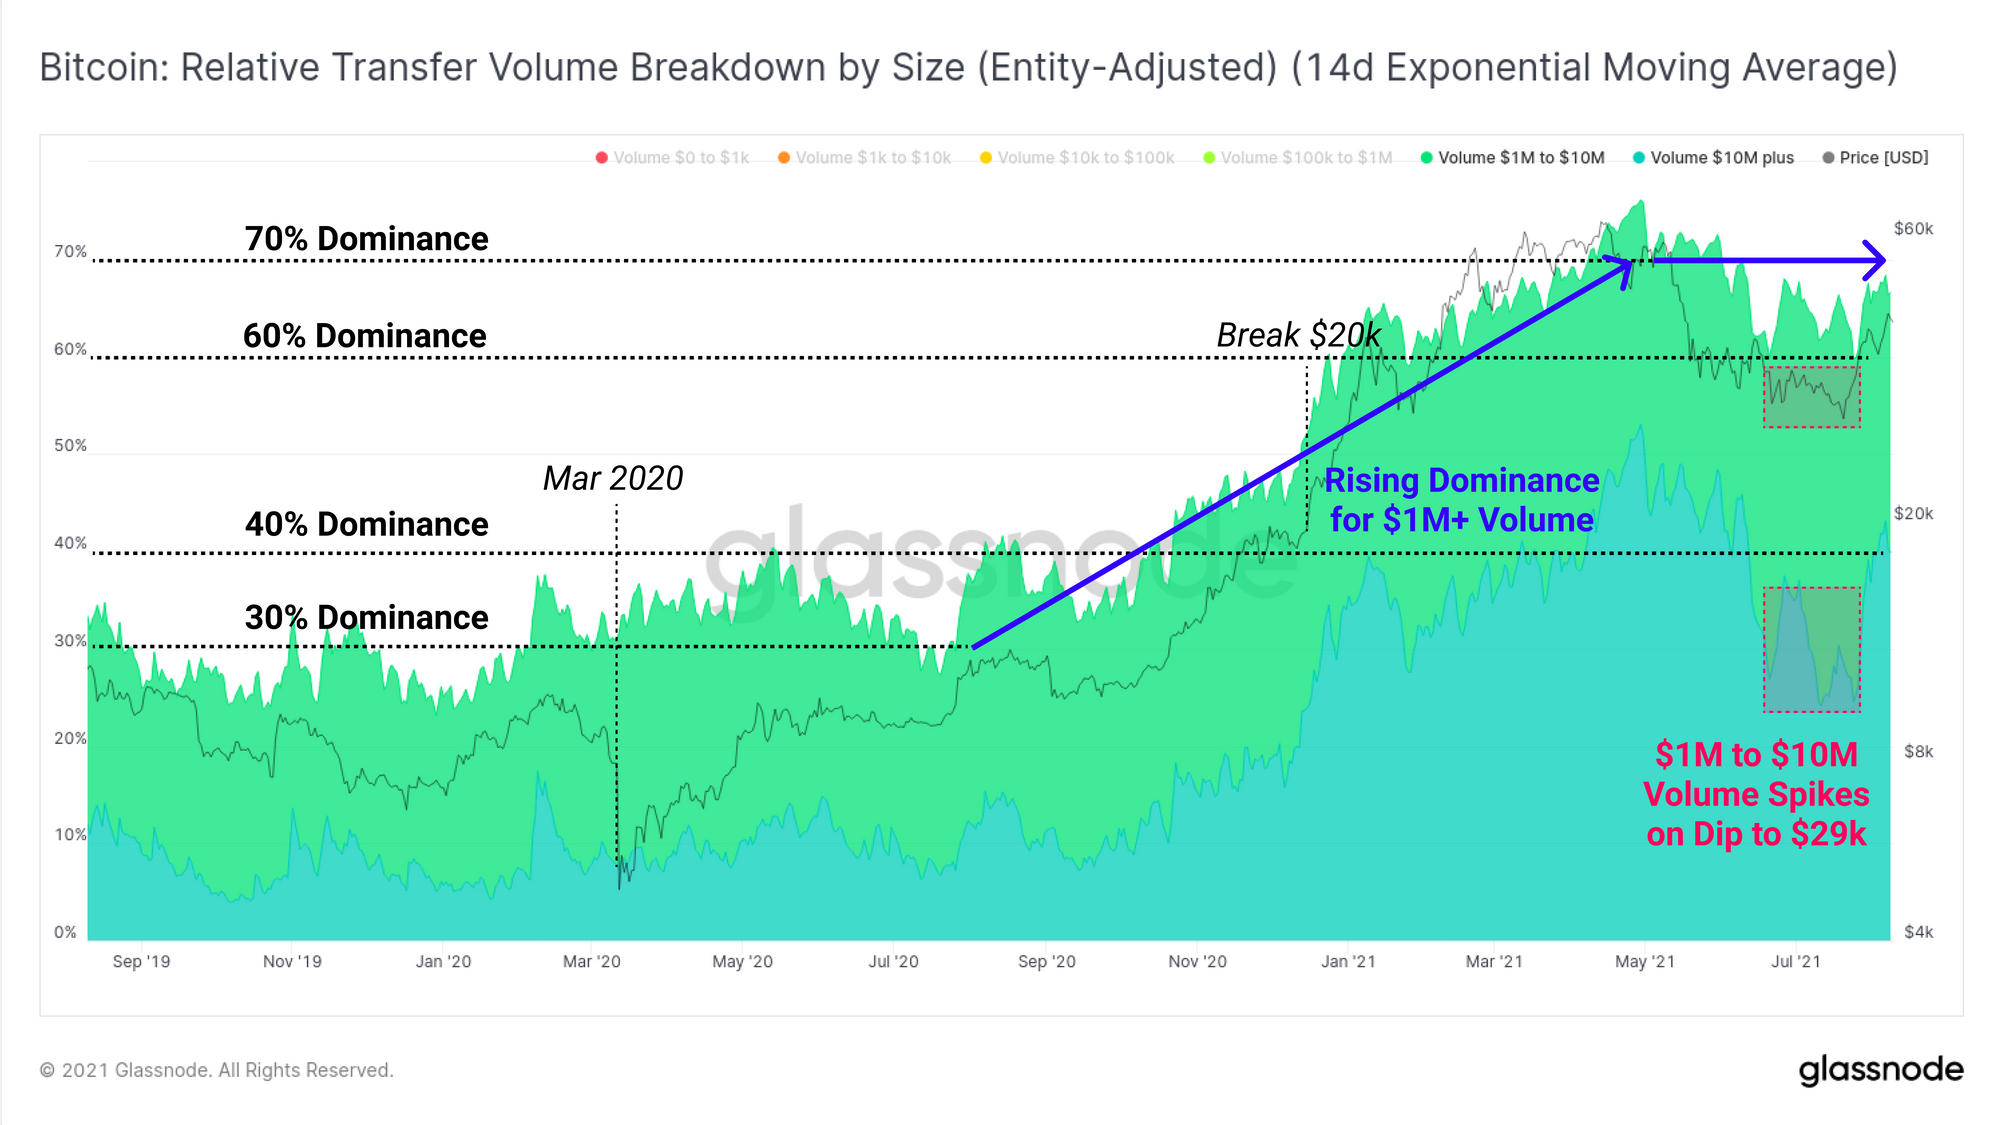
If we investigate the dominance of transactions by size, we can see a clear trend in play. The chart below shows dominance by on-chain transaction volume for values exceeding $1M+ (~23 BTC+ at $43.5k). Since September 2020, the dominance of these large size transactions has risen from 30%, to 70% of the total value transferred.
As the market traded down to the lows of $29k in late July, the $1M to $10M transaction group spiked markedly, increasing dominance by 20%. This week, the dominance of $10M+ volume followed through with a spike of 20% dominance supporting the price rally.
Given the lifespan analysis above suggests older coins have been largely dormant of late, this suggests that these large size transactions are more likely to be accumulators than sellers and is again, fairly constructive for price.
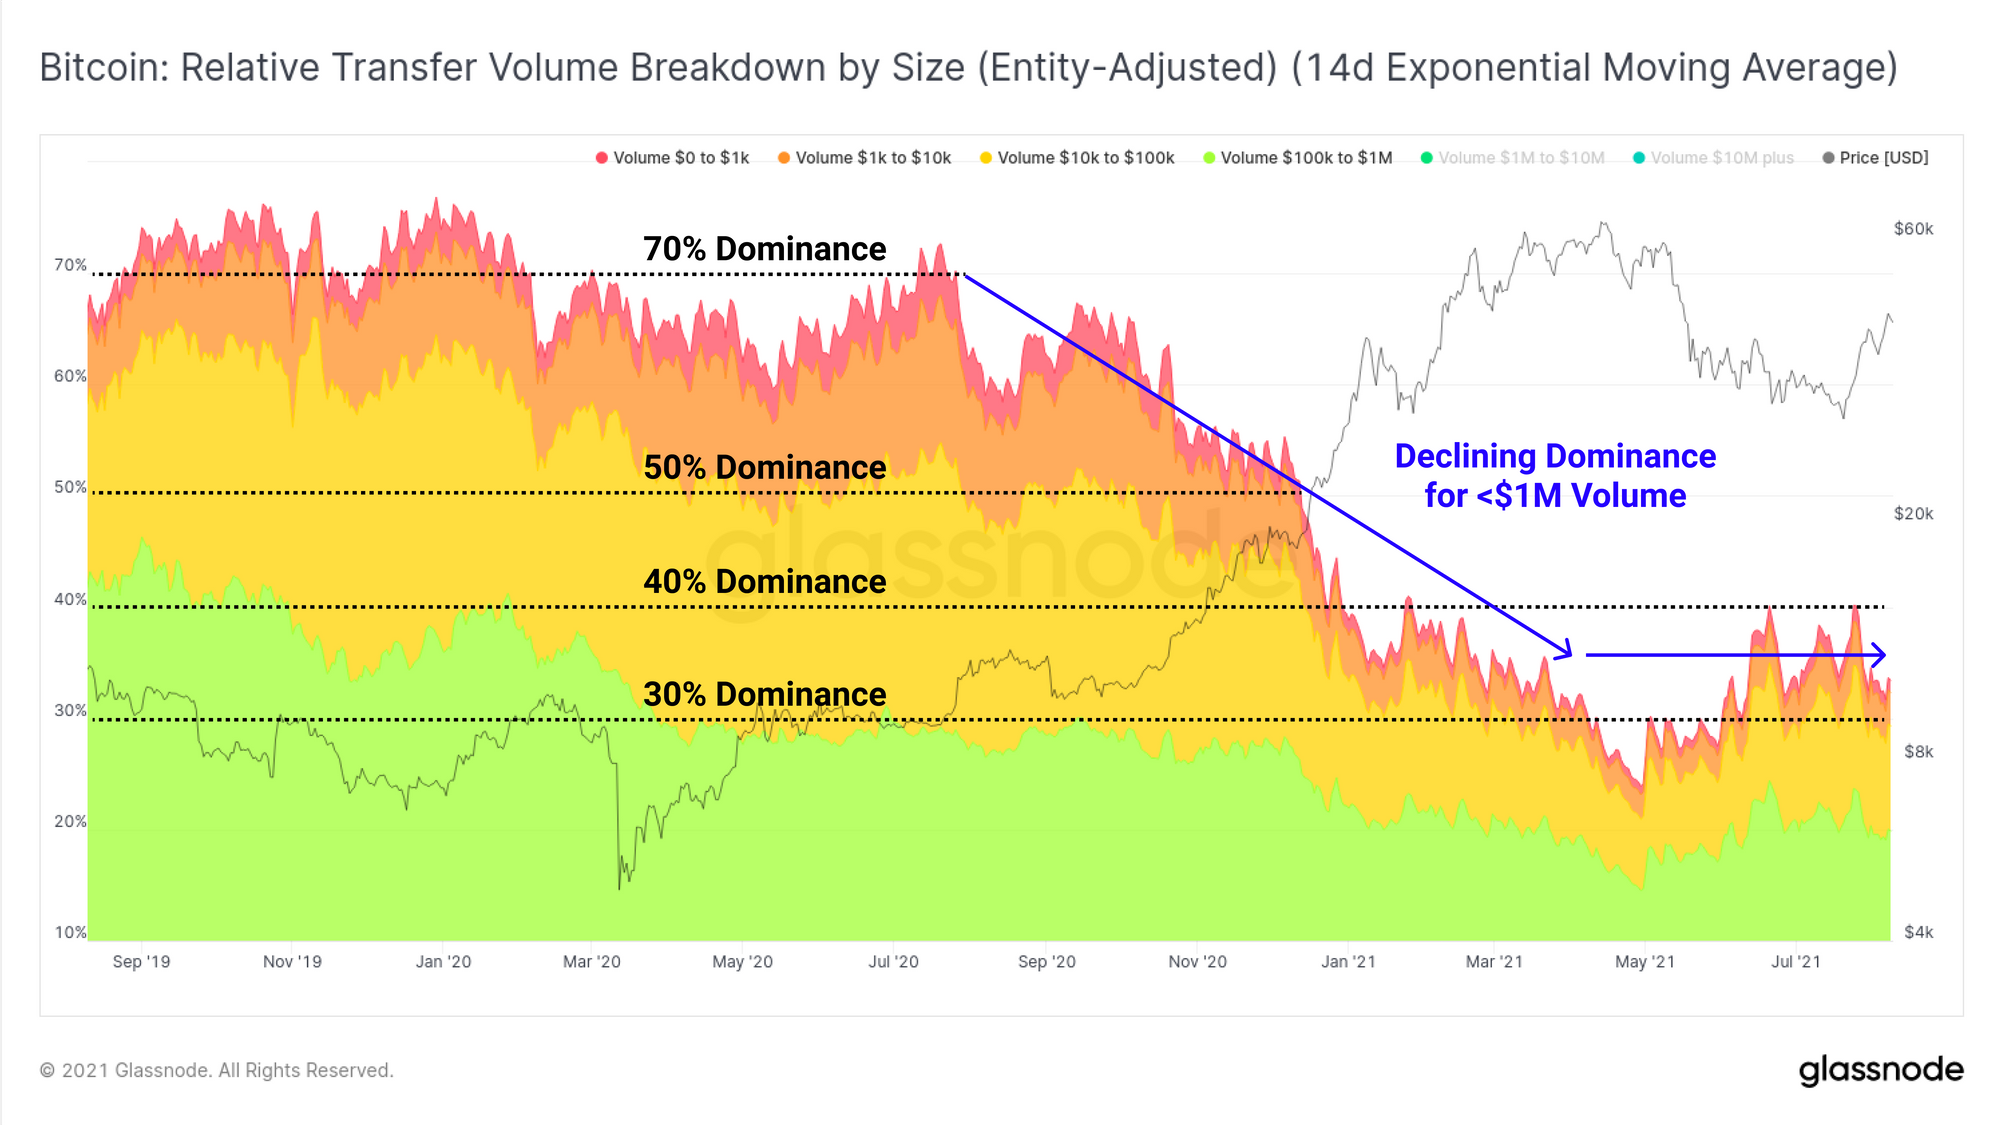
The other side of this equation, the chart below demonstrates a structural decline in small size transaction dominance. Transactions of less than $1M in size have declined from 70% to around 30%-40% dominance. These two charts clearly demonstrate a new era of institutional and high net worth capital is flowing through the Bitcoin network since 2020.
Supply Squeeze Assessment
A popular talking point of late has been the potential for a Bitcoin supply squeeze.
Indeed, we have seen an extraordinary recovery of Long-Term Holder (LTH) owned coins, with total supply held approaching 12.48M BTC. This is extremely similar to the volume of coins held by LTHs in October 2020 before the primary bullish impulse started.
This on-chain response is largely indicative of the volume of coins that were accumulated in Q1 2021 that remain tightly held. It too paints a quite bullish picture for aggregate market conviction.
Although do note, increases in LTH supply is a characteristic of bear market accumulation; and bull markets are the result of a supply squeeze, forged in bear markets.
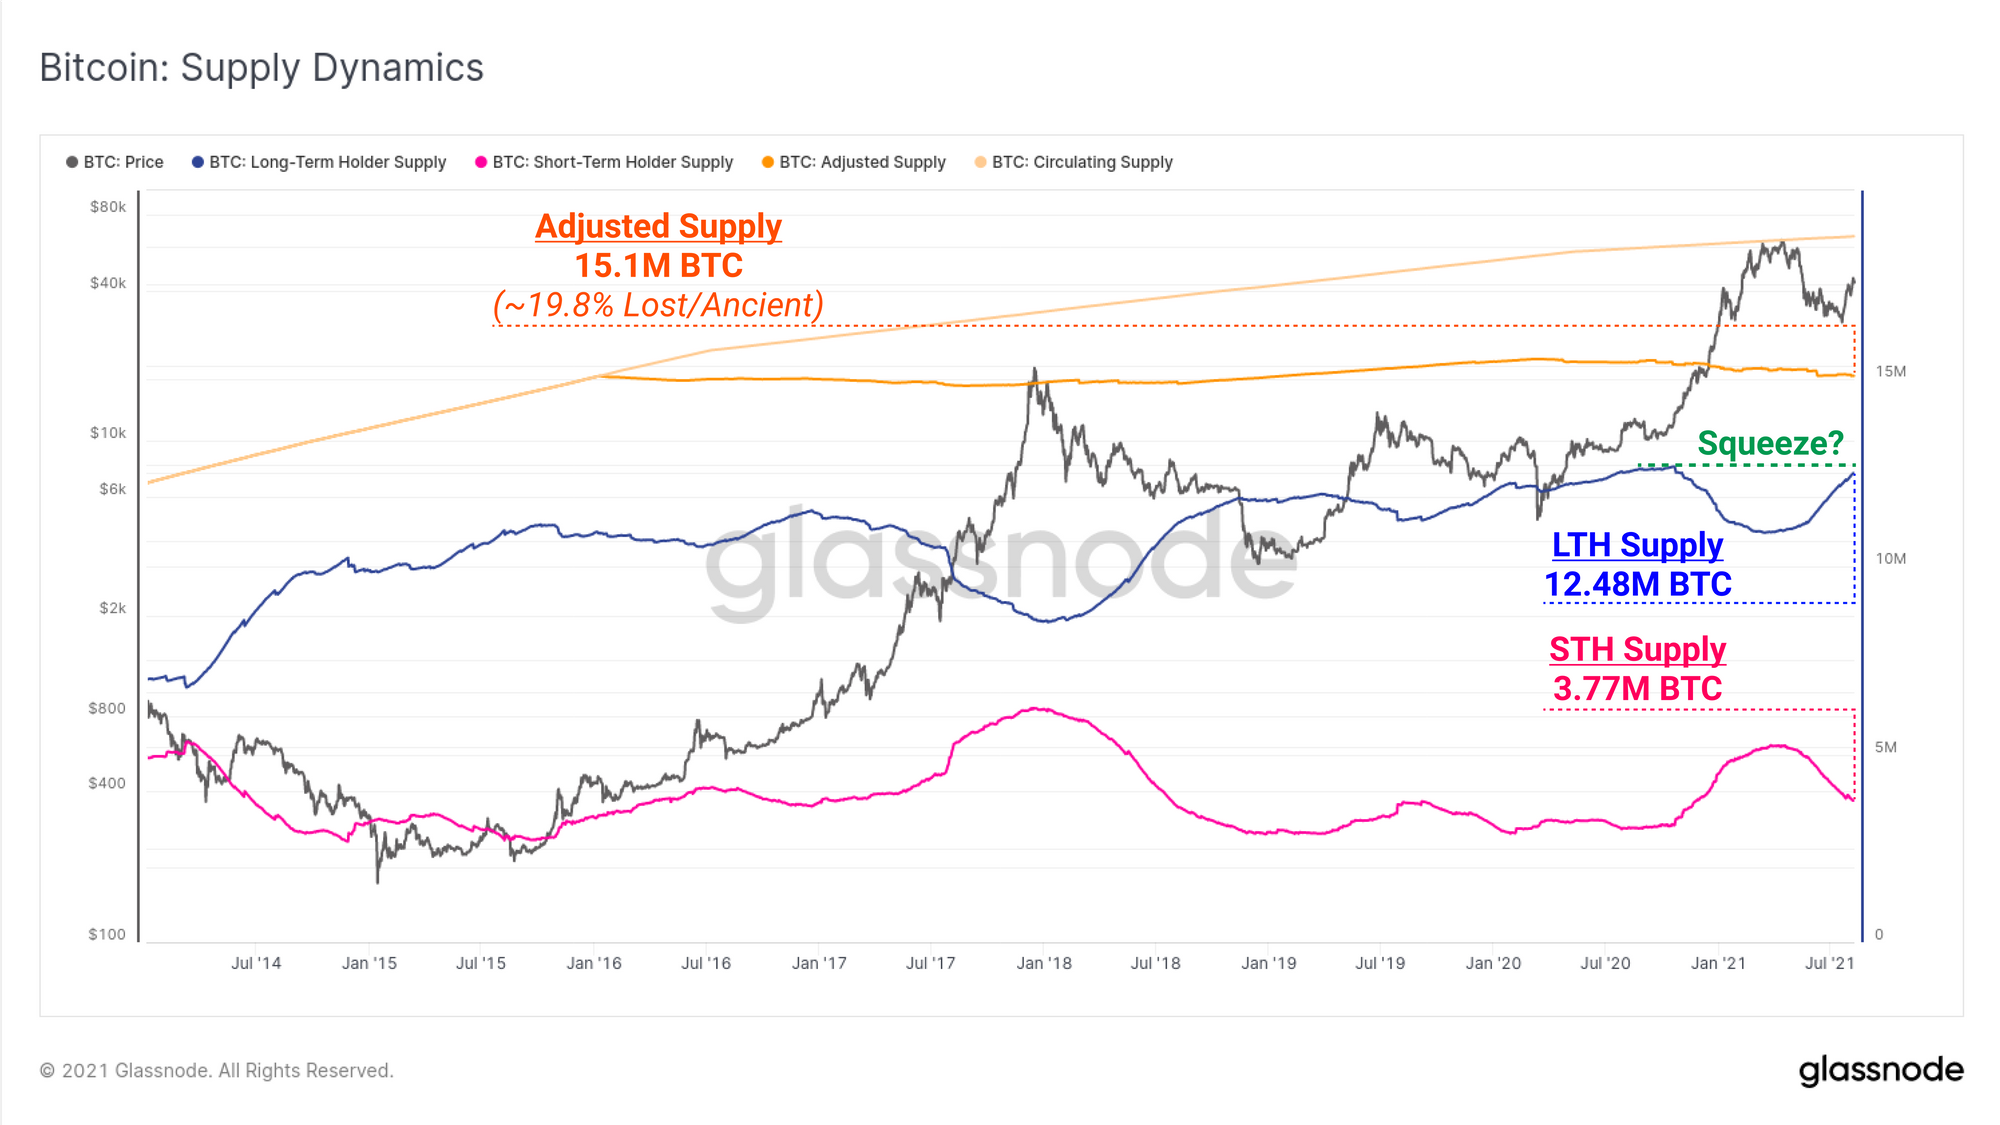
In the chart above, we have also shown the circulating and adjusted supply metrics. Adjusted supply accounts for coins that are either likely lost, or ancient and deemed extremely illiquid and unlikely to freely circulate.
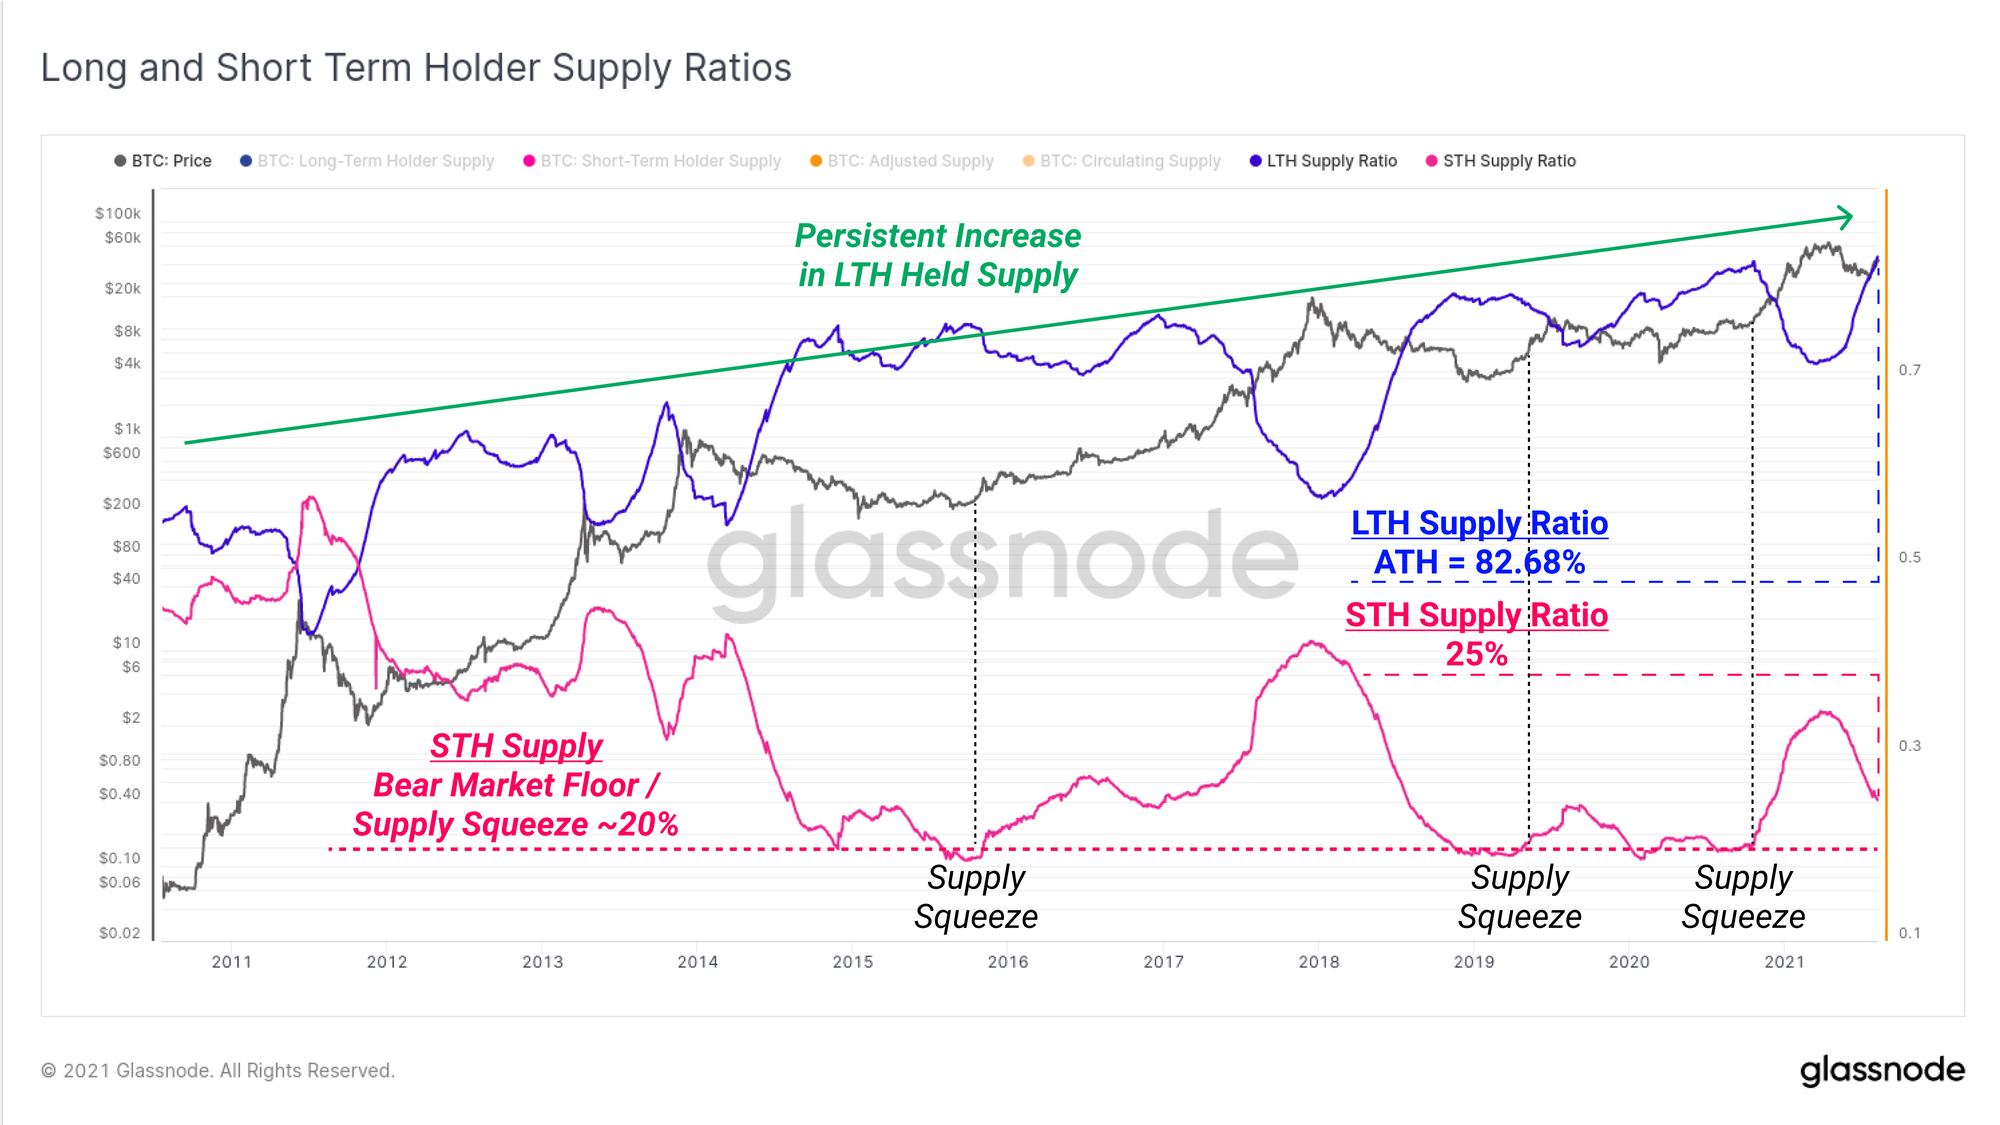
We have used Workbench to take the ratio between LTH, or STH held supply, and the Adjusted Supply to see the proportion of 'freely circulating' coins owned by each cohort. By this metric:
- LTH Owned Supply has just reached a new All-Time-High of 82.68%. Note also the persistent uptrend in coins held by these long term investors over time.
- STH Owned Supply continues to decline suggesting HODLing and coin maturation is in play.
- Major Supply Squeezes have historically occurred when the STH Supply Ratio hits 20% (often holding that level for some time), representing a significant constraint on freely circulating supply.
The STH Supply Ratio is currently at 25% suggesting that a further maturation of only 5% of adjusted supply would put the market firmly back into historical supply squeeze conditions.
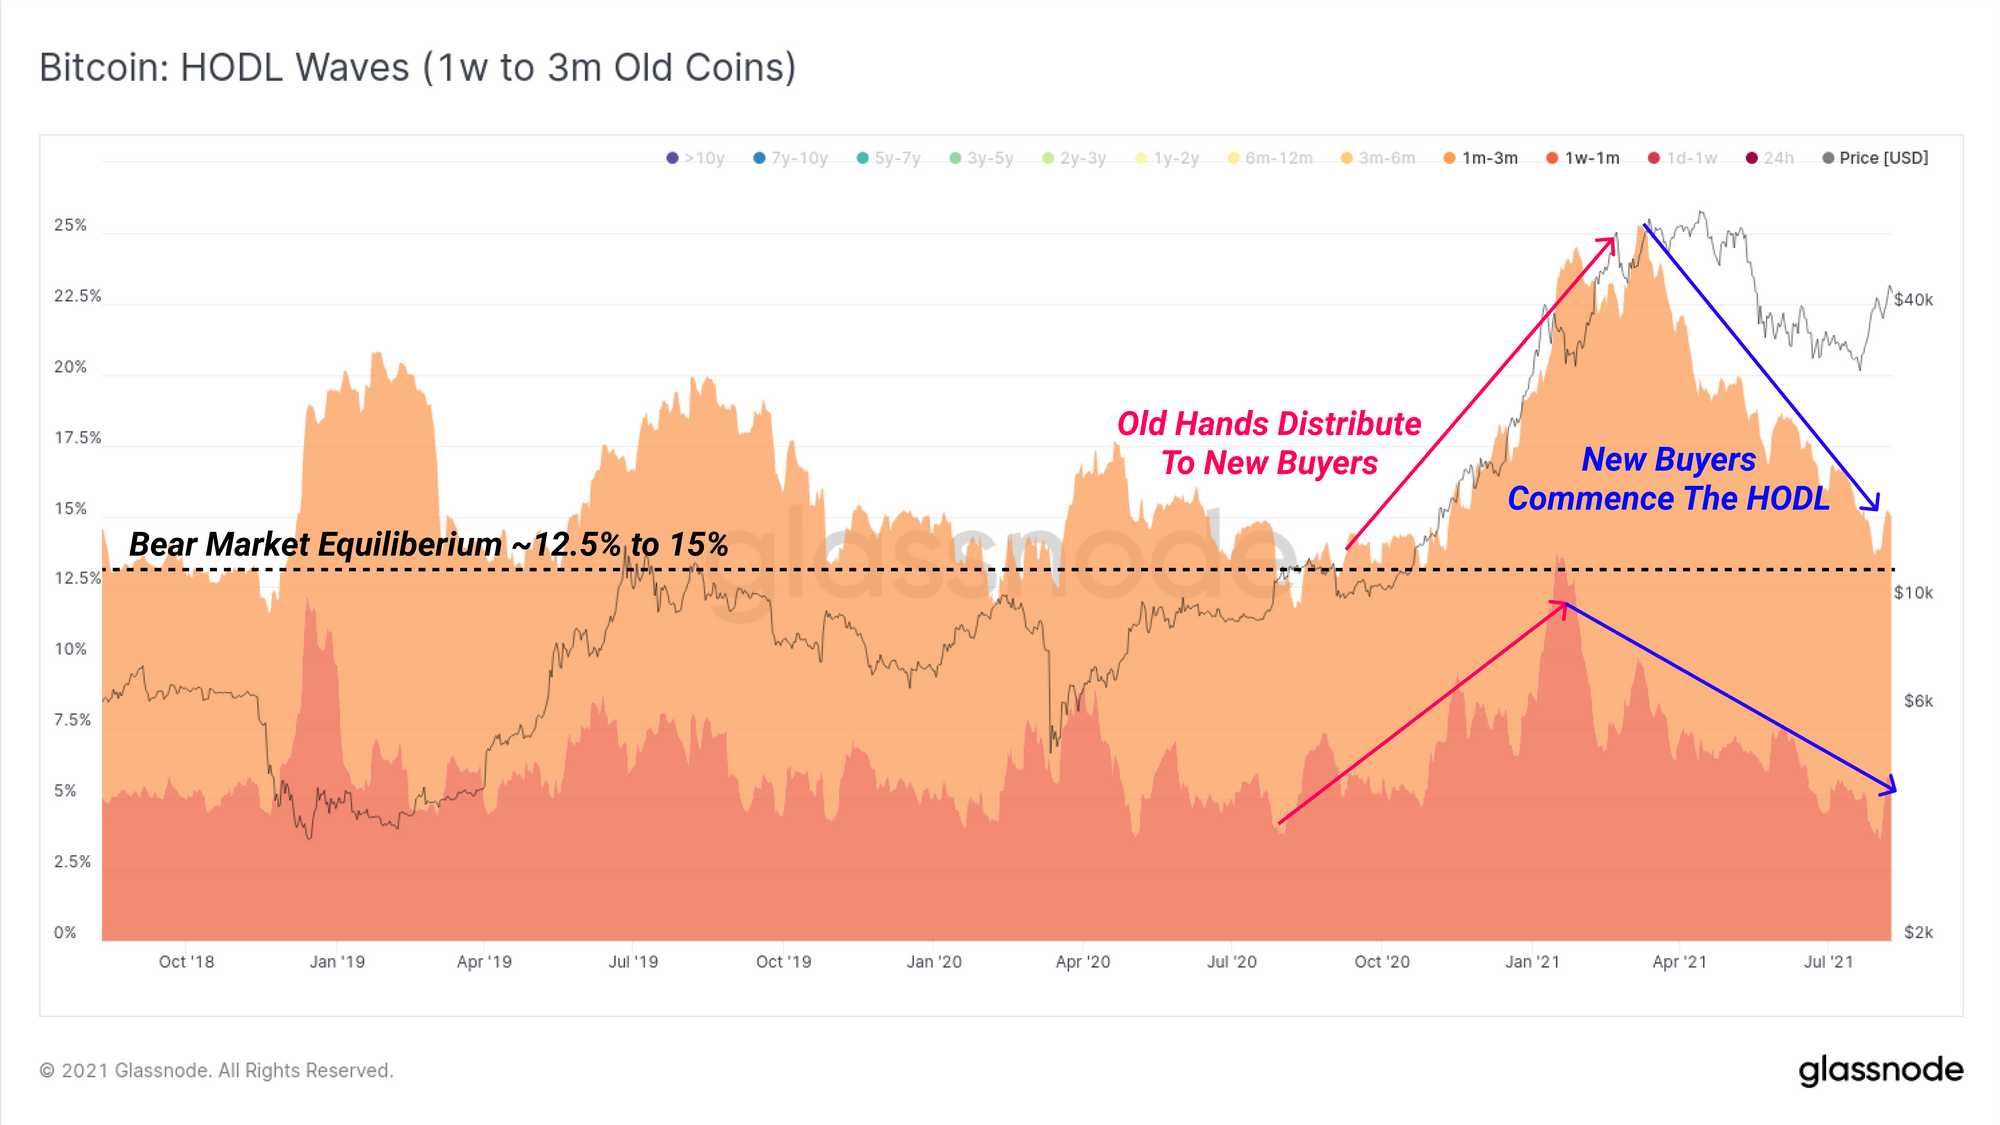
To assess how likely the remaining 5% of adjusted supply is to be accumulated and maturing, we can inspect the HODL waves.
Relatively young coins aged between 1w and 3m represent a large portion of the liquid supply. We can see that after the uptrend in Q1 (old coin distribution), these age brackets have fallen back to bear market equilibrium level of around 12.5% to 15% of supply. This downtrend indicates that coin maturation is indeed in play, and that many of the 2021 bull market buyers have stuck around to become strong hand HODLers.
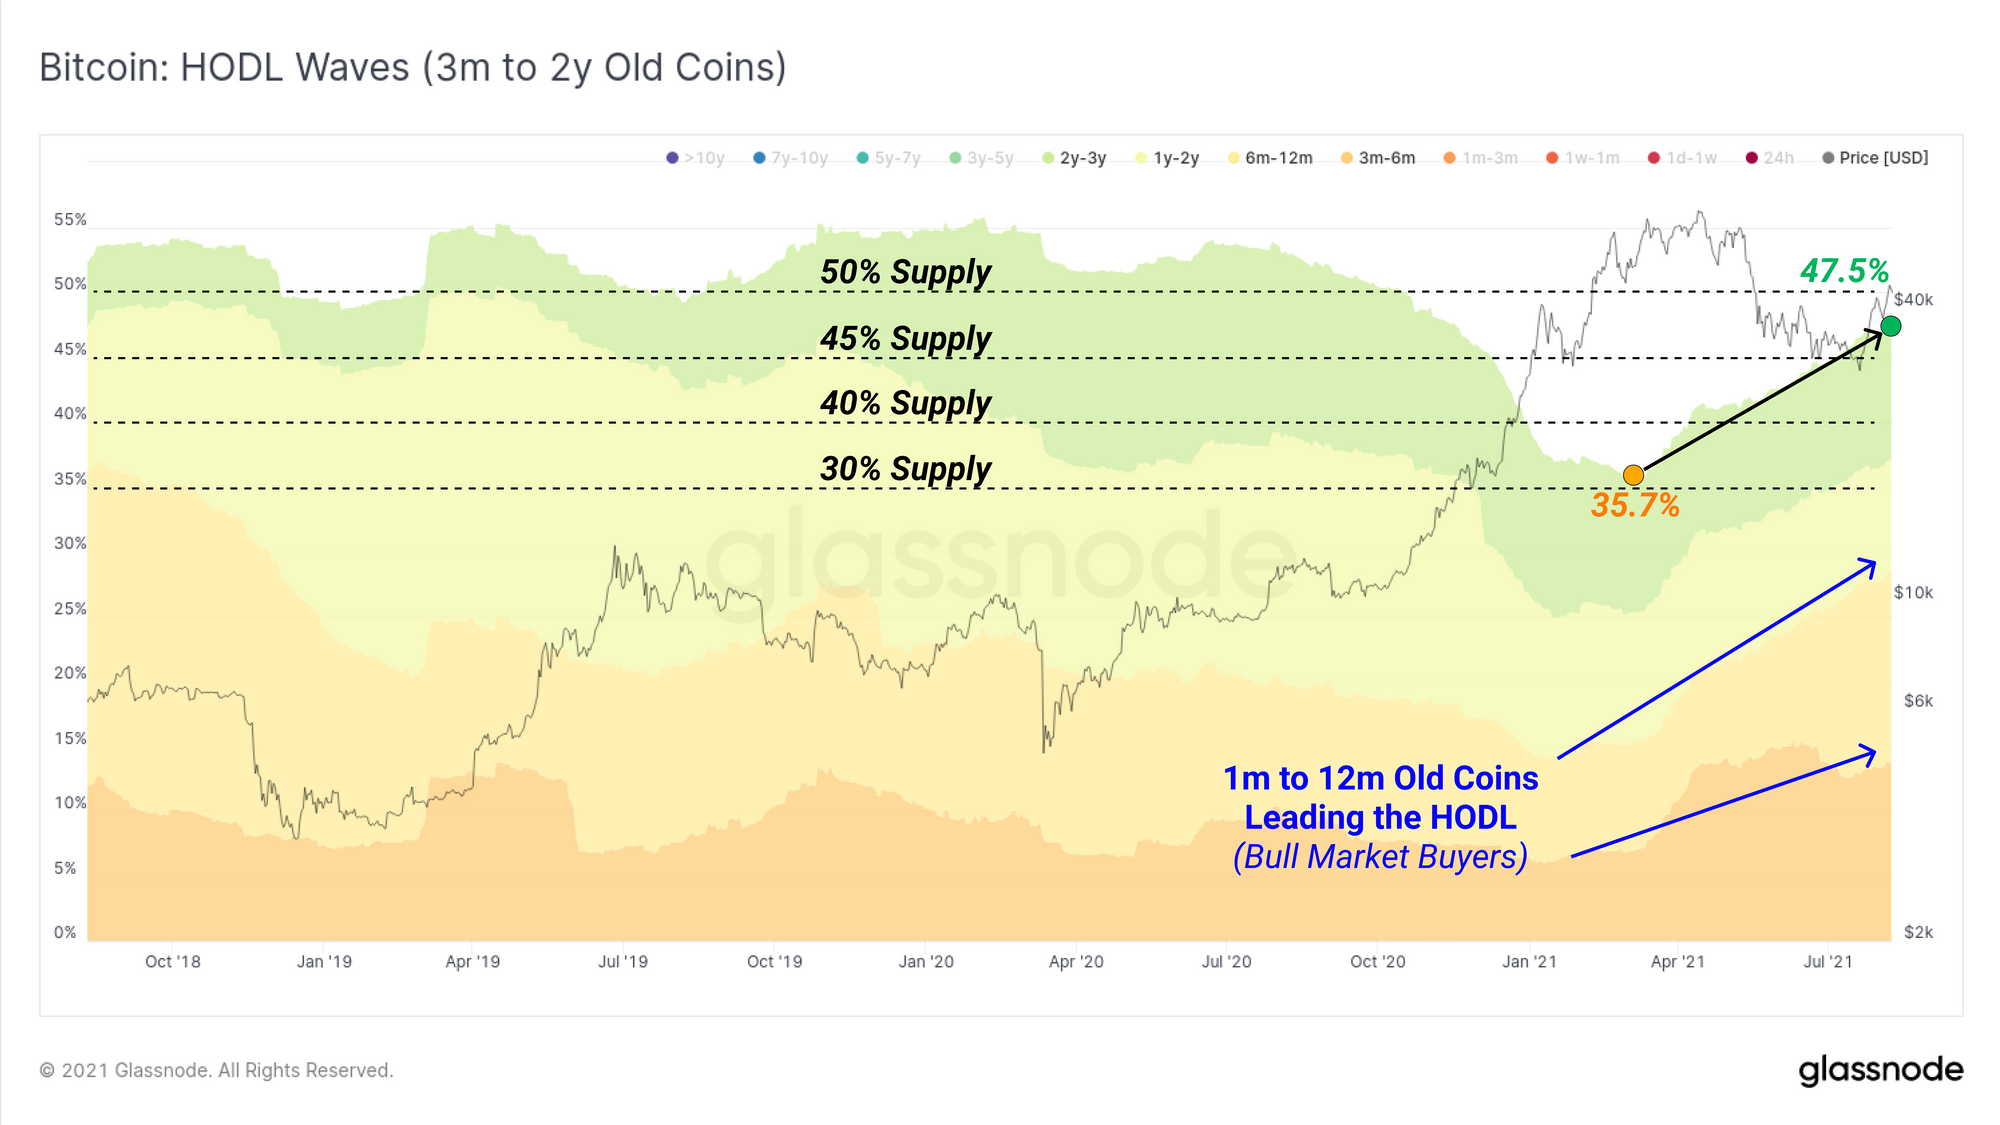
This is largely confirmed by observing the middle to old coin age bands (3m to 2y) which show a remarkable increase in supply from 35.7% to 47.5% of the circulating supply (not adjusted supply). Coins aged 3m to 12m (Bull market buyers) are leading the charge on HODLing behaviour, displaying an undeniable trend of coin maturation.
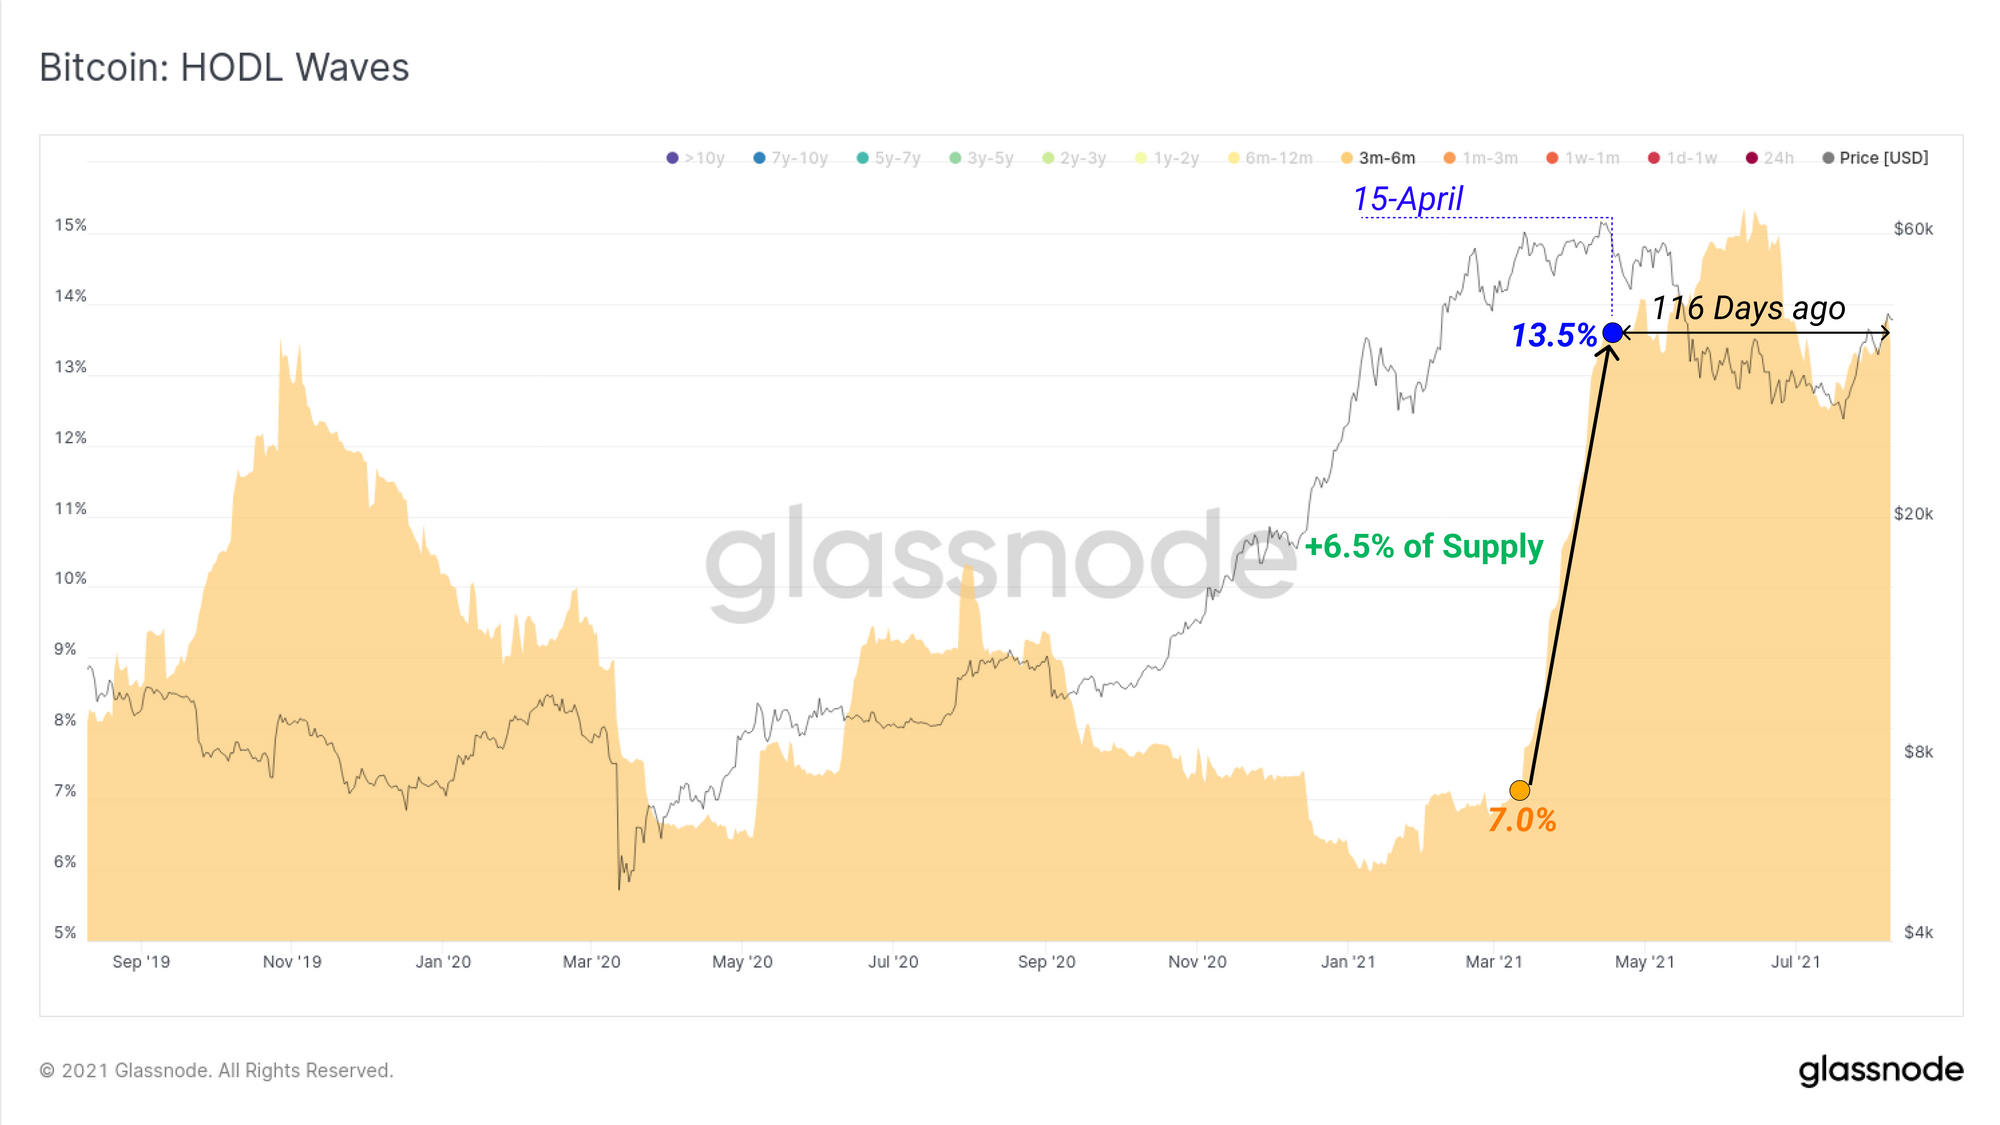
Of particular note is the 3m to 6m age band, which currently holds 13.35% of the coin supply, and includes the approximate threshold between STH and LTH (155-days). Approximately 6.5% of the entire coin supply reached 3-month maturity on the 15-April, and it appears that these coins are still held.
Whilst the supply squeeze based on the STH Supply Ratio is not yet at 20%, there are numerous indicators and trends in play that suggest it may hit it in mid September (but that the conditions for a supply squeeze are already in play).
Weekly Feature: The EIP-1559 Burn
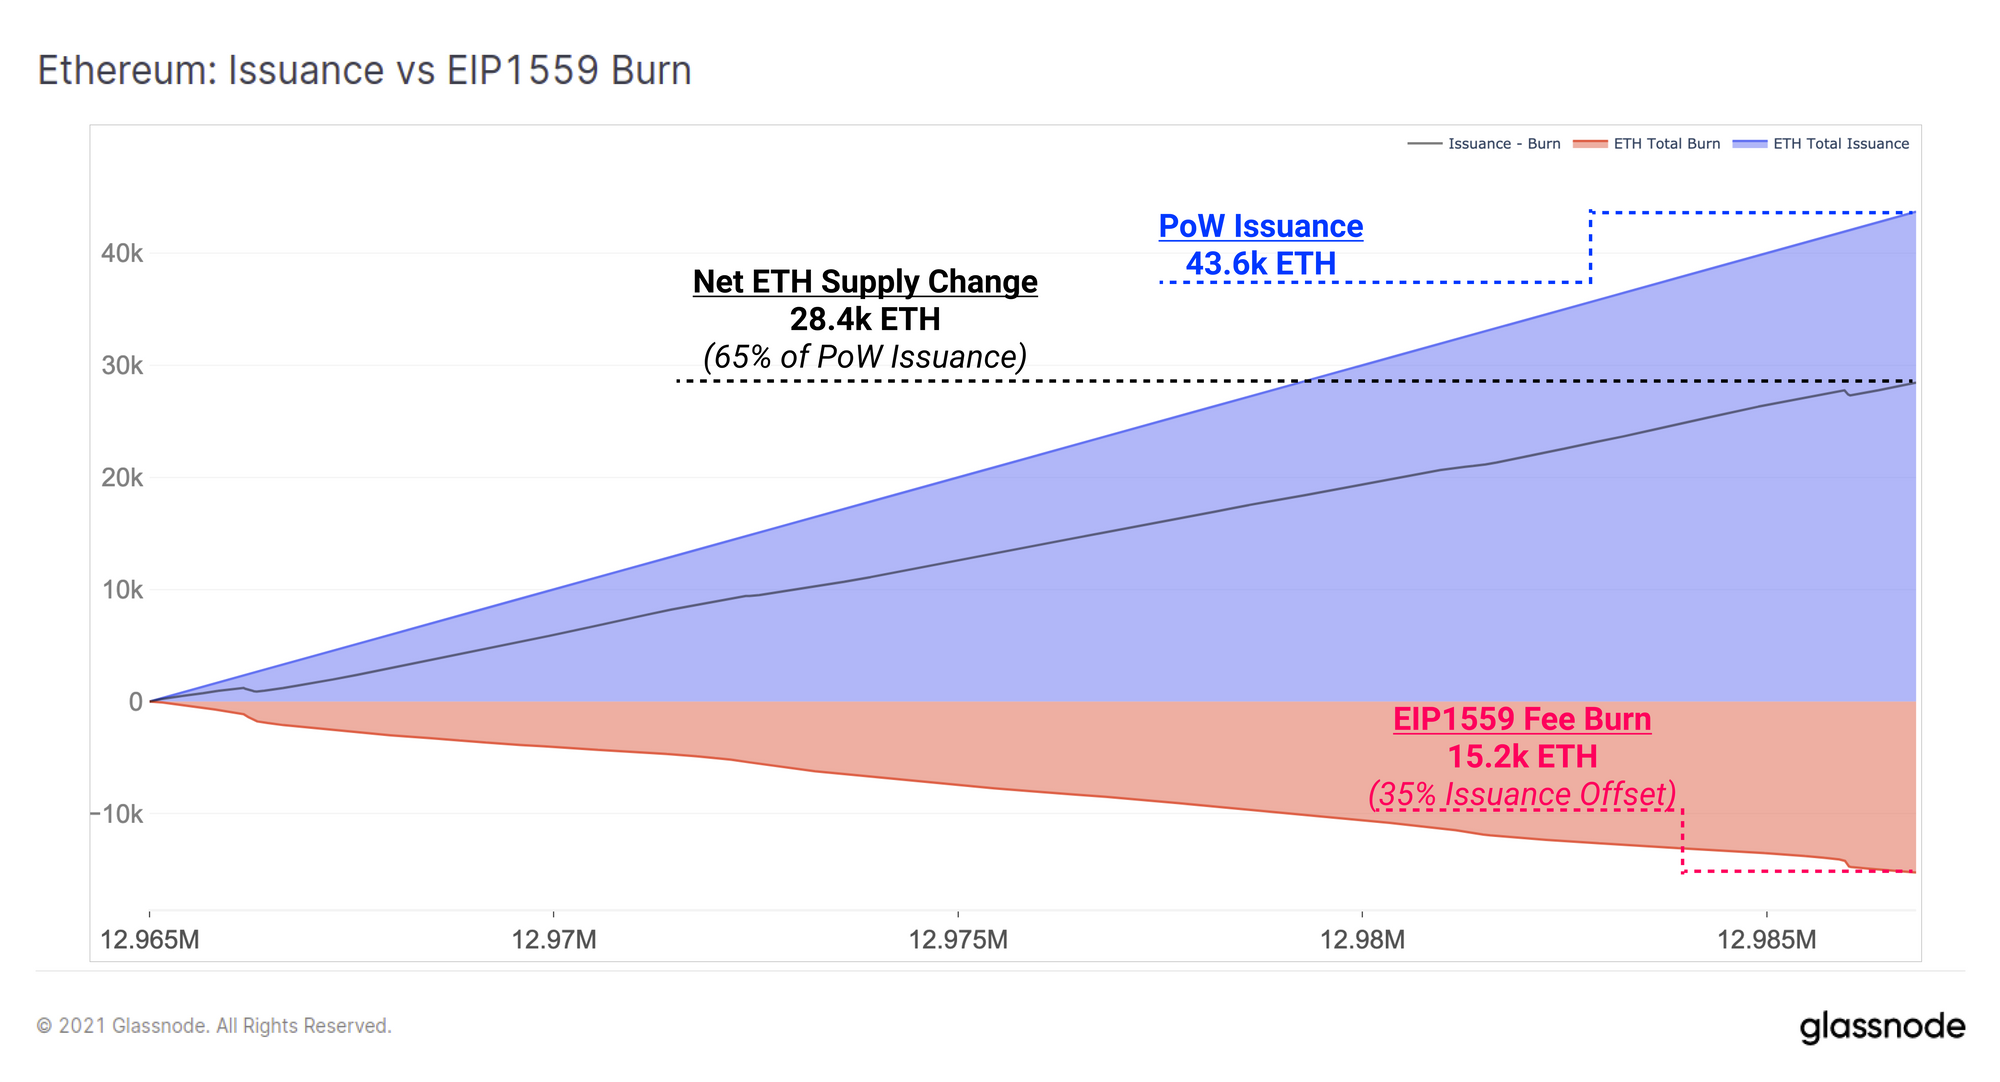
The Ethereum network has recently rolled out the London upgrade which includes the new fee stability mechanism EIP1559. As part of the implementation details is a burn mechanism for the BASE FEE portion of the transaction fee, denominated in ETH.
Since the launch of the London upgrade (block height 12,965,000) until the time of writing (block height 12,986,848), a total of 43.6k ETH has been issued via PoW mining. In that same time, a total of 15.25k ETH has been burned representing a 35% reduction in total net issuance.
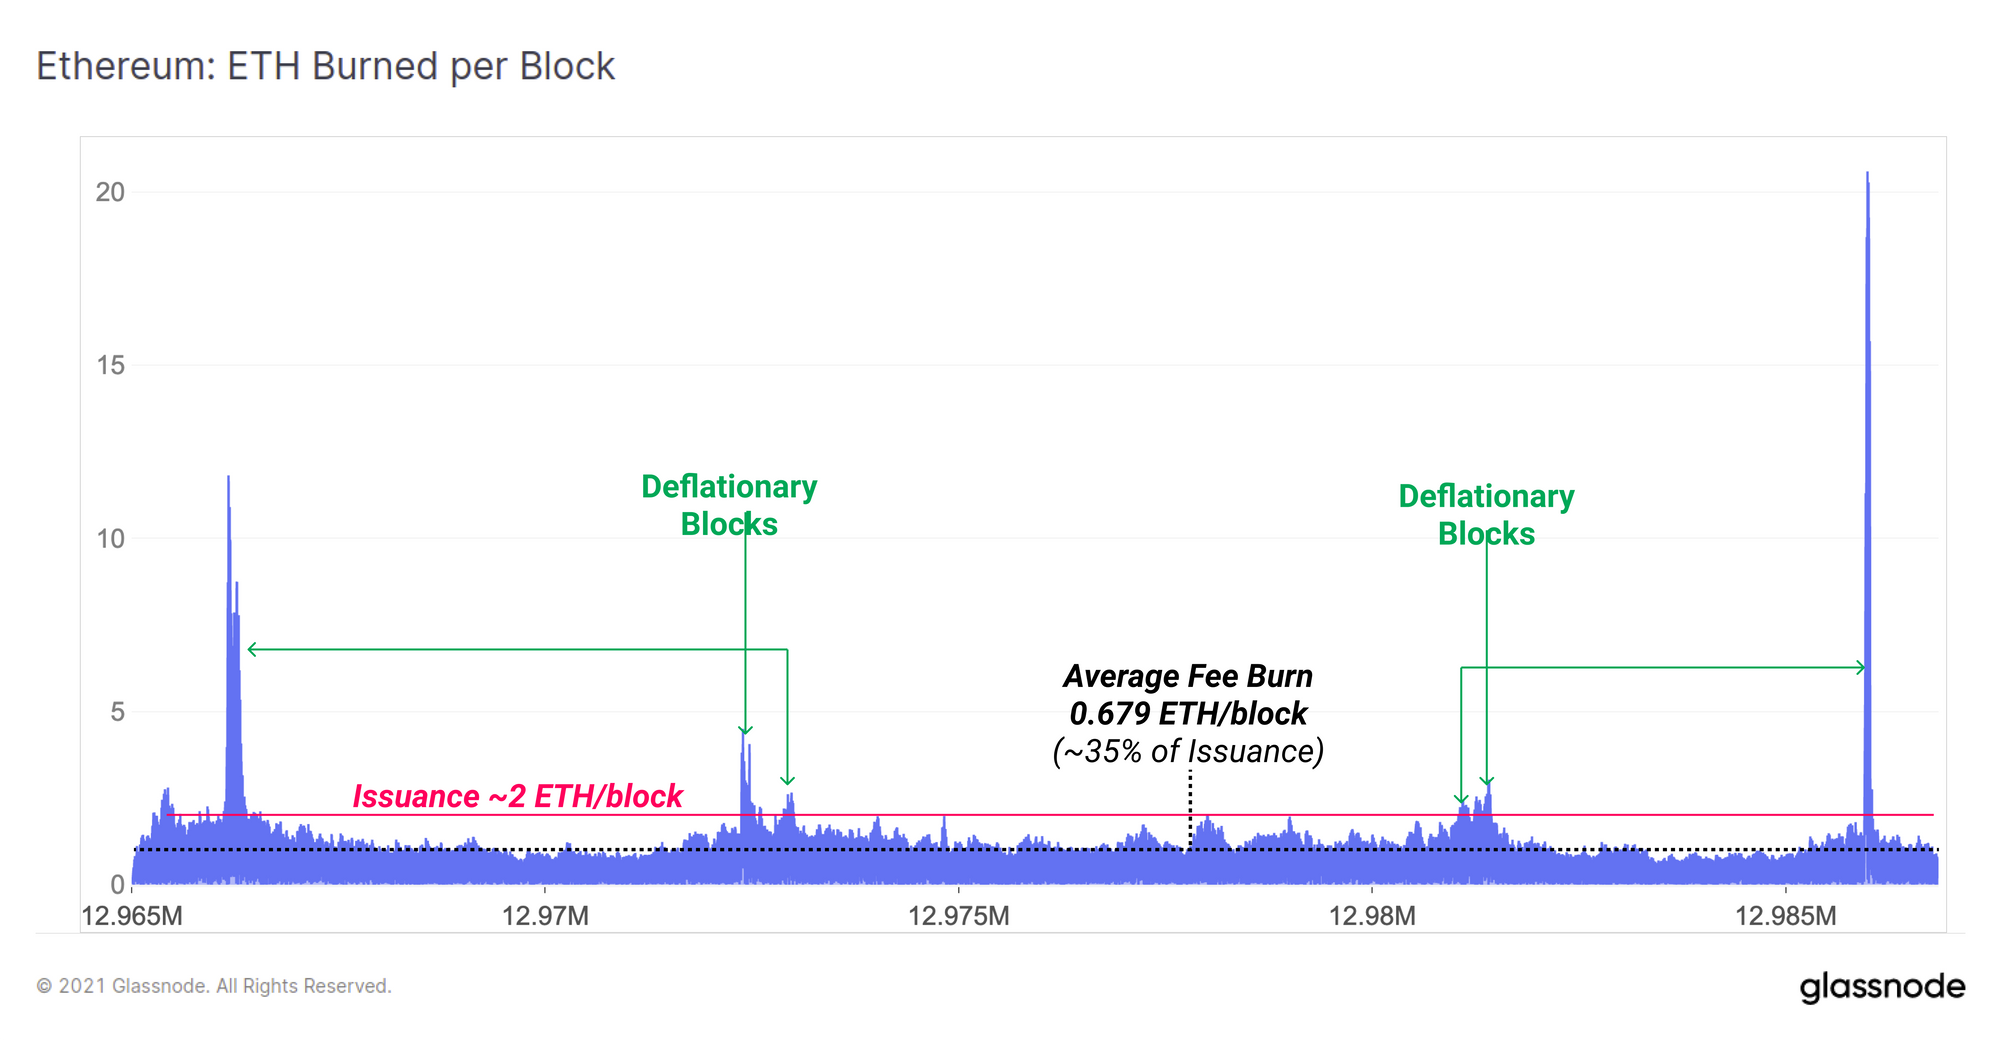
Taking as look at the volume of ETH burned per block, we can see that so far fee pressure has pushed the burning mechanism above the design 2 ETH issuance in a handful of instances creating net deflationary blocks. So far, EIP1559 has a mean burn rate of 0.697 ETH per block.
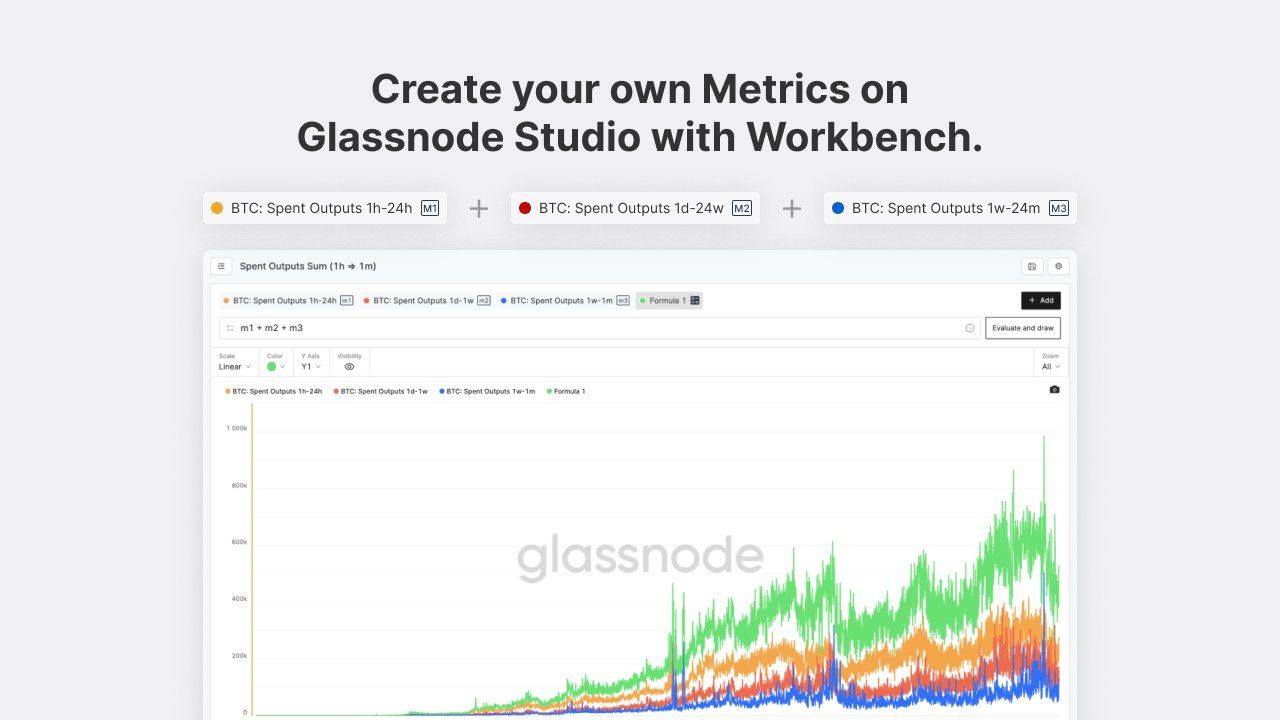
Major Feature Release: Workbench
We are pleased to release Workbench, a new tool available in Glassnode Studio to generate custom, multi-line charts and use our formula editor. This allows analysts to easily combine our metrics, create and save your own, and take on-chain analysis in new and unique directions.
Week On-chain Dashboard
The Week On-chain Newsletter now has a live dashboard for all featured charts