Short-Term Supply Dwindles

Bitcoin accumulation trends have softened in the short term, despite extremely constructive long-term demand trends. The potential energy for a capitulation event is in place, but is yet to manifest as it has in previous market cycles.

Short-Term Supply Dwindles

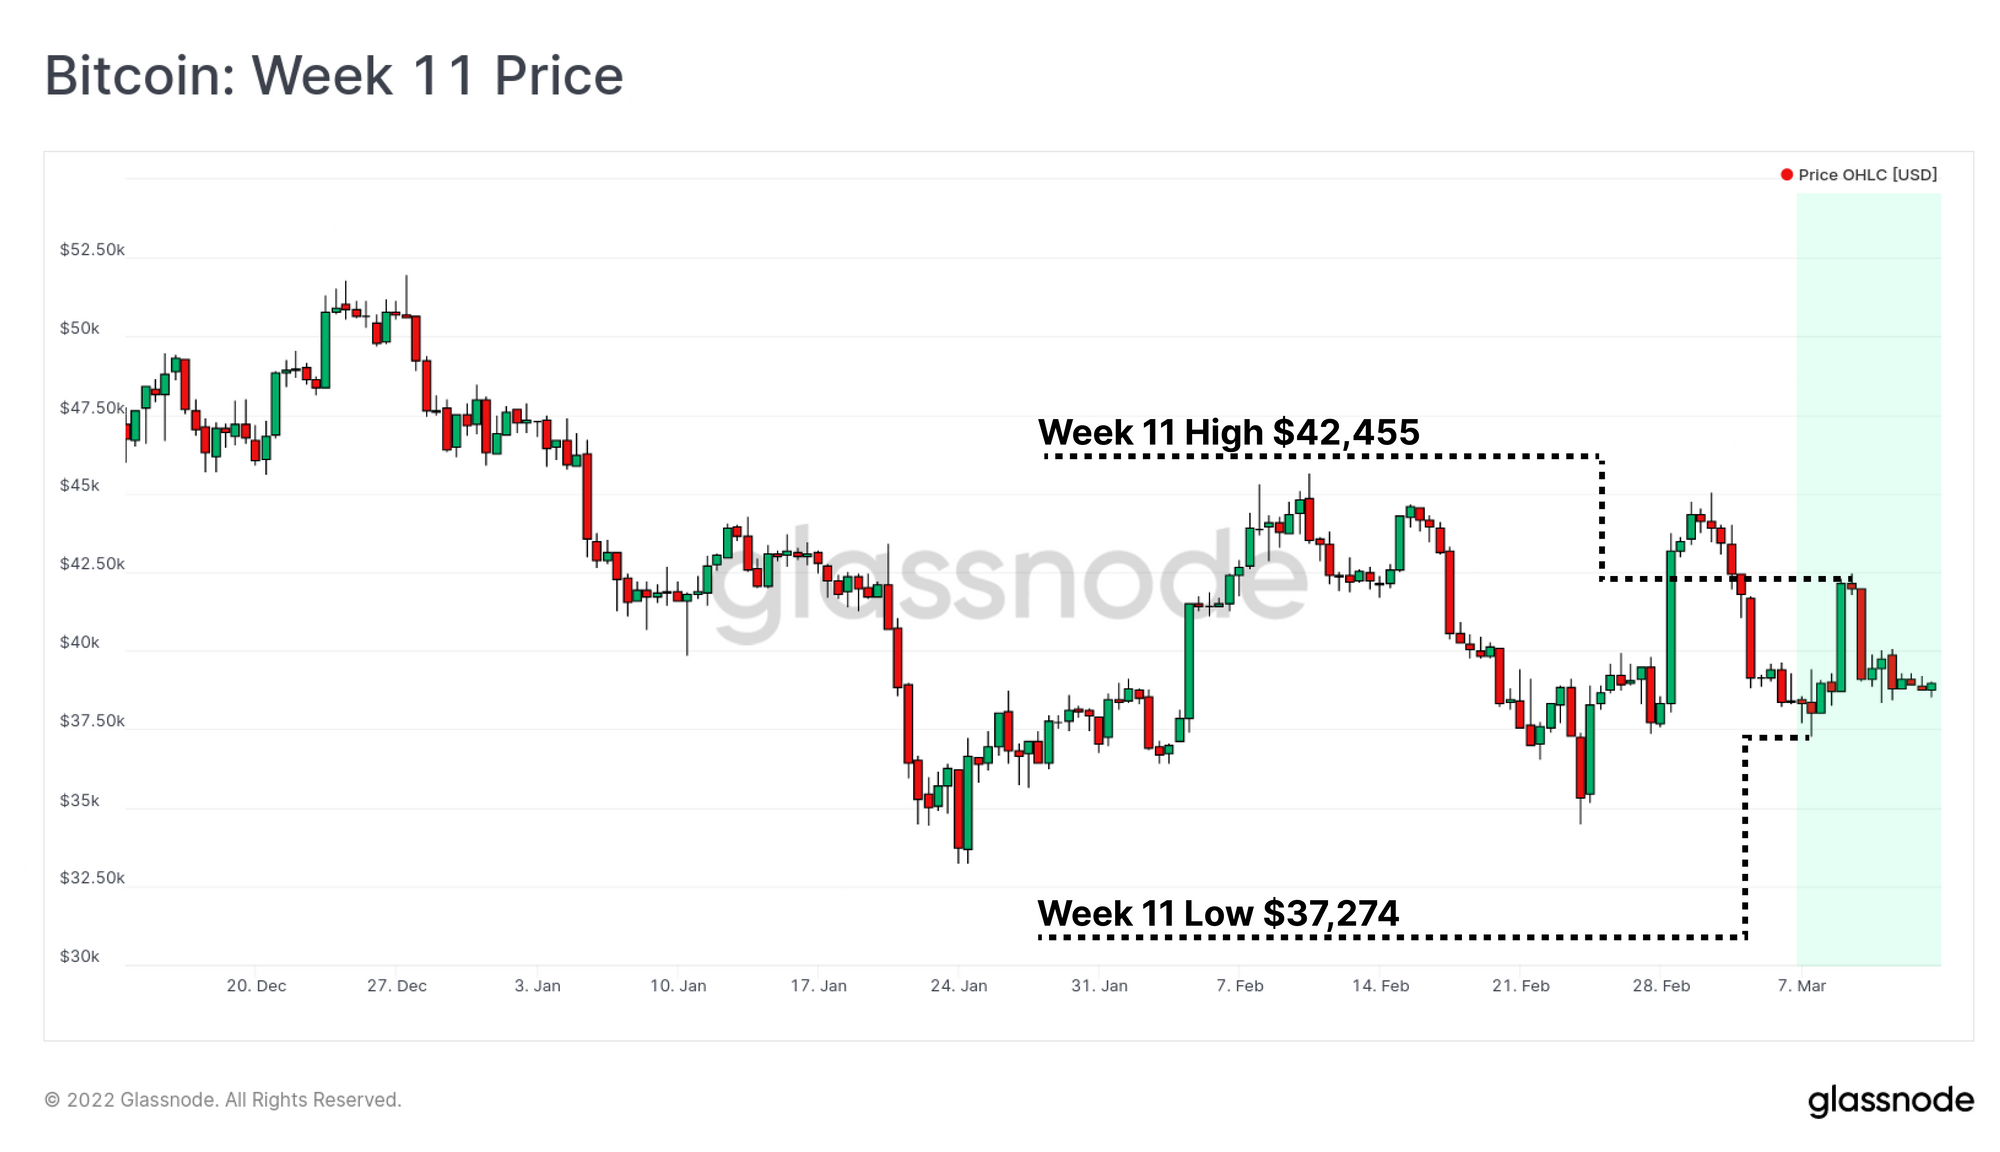
Bitcoin prices continue to consolidate this week, compressing into an increasingly tight range between a low of $37,274, and a high of $42,455. As was covered in the previous edition, the market currently exists in a delicate balance, amidst a backdrop of high macro and geopolitical uncertainty playing out on the global stage.

We are now two years on from the major capitulation event in March 2020 that saw Bitcoin prices plummet over 52%, fall from $8k to $3.8k in two trading days, and marked the end of the 2019-20 bear cycle. Capitulation events like this often signify a complete and total flush out of all remaining sellers, turning the tides in the favour of the bulls.

In this edition, we will assess the current balance between buyers and sellers in an attempt to gauge how close we may be to the end of the current bear cycle.

Executive Summary

  • Uncertainty and macro risks are a current headwind, which are manifesting as softened short-term accumulation trends.
  • Spending by older coins over the last week is also marginally more bearish than recent weeks, although is still not at levels that signify widespread fear or loss of conviction.
  • 82% of the supply held by Short-Term Holders (2.51M BTC) is currently held at an unrealised loss, whilst total supply held by Long-Term Holders is near all-time-highs.
  • Despite weaker short-term demand, HODLing remains the preferred strategy, with the proportion of younger coins now at all-time-lows. This is historically associated with late stage bear markets.
  • We introduce a new concept called market inflation rate which shows that on an annualised basis, Long-Term Holders are adding to their balance at a volume 7.6x larger than mining issuance. This is constructive longer-term.

Translations

This Week On-chain is now being translated into Spanish, Italian, Chinese, Japanese, Turkish, French, and Portuguese.

The Week Onchain Dashboard

The Week Onchain Newsletter has a live dashboard with all featured charts available here. This dashboard and all covered metrics are explored further in our Video Report which is released on Tuesdays each week. Visit and subscribe to our Youtube Channel, and visit our Video Portal for more video content and metric tutorials.


Uncertainty Softens Short-Term Accumulation

To set the stage, we begin with a metric newly released this week, the Bitcoin Accumulation Trend Score. This tool is designed to monitor the big picture aggregate accumulation, or distribution of investor wallets. This tool tracks when large entities (aka whales) and/or large portions of the market (aka shrimps in large numbers) are adding to their coin holdings, whilst also filtering out miners and exchanges.

The metric trades between values of 0 and 1 with the following interpretation:

  • Values closer to 0 (yellow/orange) indicate the market is distributing, or there is little meaningful accumulation taking place (bearish).
  • Values closer o 1 (purple) indicate that the market is in net accumulation with investor wallet balances increasing meaningfully (bullish).

We can see that the period from October 2021 to Jan 2022 was one of very strong accumulation (> 0.9, dark purple), likely by price insensitive HODLers. However, for most of 2022, this metric has fluctuated between a value of 0.2 and 0.5. This highlights the impact of global macro uncertainty on investor sentiment, with weaker accumulation taking place as a result.

Live Chart

We have also released a video guide to the Accumulation Trend Score below.

This week we have also seen a notable increase in older coins being spent. Older coins are held by investors who have more experience with the characteristic volatility of Bitcoin markets, and are often considered synonymous with 'smarter money'.

As such, when we see older coins being spent at higher levels, it can indicate a more bearish tilt in sentiment within the HODLer class. Coins older than 6mths represented 5% of all spending volume this week, which is a notable uptick from recent months.

Live Chart

We can also see this in the Binary Coin-days Destroyed metric with a 7-day moving average applied. This metric will trade higher when older coins are spent in a sustained manner. Low values (green zones) are typical of accumulation phases in a bear market, whilst elevated values (red zones) are typical of bullish trends, as long-term investors sell into market strength.

Since September last year, Binary CDD has traded consistently higher than a typical accumulation phase. This further suggests that there remains some degree of long-term investor de-risking taking place.

Live Chart

The unit we measure to track the aggregate age of coins being spent is called a coin-day. It represents the amount of time a coin has remained dormant in an investor wallet. On a more macro view, the aggregate sum of coin-day destruction over the last 90-days remains historically low.

During bear markets, the CDD-90 metric trades at low levels as investors slowly accumulate coins and there is an aggregate preference for HODLing. It will however spike higher following capitulation events, as fear and panic creates a final wave of sell-side pressure, which exhausts all remaining bears.

This metric does suggest that accumulation and HODLing is the preferred behaviour pattern at present. We have yet to see a final capitulation event in this bear cycle however, which has happened in all previous cycles. It remains to be seen if this time is different.

Live Chart

Short-Term Supply Shrinks

The chart below shows the relative proportion of the coin supply held by Short-Term Holders (STHs) who accumulated within the last 155-days. This cohort are statistically the most likely to sell their coins in the face of market volatility, especially during a final capitulation flush out.

Supporting our observations above, we continue to see the amount of coin supply held by the Short-Term Holder cohort decline. This can only occur when large portions of the coin supply are dormant and crossing the 155-day age threshold, becoming Long-Term Holder supply. STH supply reaching low levels is historically associated with the later stages of bear markets, as patient buyers send coins to cold storage for the long hold.

STH supply is currently near all-time-lows which is constructive for prices. However, 82% of these coins (2.51M BTC) are currently held at a loss, and are in turn the most likely source of sell-side pressure.

Live Chart

The HODL waves are also showing that coins younger than 6-months old are at all-time-lows. 24.53% of the circulating supply is in this young age cohort, which means that 75.47% of the supply has remained dormant for more than 6-months.

This is again a relatively constructive observation for prices and indicates that HODLing is dominating investor behaviour, even with the prevailing macro risks as headwinds.

Live Chart

Whilst a the proportion of young coin supply is declining, it holds an increasingly large proportion of the realised value compared to previous cycles. In other words, an increasingly large amount of the USD denominated capital invested in Bitcoin is currently held in coins accumulated in the last 6-months.

Late stage bear markets are similarly characterised by lower proportions of capital held by these younger coins, as coins mature in longer-term investor wallets. The 3m-6m age band in particular (top yellow band in chart below) is currently swelling significantly, indicating that a large volume of the supply purchased between September and December last year remains held tightly.

Live Chart

Signs of Long-Term Demand Persist

Having now established a macro context of sell-side supply, we now look towards signals of longer range demand (3mths+).

Coinbase in particular has seen a very large net outflow this week, totalling 31,130 BTC ($1.18B). This is the largest net outflow since 28-July-2017. The regime of net outflows (red bars) following March 2020 is also quite apparent in the chart below. This remains a strong signal that investors increasingly see Bitcoin as a relevant asset in modern portfolios.

Live Chart

This outflow has dropped the total balance held on Coinbase to 649.5k BTC, bringing it back to levels last seen at the 2017 bull market top. The total Bitcoin balance held by Coinbase has now declined by 375.5k BTC (36.6%) from the ATH reached in April 2020.

Large outflows like this one are actually part of a consistent trend in the Coinbase balance, which has been stair-stepping downwards over the last two years. As the largest exchange by BTC balance, and a preferred venue for US based institutions, this further supports the adoption of Bitcoin as a macro asset by larger institutions.

Live Chart

If we look at the Illiquid Supply Shock Ratio (ISSR), we can see a significant uptick this week, suggesting that these withdrawn coins have been moved into a wallet with little-to-no history of spending.

This metric will trend higher as more coins move into such wallets, and we can see that it currently has a similar market structure to the 2018-20 bear market, albeit on a shorter time scale. The ISSR metric is currently at 3.2, which means that the amount of supply held in Illiquid wallets is 3.2x larger than Liquid and Highly Liquid supply combined.

This metric does indicates that a persistent demand is present, despite struggling prices.

Live Chart

To close, we introduce a concept that has been recently developed in collaboration with David Puell (Ark Invest) that we call the 'market inflation rate'. This metric is a measure of annualised accumulation or distribution rates by LTHs.

First we consider Bitcoin issuance to miners relative to circulating supply as the nominal inflation rate (yellow trace), which is assumed to be a persistent sell-side pressure.

Next we annualised the daily change in Long-Term Holder supply relative to circulating supply as a measure of market demand. We multiply the value by negative 1 such that LTH accumulation will return a negative rate (bullish), whilst LTH divestment will return a positive rate (bearish).

Finally, we add this LTH accumulation rate to the nominal inflation rate to calculate the market inflation rate (green trace). What we can see is:

  • During late stage bear markets, market inflation rates are deeply negative (available supply is deflationary), hitting -14% to -15%. This means LTHs are accumulating ~15% of the circulating supply per year over and above miner issuance.
  • At bull market tops, market inflation peaks above nominal inflation, indicating that LTHs are adding significantly to sell-side pressure via divestment (available supply is very inflationary). This ultimately leads to an oversupply and initiates a bear market.

At present, the LTH market inflation rate is at -10.9%, which means LTHs are currently adding to their balance at 7.6x the rate of issuance. This is approaching historical lows that have signalled bear market lows in past cycles, and is another constructive long-term undertone.

Live Workbench Chart

Summary and Conclusions

Uncertainty associated with the many macro and geopolitical risks risks have weakened shorter-term on-chain accumulation trends since January. We can also see marginally elevated spending by older coins this week, although it is still not suggestive of any widespread loss of investor conviction on a macro scale.

With over 2.51M BTC held by Short-term Holders at an unrealised loss, there remains a risk that sellers have not yet been fully exhausted. The 'potential energy' for a capitulation event is there, and such an event would be consistent with all prior bear cycles.

However, HODLing does continue to dominate investor behaviour, and the longer-term accumulation trends are still impressively constructive.


Product Updates

All product updates, improvements and manual updates to metrics and data are recorded in our changelog for your reference.


Disclaimer: This report does not provide any investment advice. All data is provided for information purposes only. No investment decision shall be based on the information provided here and you are solely responsible for your own investment decisions.