The Binance Stablecoin Shuffle
With Binance firmly in the cross-hairs of US regulators this week, we investigate how the market has responded by deep diving into net coin flows through the exchange. We also assess the supply dynamics of Bitcoin, to gauge the shaking of holder confidence.


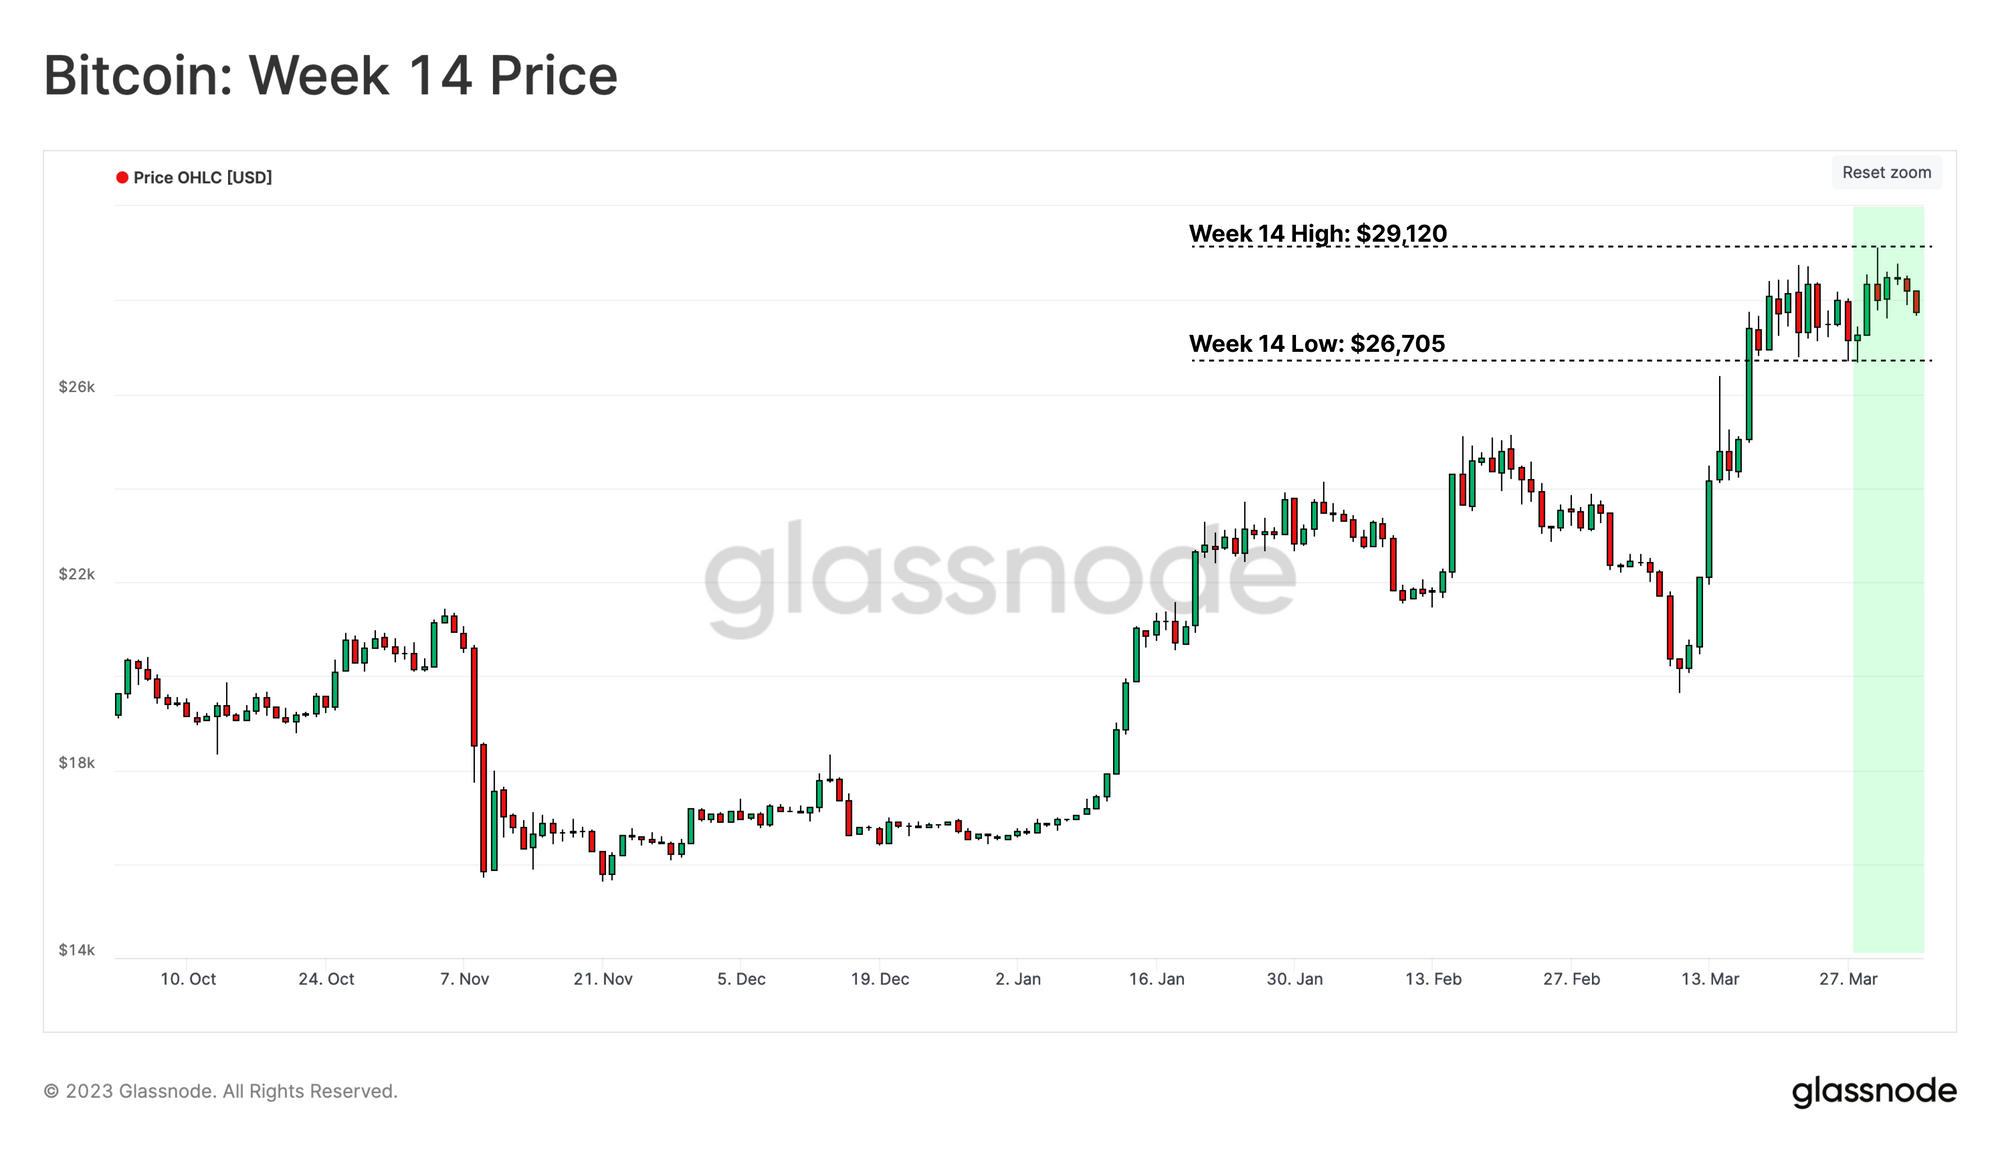
The digital asset market continues to consolidate within a narrow price range this week, briefly reaching a new multi-month high of $29.1k. This comes amidst a continued backdrop of regulatory pressure, with the biggest new this week relating to a complaint made against Binance and CEO CZ by the CFTC.
In this weeks edition, we will assess the immediate response of digital asset holders with respect to Binance, and whether any structural shifts are found in their token reserves. We will also analyse the wider Bitcoin investor response through the lens of supply dynamics, and the movement of coins between holders.
🪟 View all charts covered in this report in The Week On-chain Dashboard.
🔔 Alert Ideas presented in this edition can be set within Glassnode Studio.
The Stablecoin Shuffle at Binance
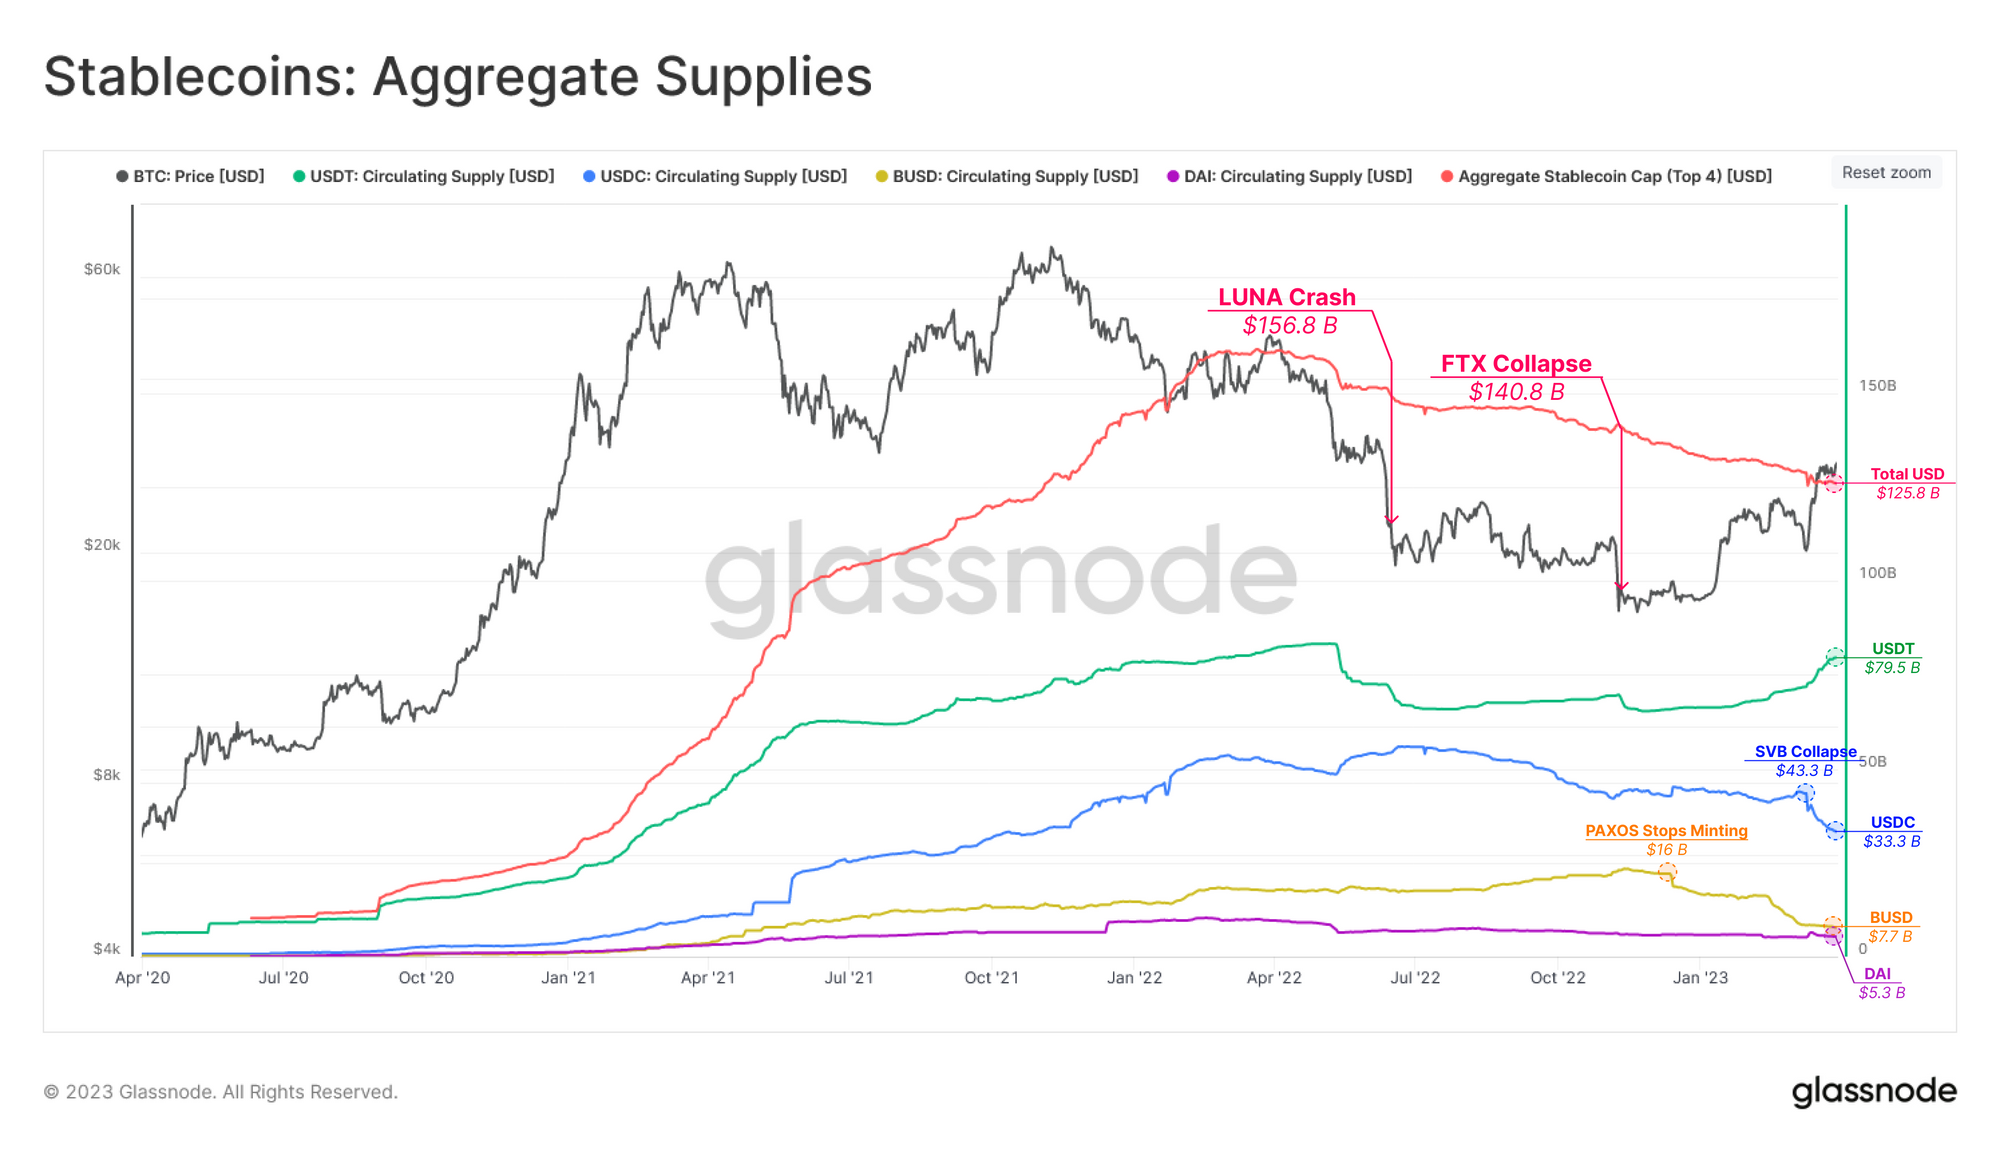
Stablecoins have become an integral component of the digital asset space in recent years, acting as a primary rail through which fiat enters, and exits the market. Looking back at the aggregate market cap trend of the major stablecoins (USDT, USDC, BUSD, and DAI), we can see that it has been in decline for 12 months, reaching $125.8B this week, and a total decline of -22% since the all-time high of $161.56B.
Since the collapse of FTX, USDT supply has expanded back to $79.5B, now dominating 63.7% of stablecoin capital. Meanwhile, the second-ranked stablecoin USDC has seen $10B (-23%) in net redemption since breaking the peg during the failure of SVB last month. Similarly, following news of Paxos halting the issuance of BUSD in Feb, many investors have redeemed, or converted BUSD into other assets, driving the total BUSD supply down by -52% to $7.7B.
Pressure has been mounting on Binance from US regulators in 2023, with the latest news related to the exchange, and its CEO facing a CFTC lawsuit due to alleged regulatory violations. Given the degree of uncertainty related to bank and exchange solvency of late, we can assess the net flow of funds in and out of Binance to gauge market sentiment.
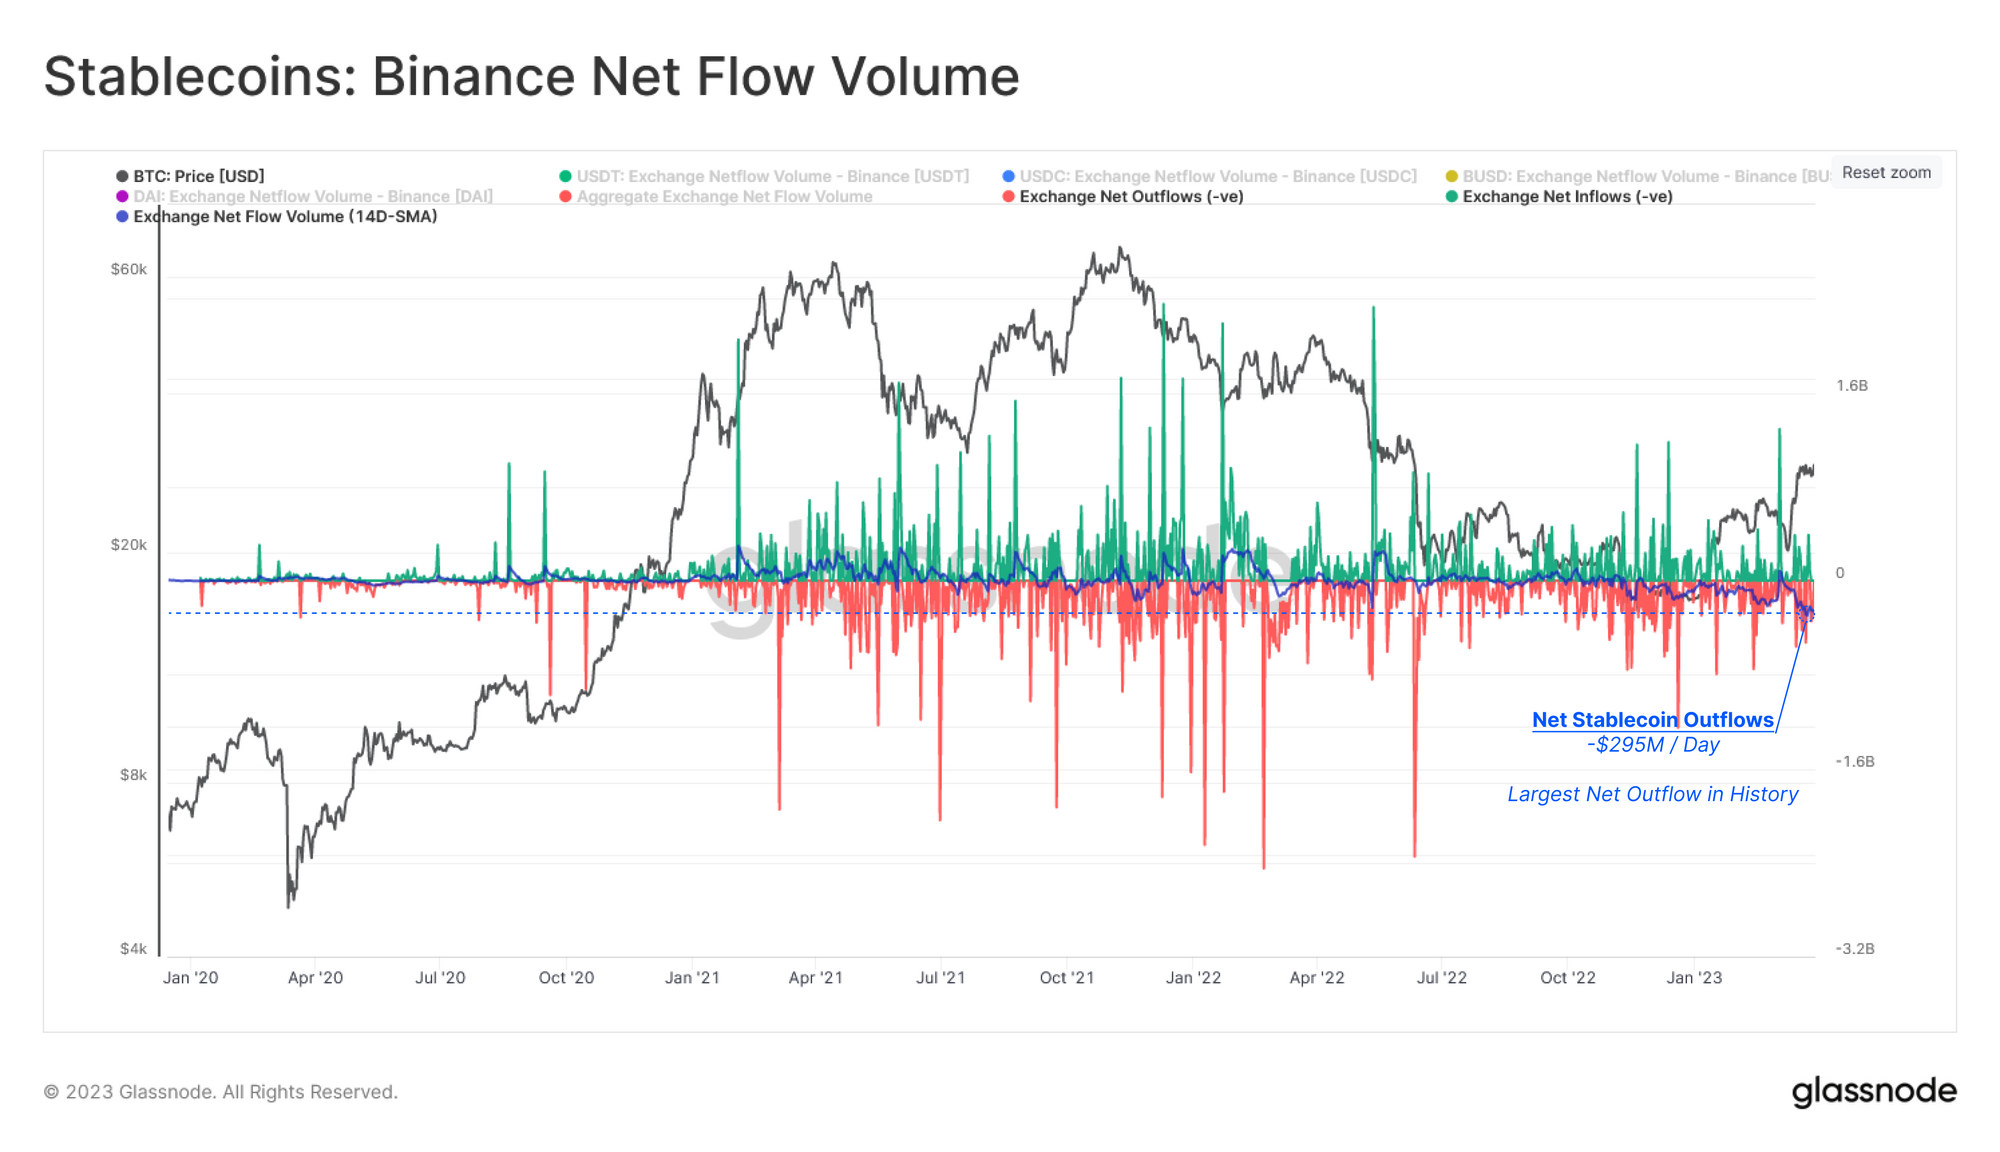
The chart below shows the daily net flow of stablecoins flowing through Binance on the Ethereum blockchain. A positive value 🟢 shows aggregate stablecoin supply on Binance has increased (inflows), while the negative value 🔴 underscores a net outflow.
To isolate the net daily flow, a 14-day SMA 🔵 is shown which demonstrates a net outflow of -$295M/day, which is the largest net outflow in history.
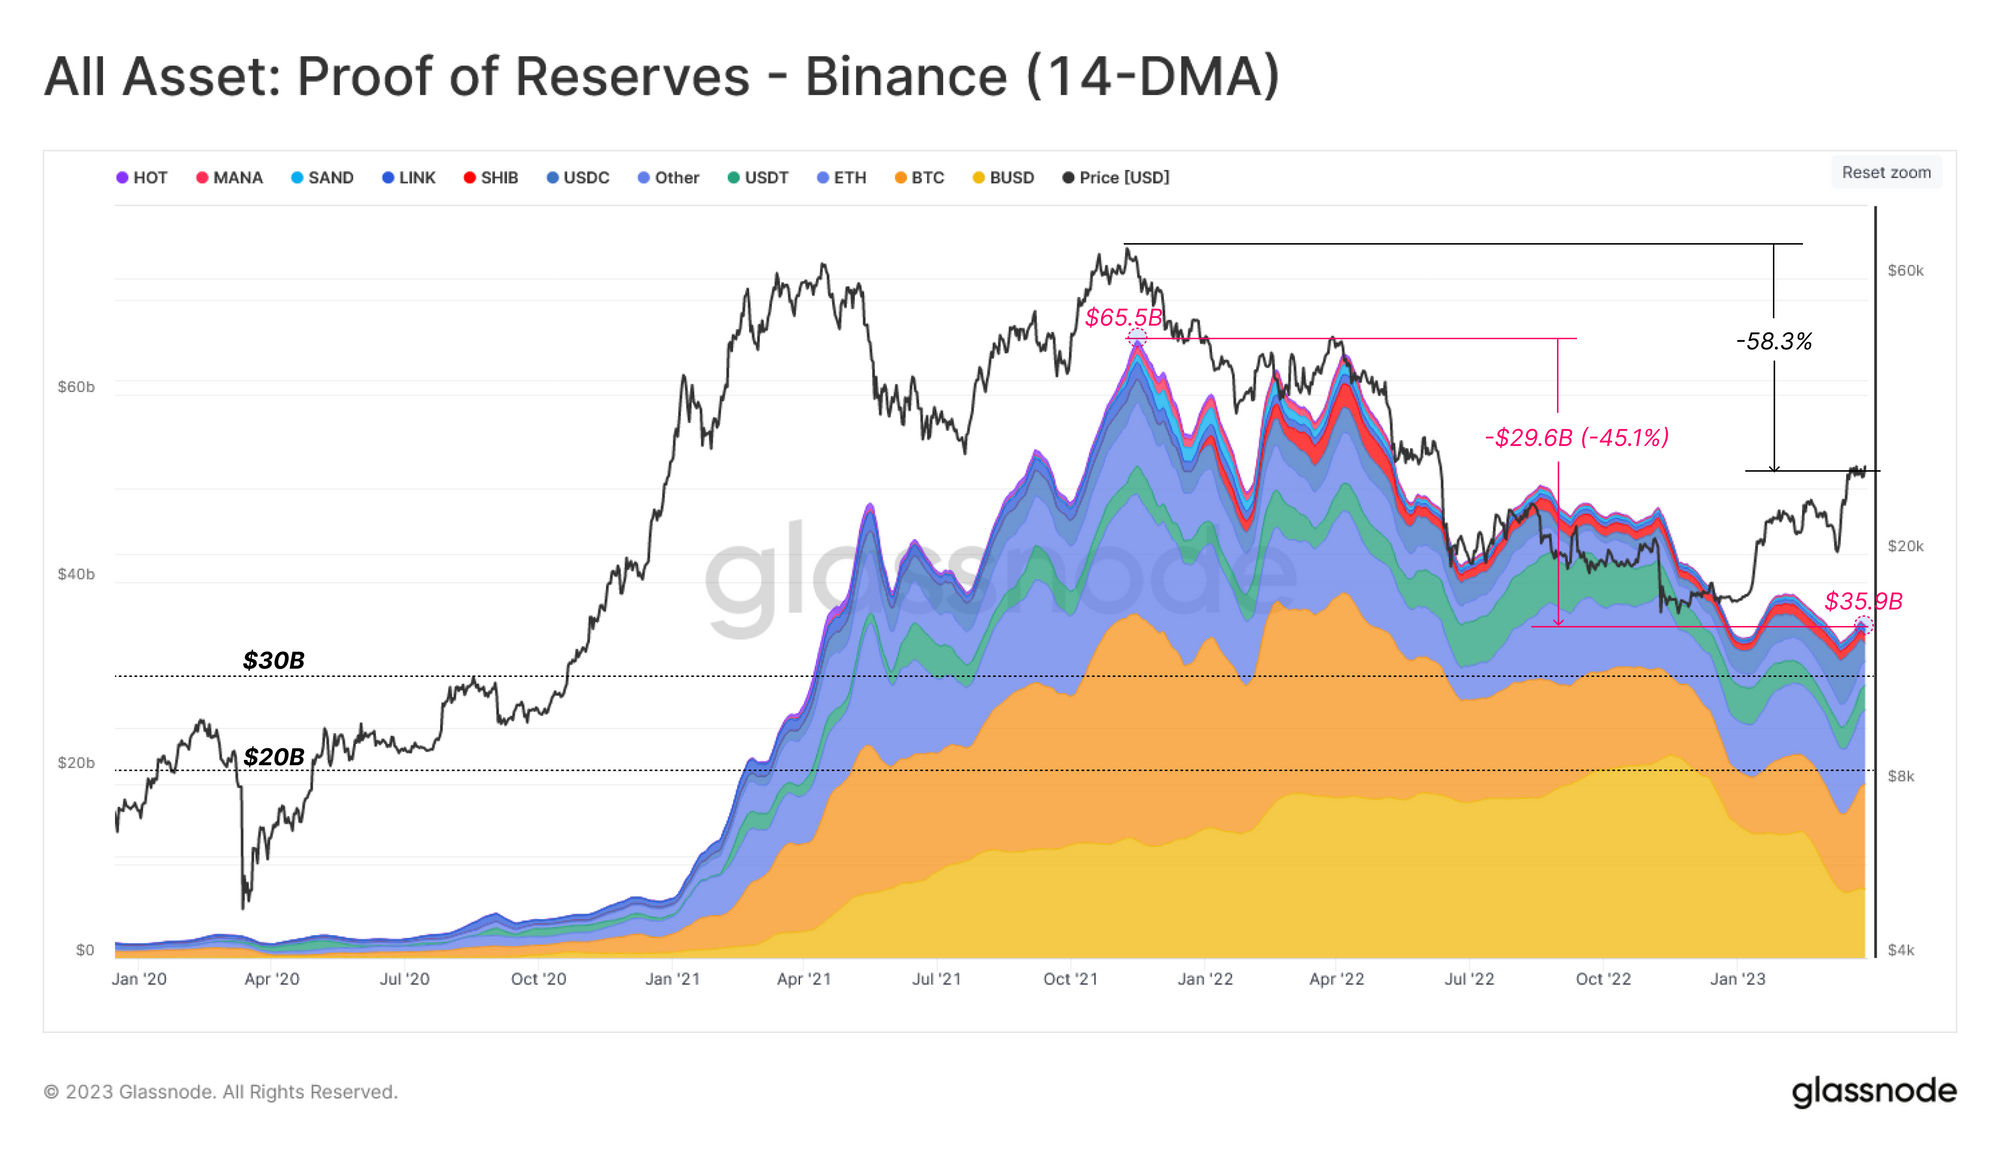
We can also assess the total USD denominated asset profile held within of all of Binance's self-reported Proof-of-Reserves addresses. As illustrated, the overall USD value of Binance reserves have declined by $29.6B (-45.1%) but stabilized at $35.9B since FTX-fall out.
The primary drivers of this decline are falls in token prices (affecting non-stablecoin assets), but more recently the sizeable redemptions of BUSD. The YTD market rally has driven the total USD-denomination of Binance reserve back above $35B this week.
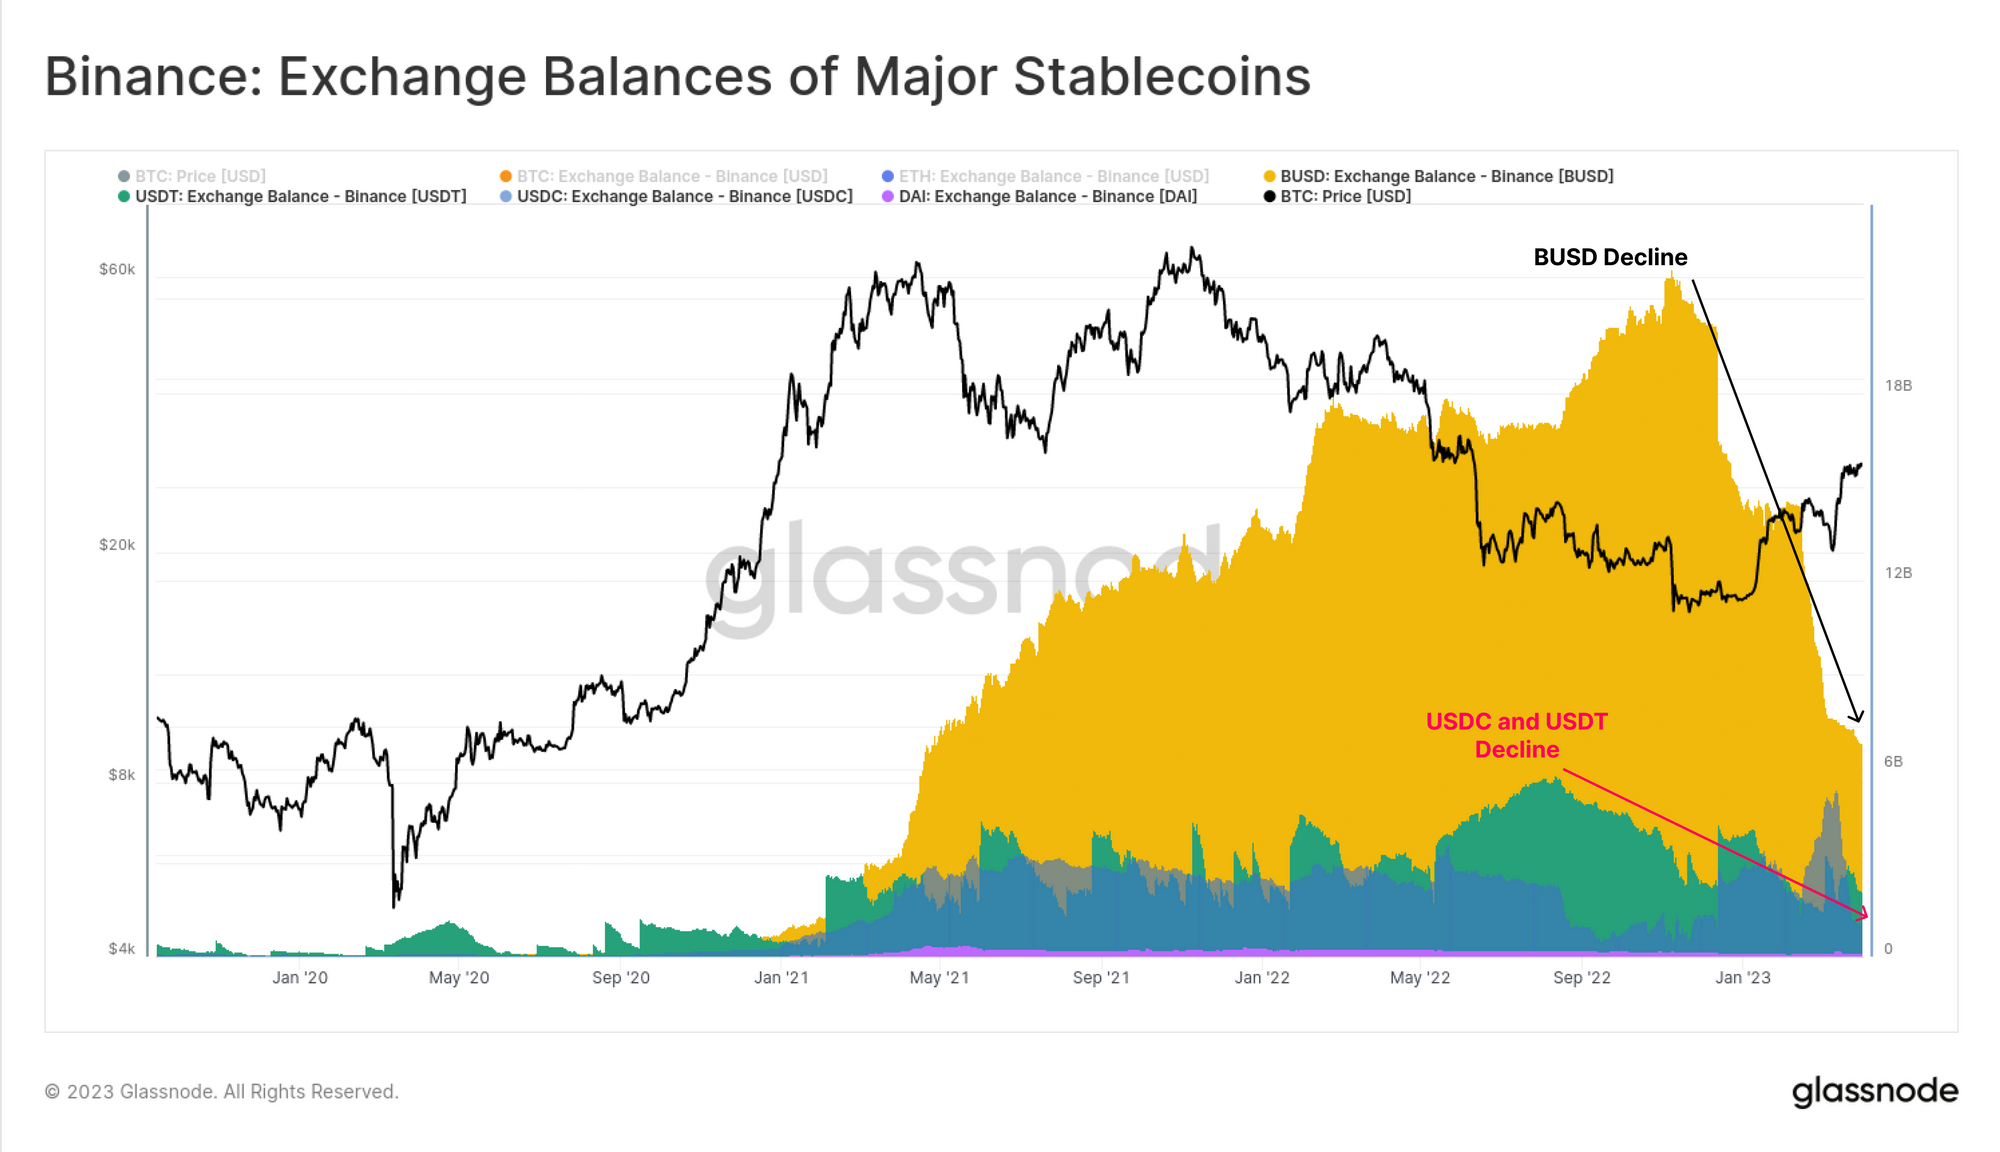
We can see the dramatic scale of both growth, and decline of BUSD held within the Binance platform over the 2020-23 cycle. Of note is the historically low balances of USDC ($1.16B) and USDT ($2.17B), in part a function of Binance's attempt to shift trade volume to BUSD pairs in recent months.
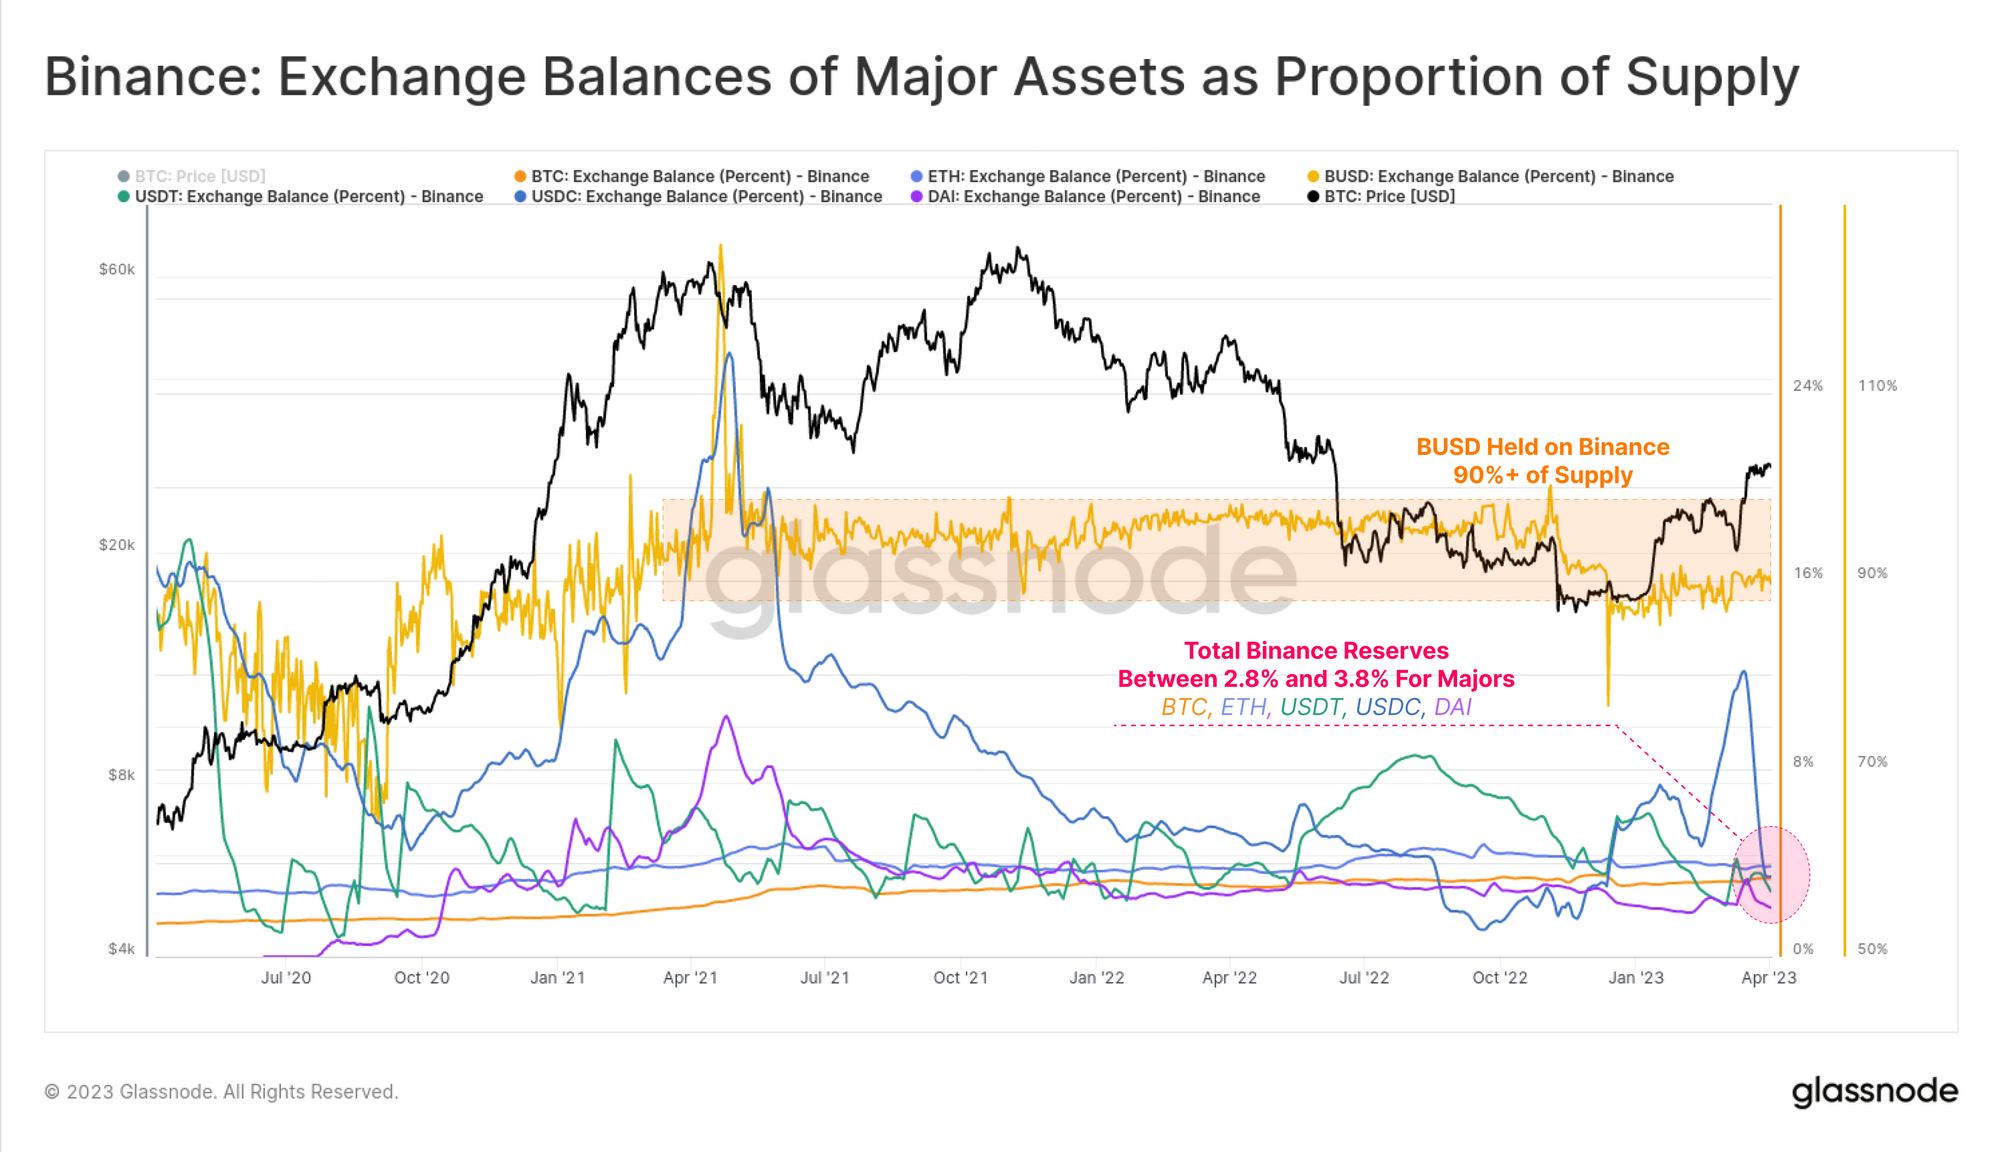
To highlight the scale of Binance held reserves across assets, we can compare it as a proportion to the token circulating supply. Across the major assets BTC, ETH, USDT and USDC, Binance typically custodies between 2.8% to 3.8% of the circulating supply.
However, we can see the scale of BUSD holdings require a separate y-axis, with some 95%+ of circulating supply held at Binance up until FTX collapsed, at which point this metric dropped to 85% to 90%.
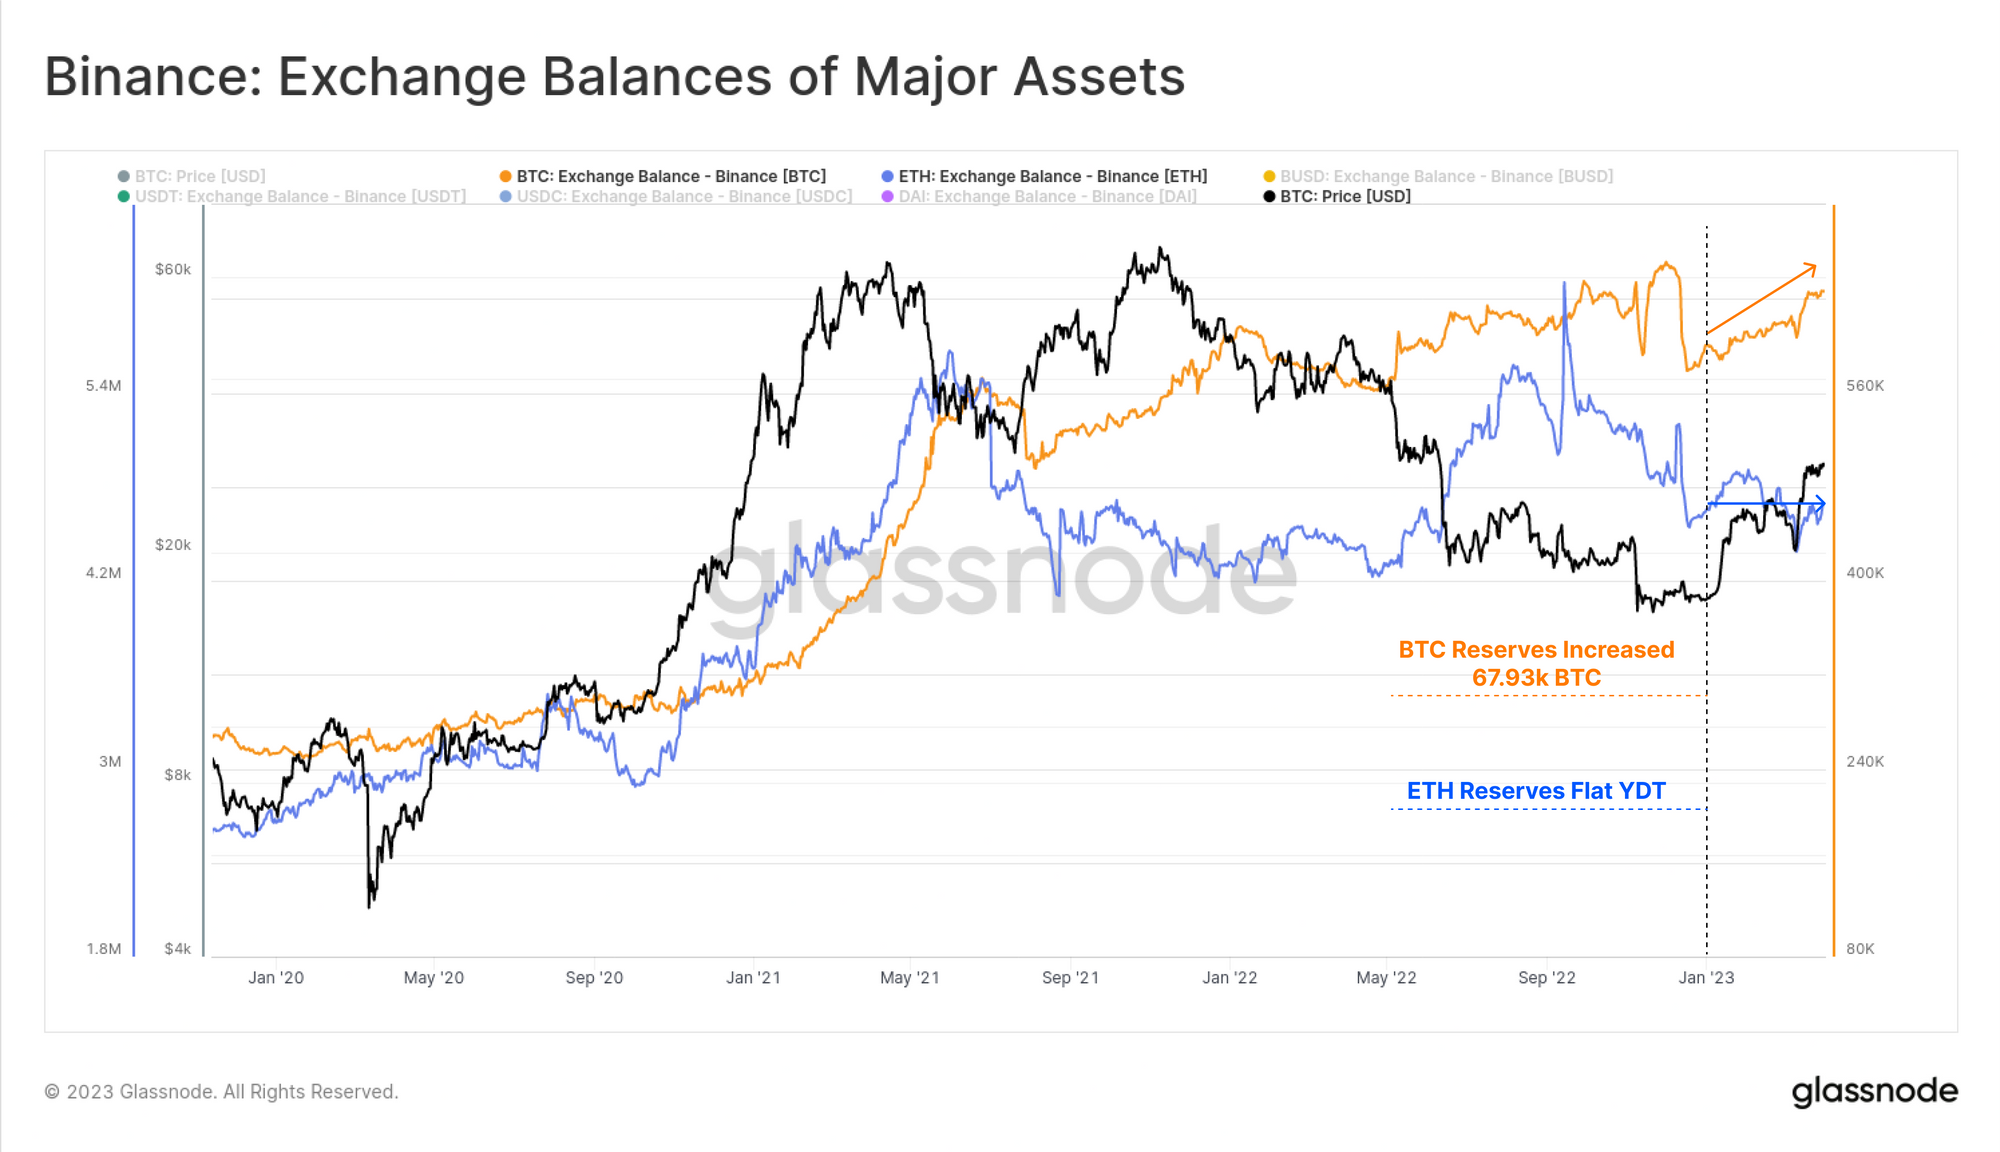
If we look at the coin-denominated balance of BTC and ETH held on Binance, we can see that Bitcoin reserves have increased by 67.93k BTC, and ETH balances are flat YTD. Despite net outflows of stablecoins, the market does not yet appear to be expressing widespread concern about Binance's standing. Despite the developing friction between Binance and regulators, the platform appears to be primarily experiencing a stablecoin shuffle, and remains the largest centralized exchange in the market.
A Promising Rally
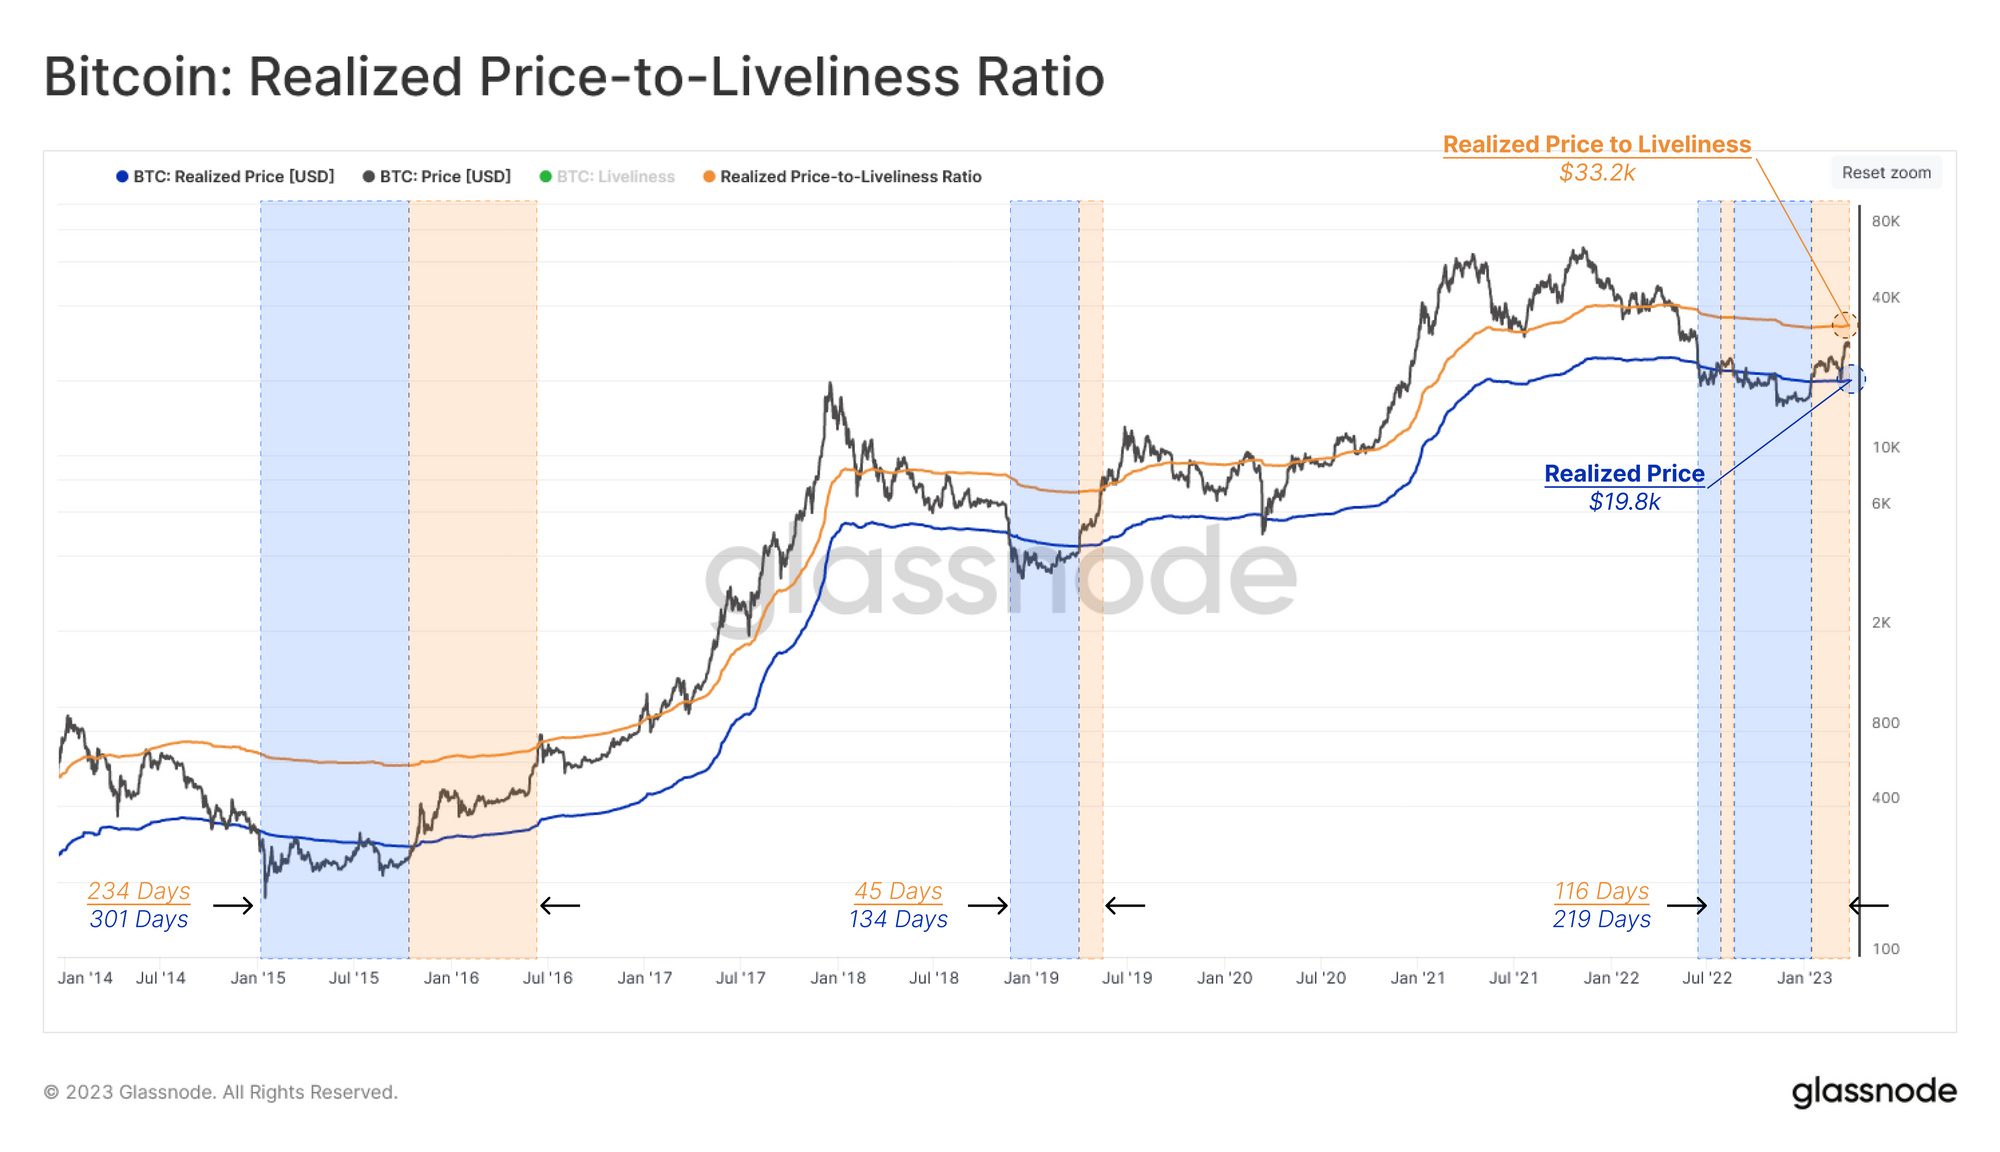
With the spot price of Bitcoin now trading firmly above the Realized Price ($19.78k), the market is trading in what has historically been a macro transitional phase (covered in WoC 12, and WoC 8). This regime is generally bounded by two pricing models:
- The lower bound by the Realized Price 🔵 ($19.8k), corresponding to the average on-chain acquisition price for all coins in the supply.
- The upper bound by the Realized Price-to-Liveliness Ratio 🟠 ($33.2k), a variant of the Realized Price that accounts for the relative degree of coin activity on-chain.
Assessing previous market recoveries from protracted bear markets 🟦 into a transitional phase 🟧 shows many similarities to the current structure. As we covered last week (WoC 13), there is relatively little spending taking place by longer-term holders. This causes the Realized Price-to-Liveliness Ratio 🟠 to climb, suggesting a higher 'HODLer implied value' as a point of potential equilibrium.
The Investor Response Told by Supply
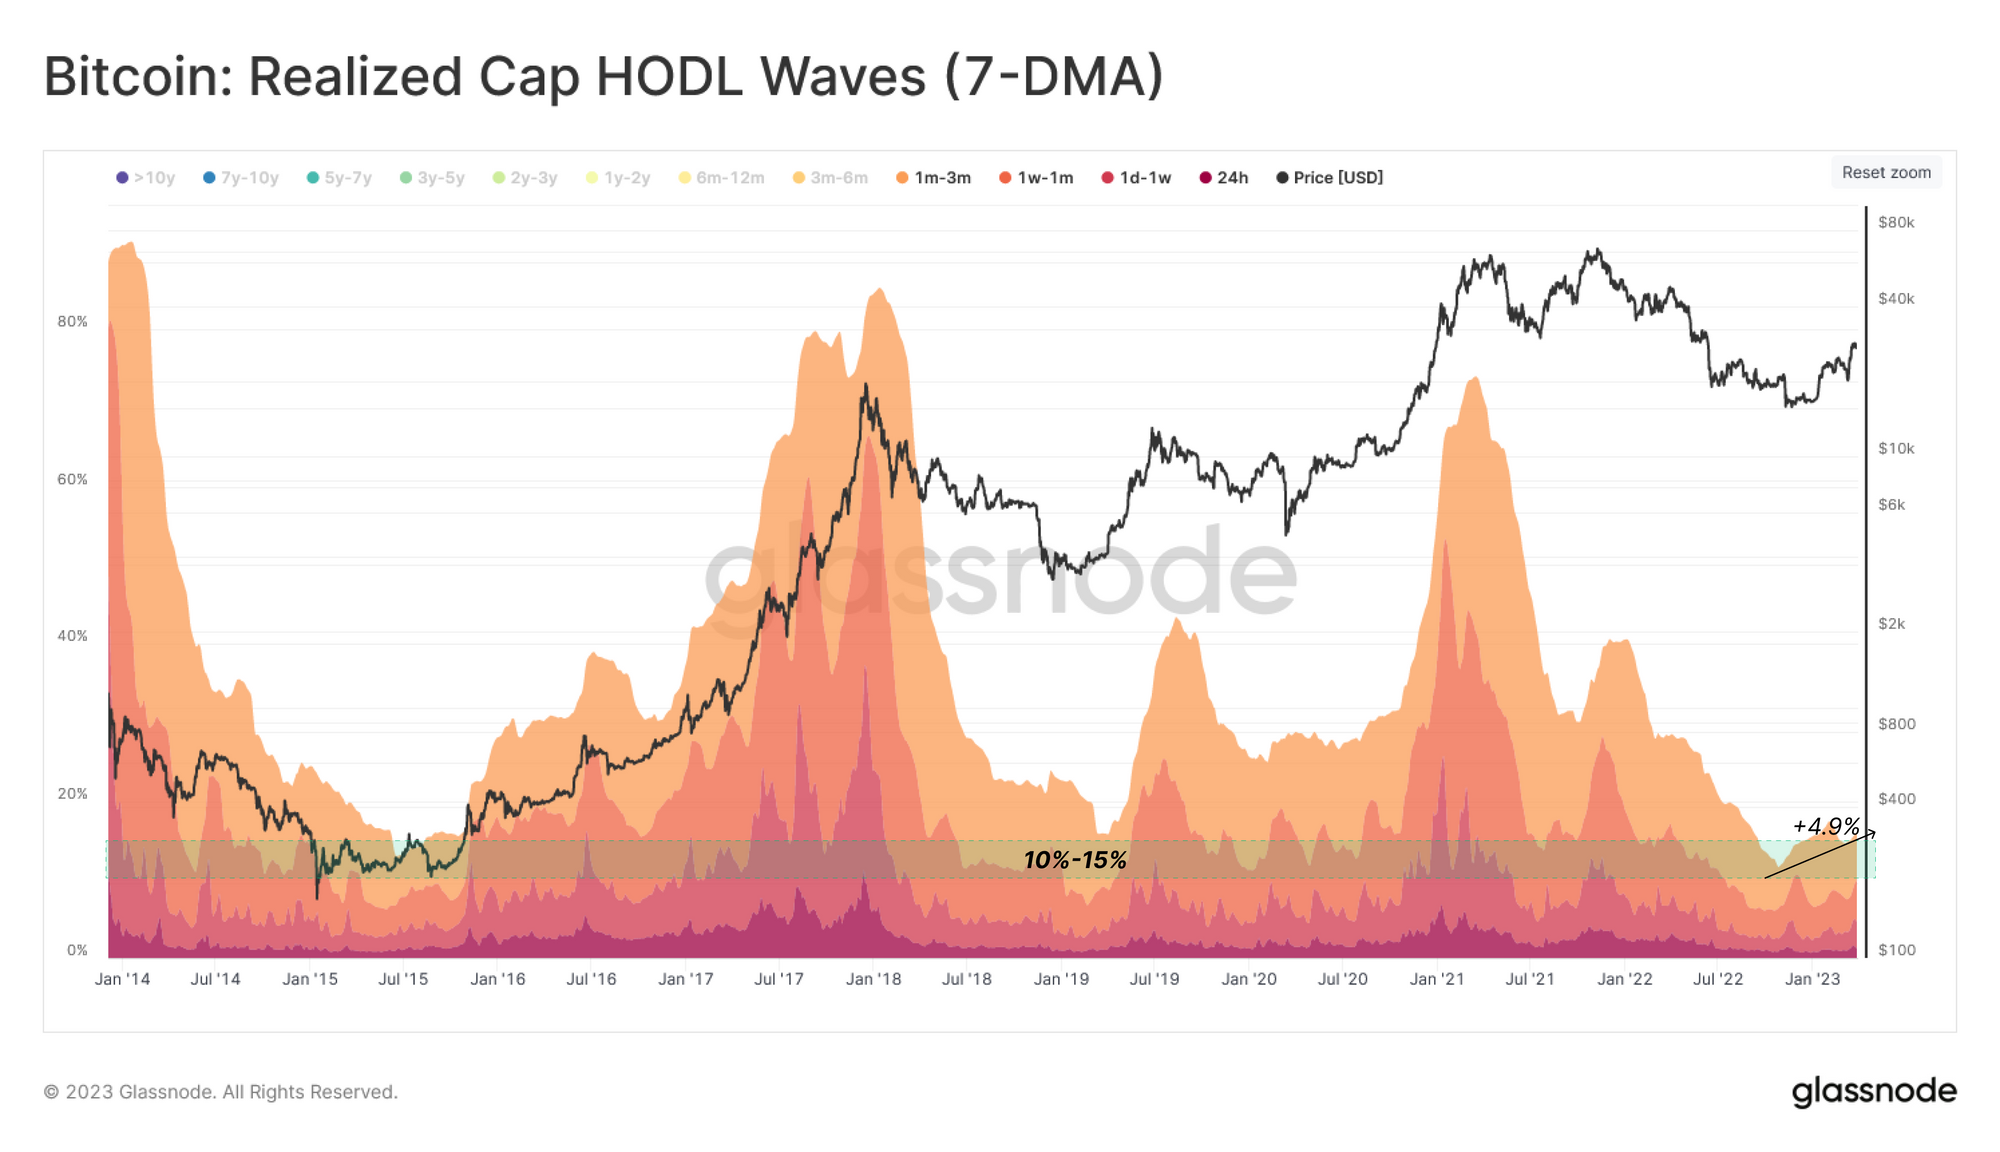
As we close out the first quarter of 2023, BTC prices are up over 68%, putting many investors back into profit. The reaction of Bitcoin holders in response can be observed using the Realized Cap HODL waves, which track the relative distribution of USD wealth stored in various coin age bands. Here, we examine these age bands from a binary point of view:
- Supply aged 3-months or less (Hot Money)
- Supply aged 3-months or more (HODLer Money)
Reviewing prior market cycles, we see a repeating pattern of wealth rotation from the Hot Money towards HODLer Money during bear markets (declining Supply < 3-months), and vice versa during euphoric bull markets (as HODLers liquidate at expensive prices).
The share of Hot Money is currently near cycle lows, accounting for around 10% to 15% of the stored wealth. This is typical of prior bottom formation periods. The strong market recovery has encouraged a slight wave of wealth to transfer from HODLer Money to Hot Money, driving their share up by 4.9% as profits are taken.
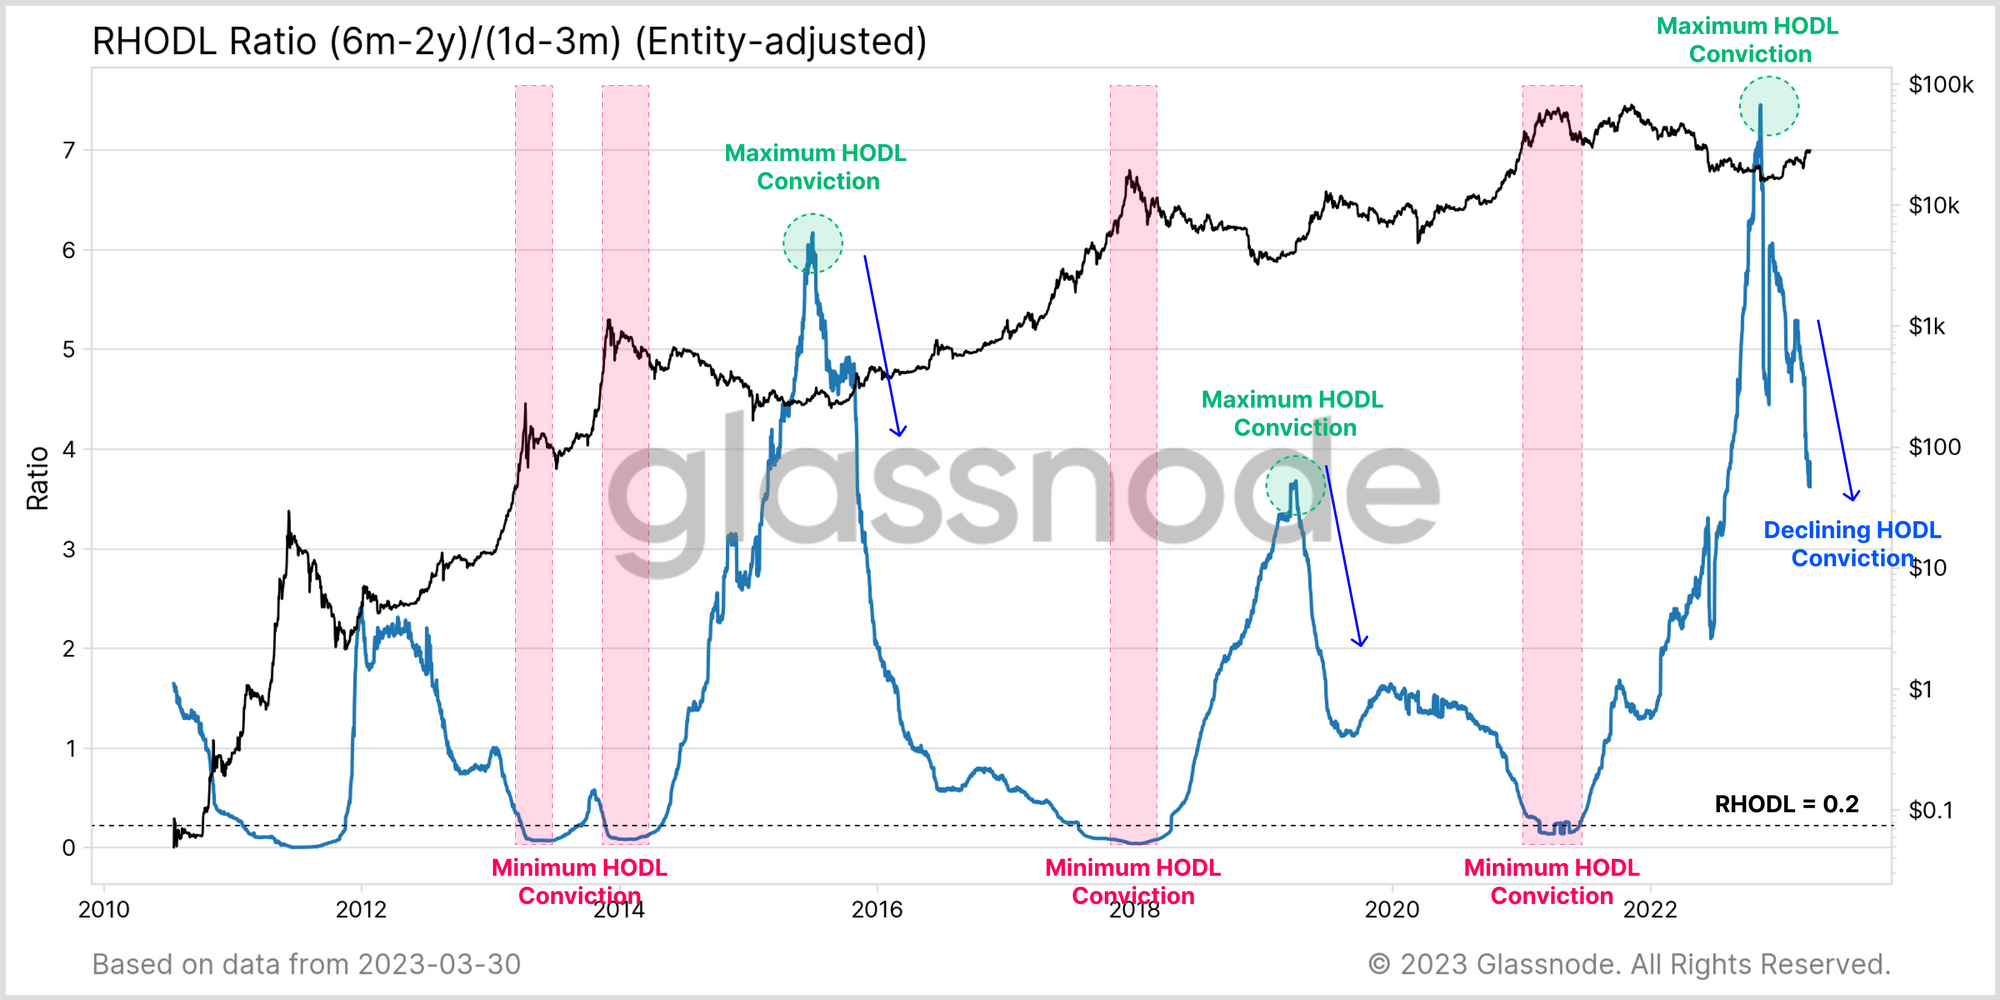
To further explore this binary supply concept, we have developed a variant of the RHODL ratio (first introduced in WoC 6). This indicator compares the wealth held by single-cycle Long-Term Holders (6m-2y) to the youngest Short-Term Holders (1d-3m). This metric aims to gauge the rotation between the extreme HODLing, and distribution points.
The current structure of the RHODL ratio suggests a notably abrupt rotation of capital starting as FTX collapsed, with coins transferring from long-term holders, towards a new cohort of buyers. This sharp decline in the RHODL Ratio can be seen in prior cycles to be an inflection point, suggesting a changing of the tides.
Distance From The Mean
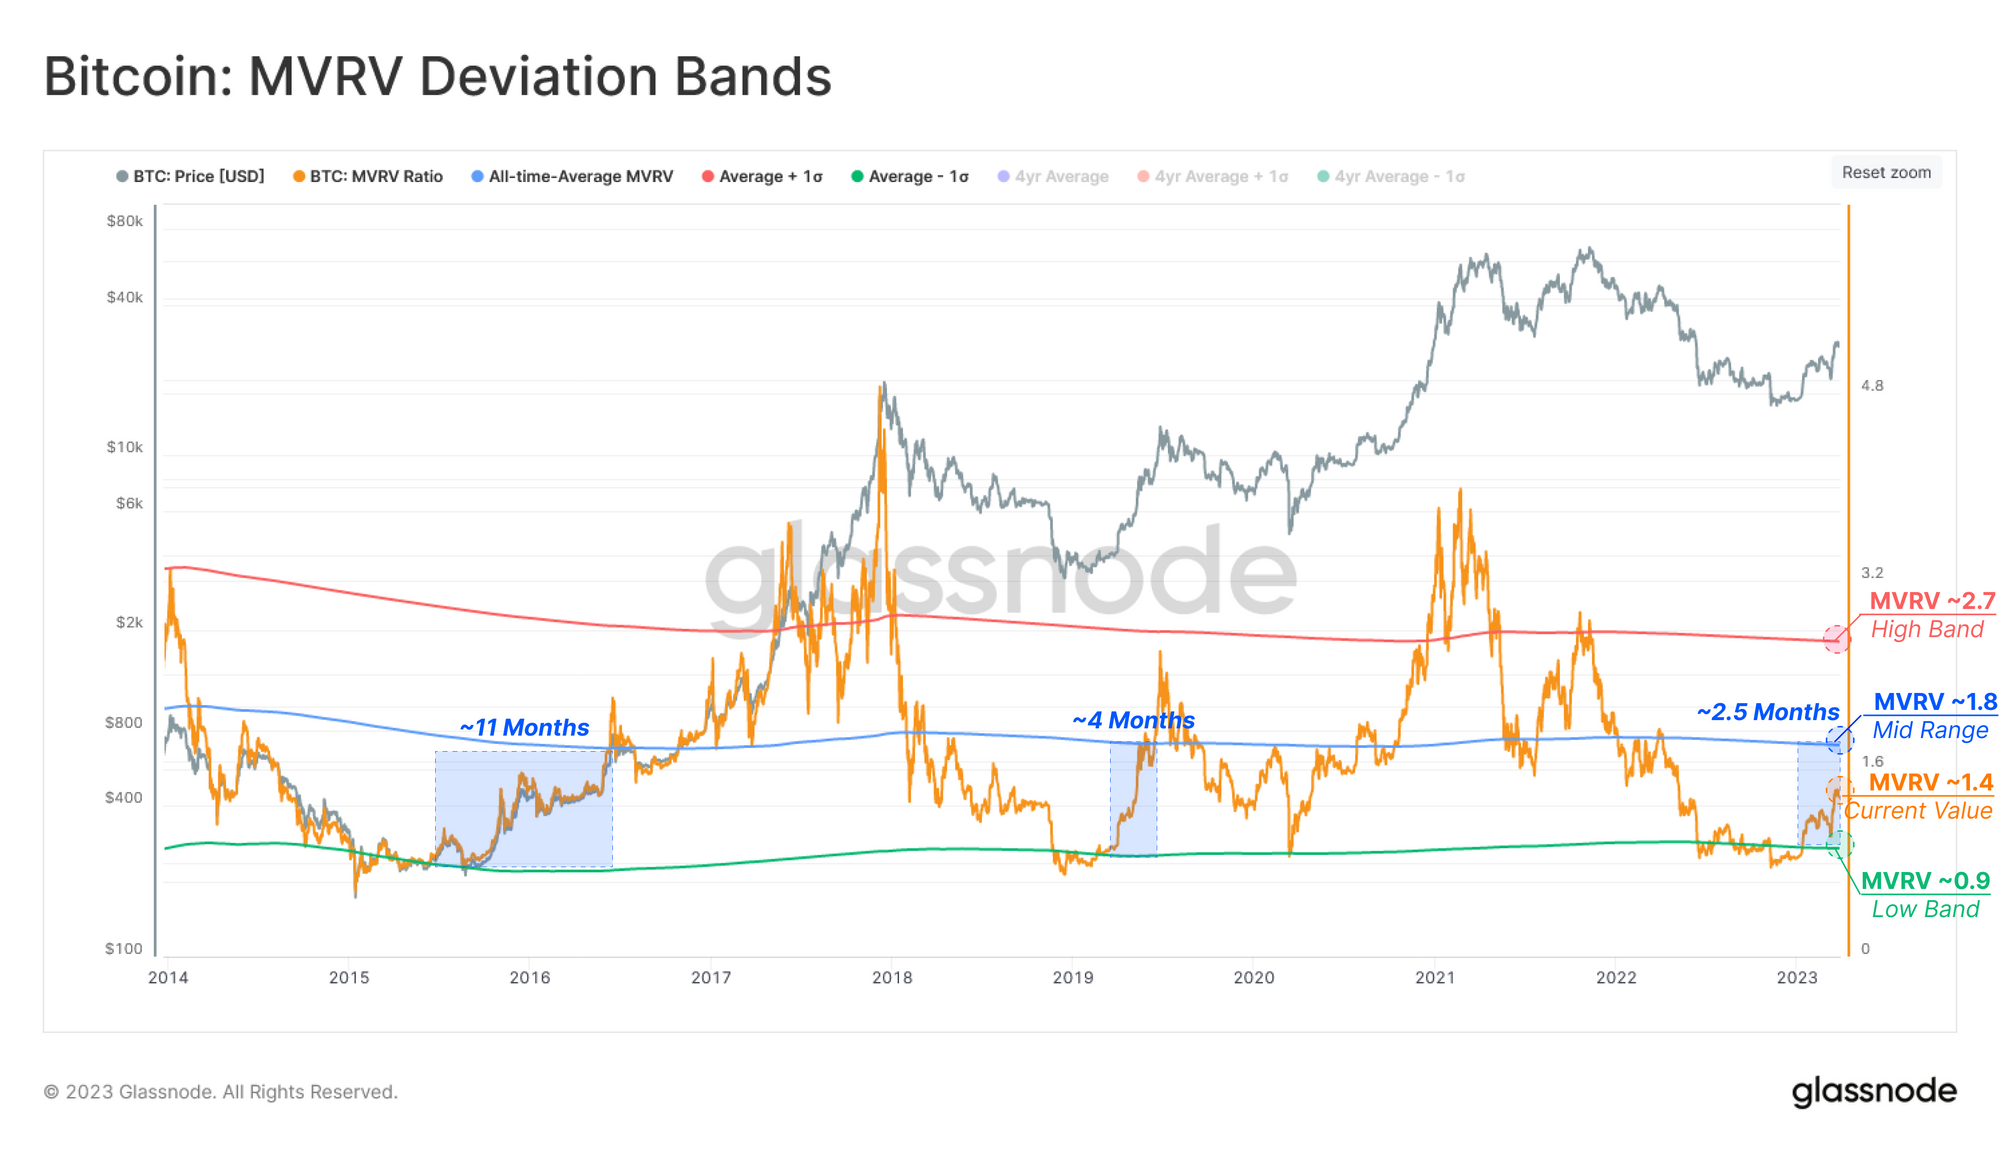
One of the most popular valuation models for Bitcoin is the Market Value to Realized Value (MVRV) Ratio. MVRV is best considered as an aggregate unrealized profit multiple held within coin supply.
To construct a tool for evaluating whether the market is close to a 'fair value', we can use a simple statistical framework based on historical values. This provides a form of a compass which shows MVRV Ratio 🟠 deviations away from its all-time- mean value of 1.8 🔵.
- Depression: MVRV < Low Band 🟢
- Recovery: Low Band 🟢 < MVRV < Mid-Range 🔵
- Excitement: Mid-Range 🔵 < MVRV < High Band 🔴
- Euphoria: High Band 🔴 < MVRV
MVRV is currently trading at 1.4, which aligns more closely with a recovery phase. The all-time-average MVRV of 1.8 implies a price of around $36.1k, which can be seen to be a point of psychological importance, having motivated heavy profit-taking in 2016, 2019-20, and mid-2022.
The Accumulation Trend Score reflects the aggregated balance change of on-chain wallets over the past 30 days, with a higher weight assigned to larger entities (such as whales and institutional-sized wallets). Historically, The early stages of market recoveries tend to trigger a degree of distribution 🔴, returning trend scores below 0.25.
The recent rally toward the 2021-22 cycle baseline (~$30k) has created a similar investor behavior pattern to 2019, returning a trend score above 0.75 for the past two weeks 🟢.
We can further inspect the components of the Accumulation Trend Score to provide a more granular analysis of various wallet balance cohorts. Here we can see that behavior across many wallet cohorts shifted towards balance increase in mid-March, with the only exception being whale entities holding >10k BTC.
In addition to wallet cohorts, the behavior of market participants can be evaluated from the HODLer perspective, measuring supply change based on holding times. The HODLer Net Position Change presents the rolling 30-day change in coins ageing in wallets:
- Positive 🟩 when coins are ageing and maturing at a greater rate than spending.
- Negative 🟥 when coin spending rates exceed accumulation and HODLing behavior.
After a brief period of net spending during the FTX crash, maturation once again dominates, reaching above +60k BTC/month, and indicating holder confidence remains steady.
Finally, we can inspect the status of recently accumulated coins via the Illiquid Supply Net Position Change metric. This tool describes the net flow of coins into/from wallets with little to no history of spending, which are generally speaking the opposite of exchanges' hot wallets.
Remarkably this indicator shows that ~36.6k BTC/Month has been adsorbed by this illiquid side of the supply equation. This aligns with our prior observations related to the HODLers, and provides additional evidence to a case of continued confidence in market sentiment, despite the backdrop of regulatory pressure.
Conclusion
The digital asset market is under some of the heaviest regulatory pressure in many years, and yet the conviction and confidence of Bitcoin holders appears unshaken. Quite a remarkable observation given the backdrop.
Whilst Binance has been in the cross-hairs of the CFTC this week, overall, there is little evidence of investors fleeing from the exchange. The primary observation is a structural shift in stablecoins hosted on Binance as BUSD enters redeem-only mode and USDC sees global dominance declining.
This is worth noting, however, as the aggregate stablecoin supply has experienced 22% reduction since the peak 1yr ago. On net, this represents a net capital outflow from the industry, however may also be a force buoying the majors BTC and ETH as investors return to holding the most trustless collateral.
Disclaimer: This report does not provide any investment advice. All data is provided for information and educational purposes only. No investment decision shall be based on the information provided here and you are solely responsible for your own investment decisions.