Bitcoin Shifts Up A Gear
Bitcoin has out-performed this week, rallying 35.8% against a backdrop of challenging conditions for the traditional financial and banking system. In this edition, we explore how Bitcoin appears to be shifting up a gear, and rallying out of deep bear market territory.


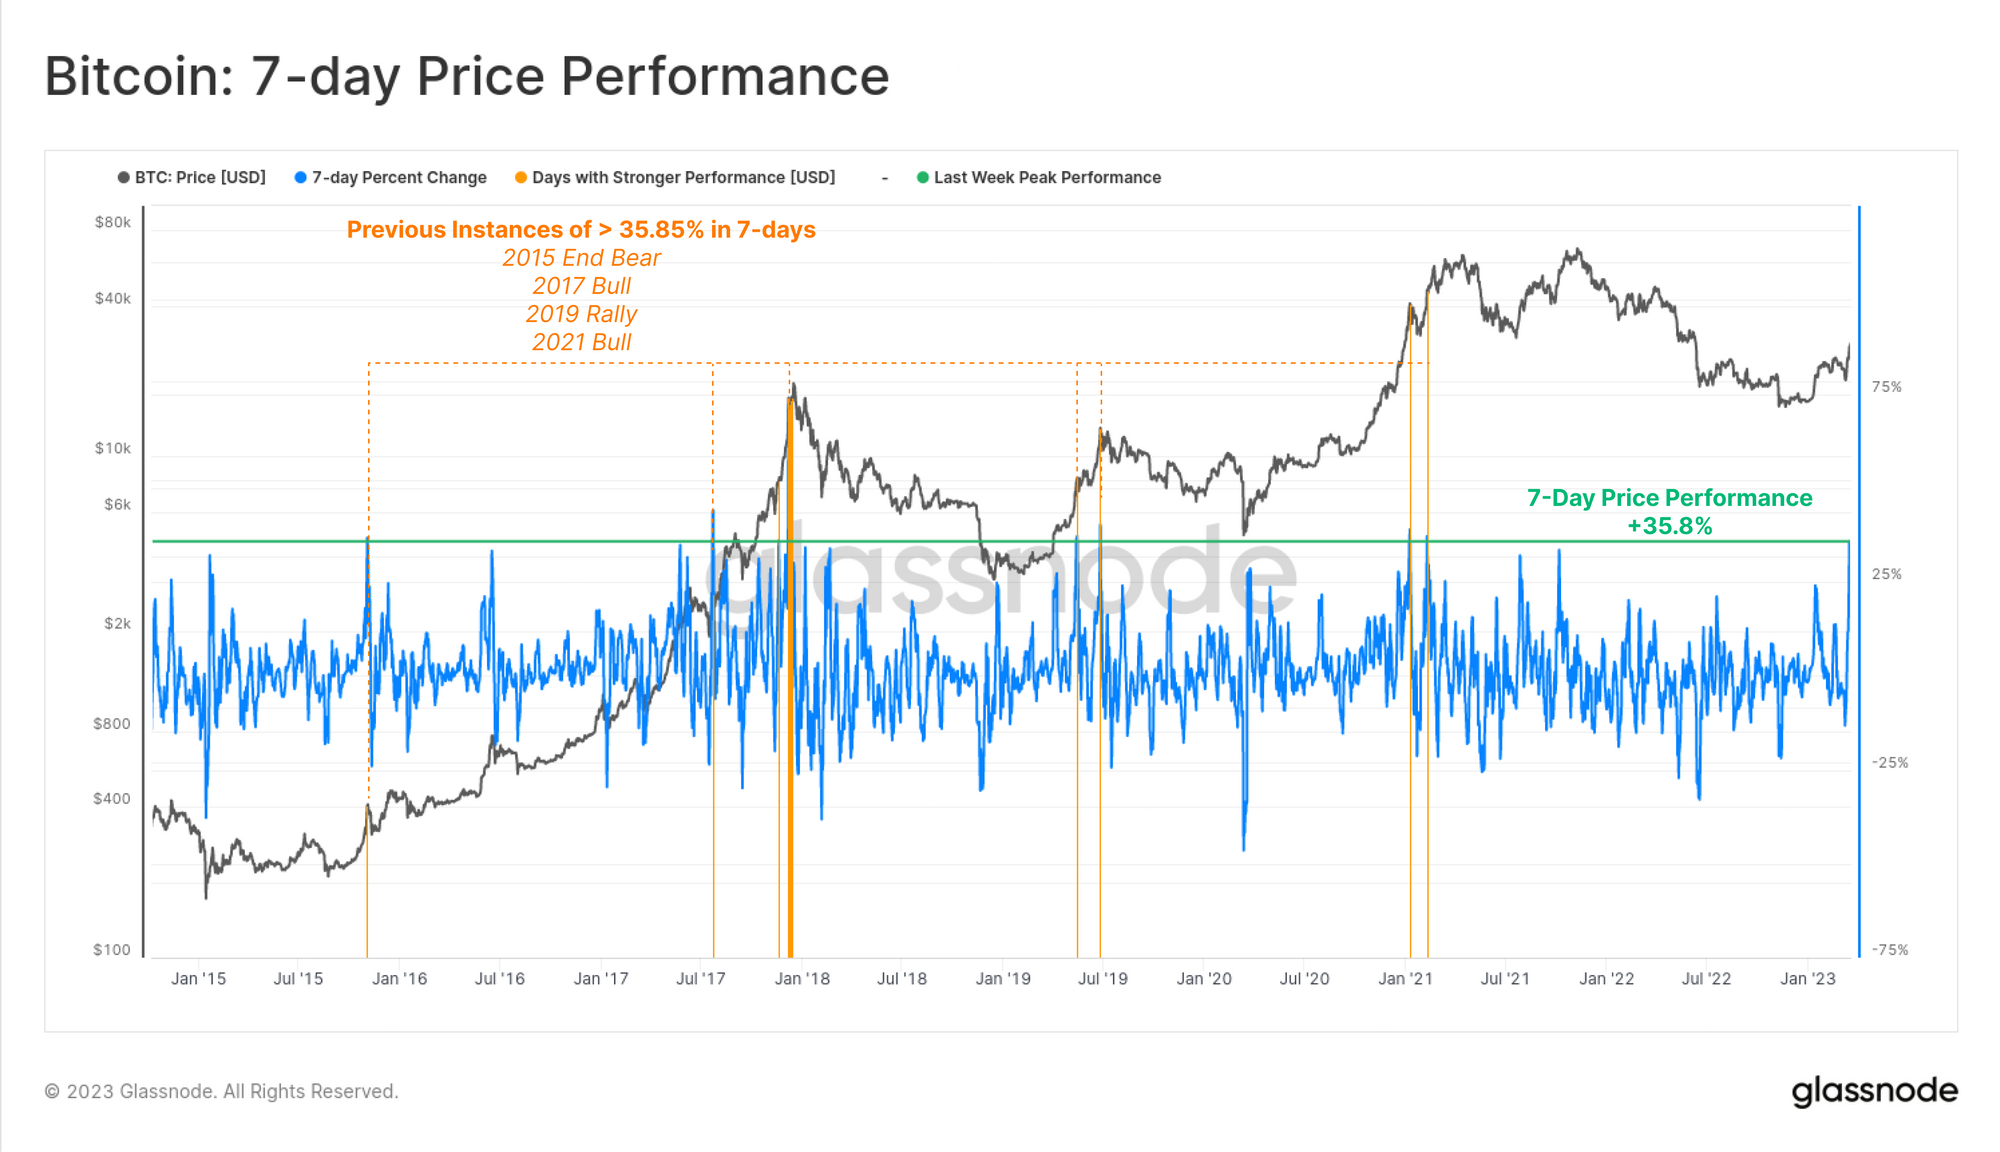
Bitcoin has experienced one of the best performing weeks of price action in history, closing up 35.8% on the week. Only 124-trading days in history have seen a larger 7-day upside rally, with just 16-days occurring from 2015 onwards. Almost all instances have occurred within bull market trends, albeit typically near the later stages of the run.
The strong out-performance from BTC comes alongside challenging conditions for the traditional financial and banking system. Concerns remain elevated regarding the vulnerability of smaller banks in an era of digital bank runs, and new liquidity funding facilities are being established between the US Federal Reserve, US banks, and swap lines with other Central Banks.
With this as our backdrop, we will explore how investors are reacting on-chain, and demonstrate via several methods how the Bitcoin market appears to be shifting gears, out of deep bear market territory, and towards a structure resembling past early bull markets. We will analyse Bitcoin from the following angles:
- On-chain Momentum as several metrics indicate a healthy expansion of network usage is underway.
- Shifting Up a Gear as Bitcoin departs conditions synonymous with cycle lows, and enters the 'middle ground' typical of early bull cycles.
- Following the Cold Money by assessing whether significant profits are being taken by longer-term holders, and whether risk of a near-term oversupply is building.
🪟 View all charts covered in this report in The Week On-chain Dashboard.
🔔 Alert Ideas presented in this edition can be set within Glassnode Studio.
💨 Momentum On-chain
We will start by observing the on-chain activity space, where a simple concept of 'more is better', generally applies. As more people interact and transact within the Bitcoin economy, it is typically associated with periods of increasing adoption, network effects, and investor activity.
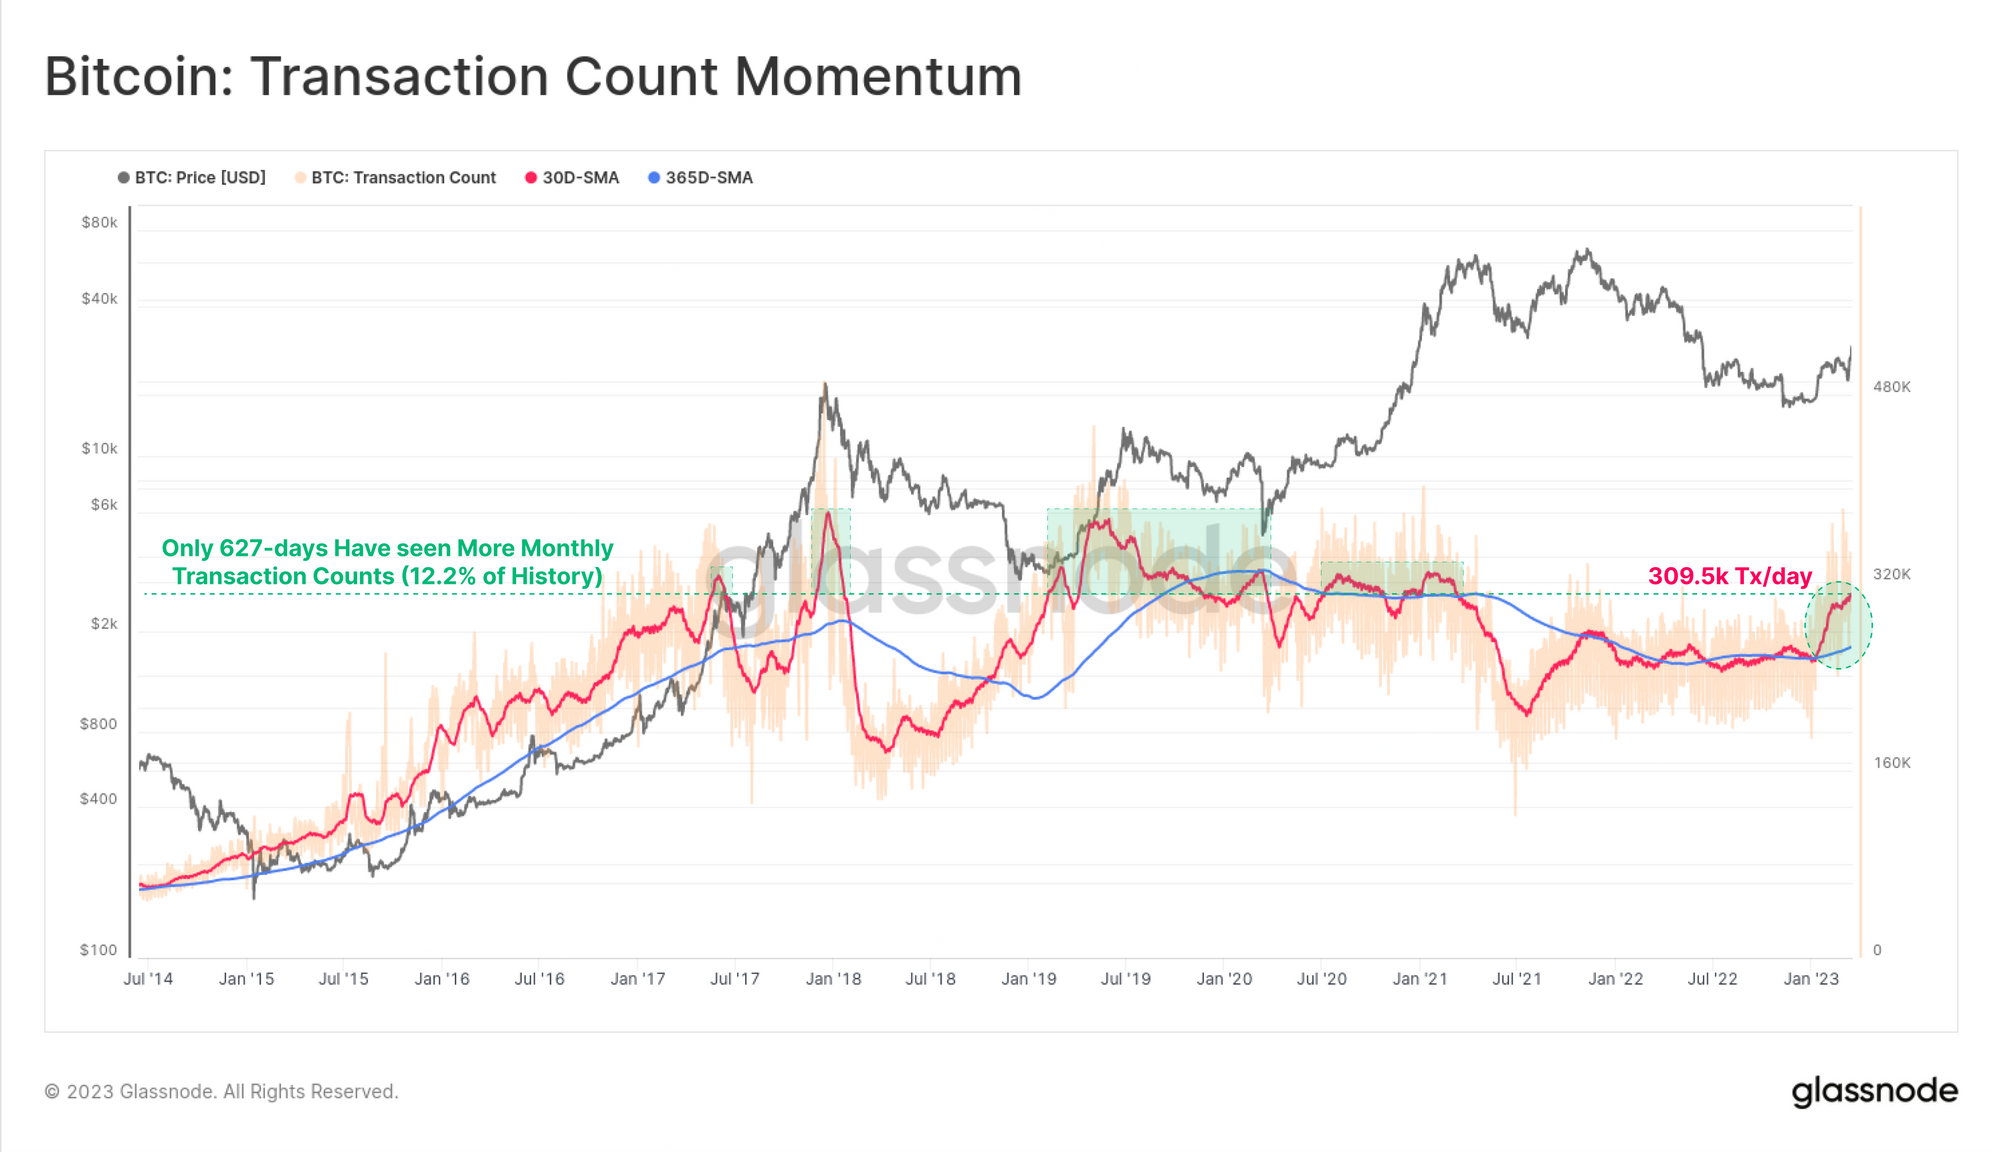
The monthly average of transaction counts has hit 309.5k/day this week, which is the highest level since April 2021, and a significant break above the yearly average. Fewer than 12.2% of all days have seen more transaction activity for Bitcoin, a healthy sign.
🔔 Alert Idea: Transaction Counts (30D-SMA) breaking above 379k would be an all-time-high, breaking the previous peak set at the Dec-2017 market top.
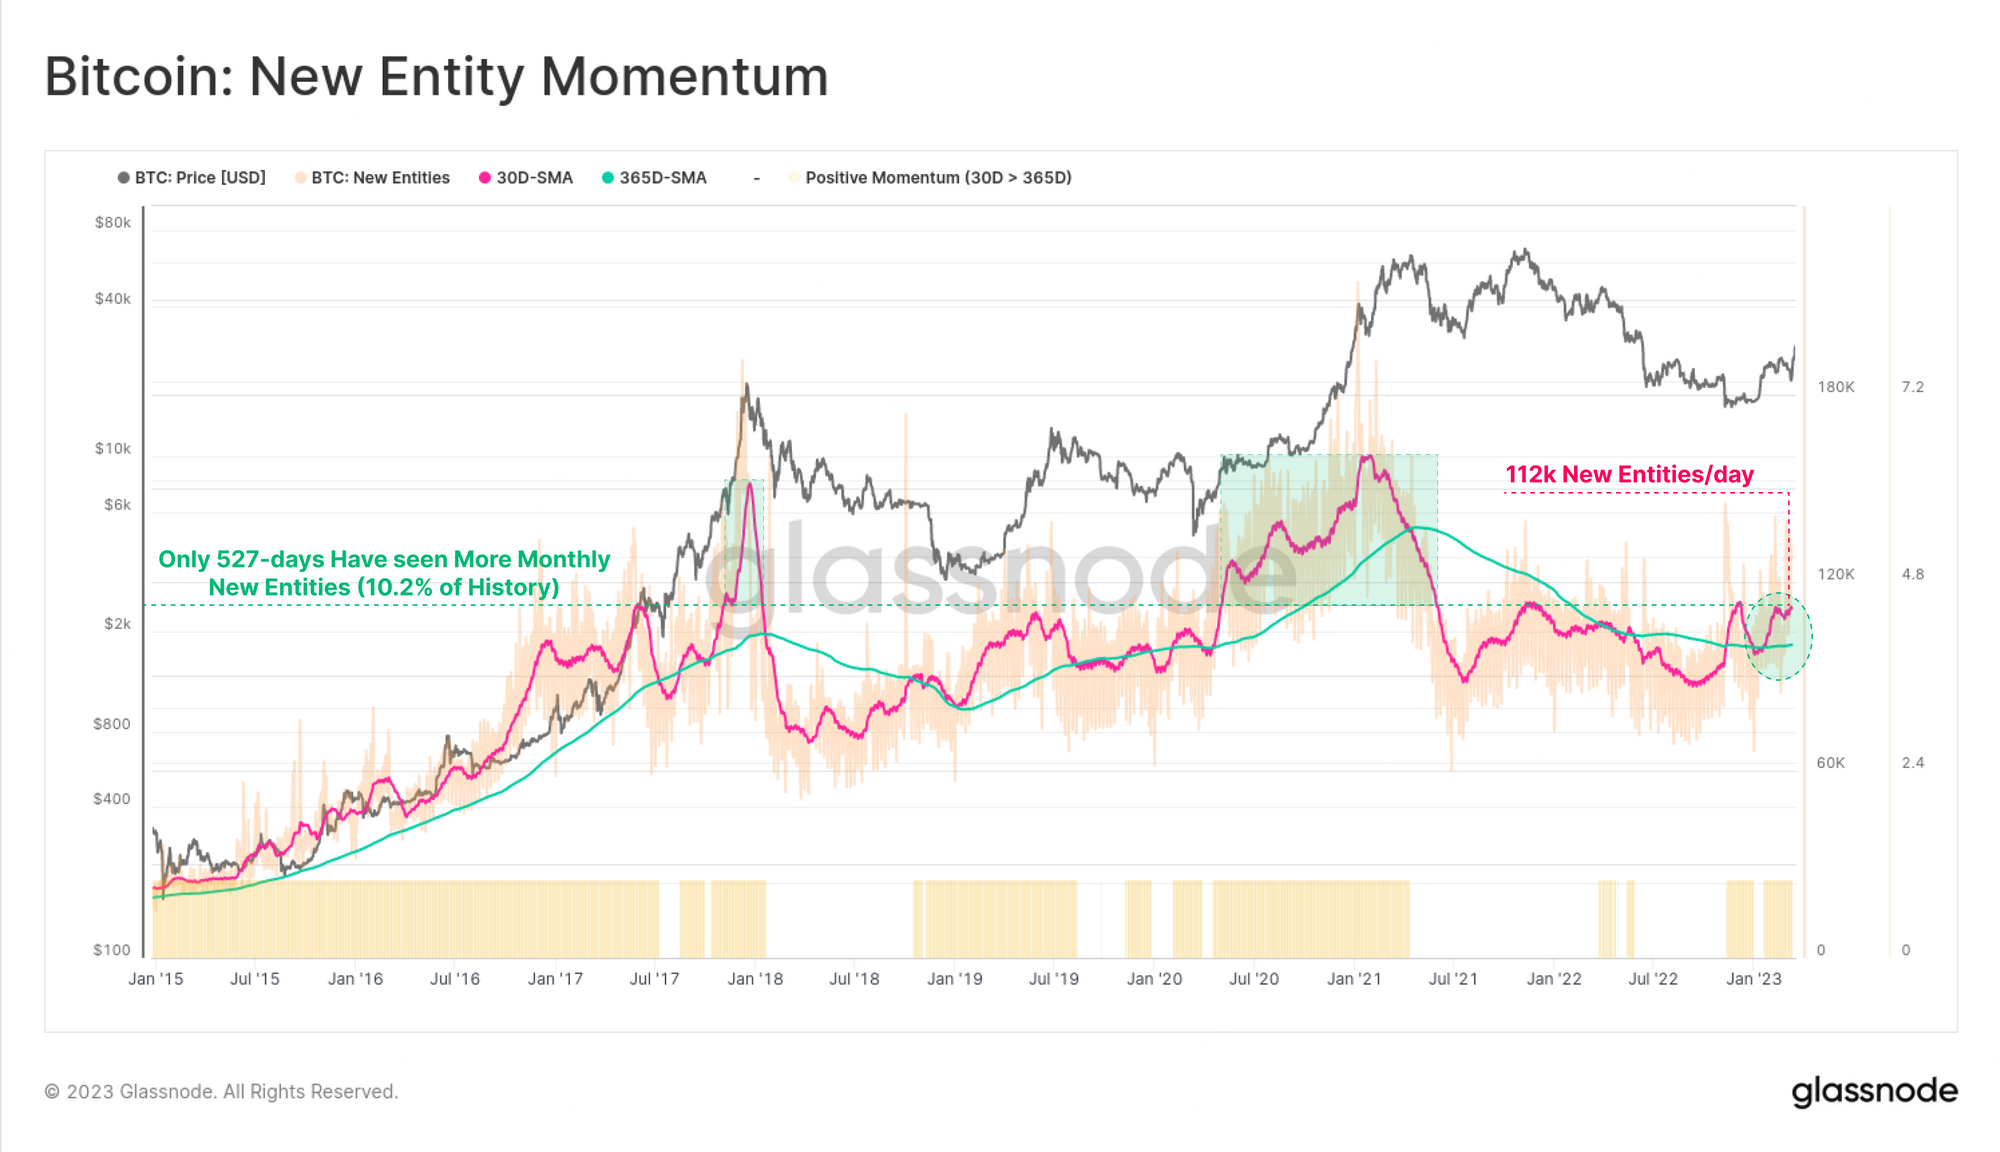
Using our advanced clustering algorithms, we can estimate the number of unique new entities operating on-chain as a best estimate for unique new users. This metric has reached 122k new entities/day, with just 10.2% of days seeing higher new user adoption rates, namely at the 2017 peak, and during the 2020-21 bull run.
🔔 Alert Idea: New Entities (30D-SMA) breaking above 378.5k would be an all-time-high, breaking the previous peak set at the Dec-2017 market top.
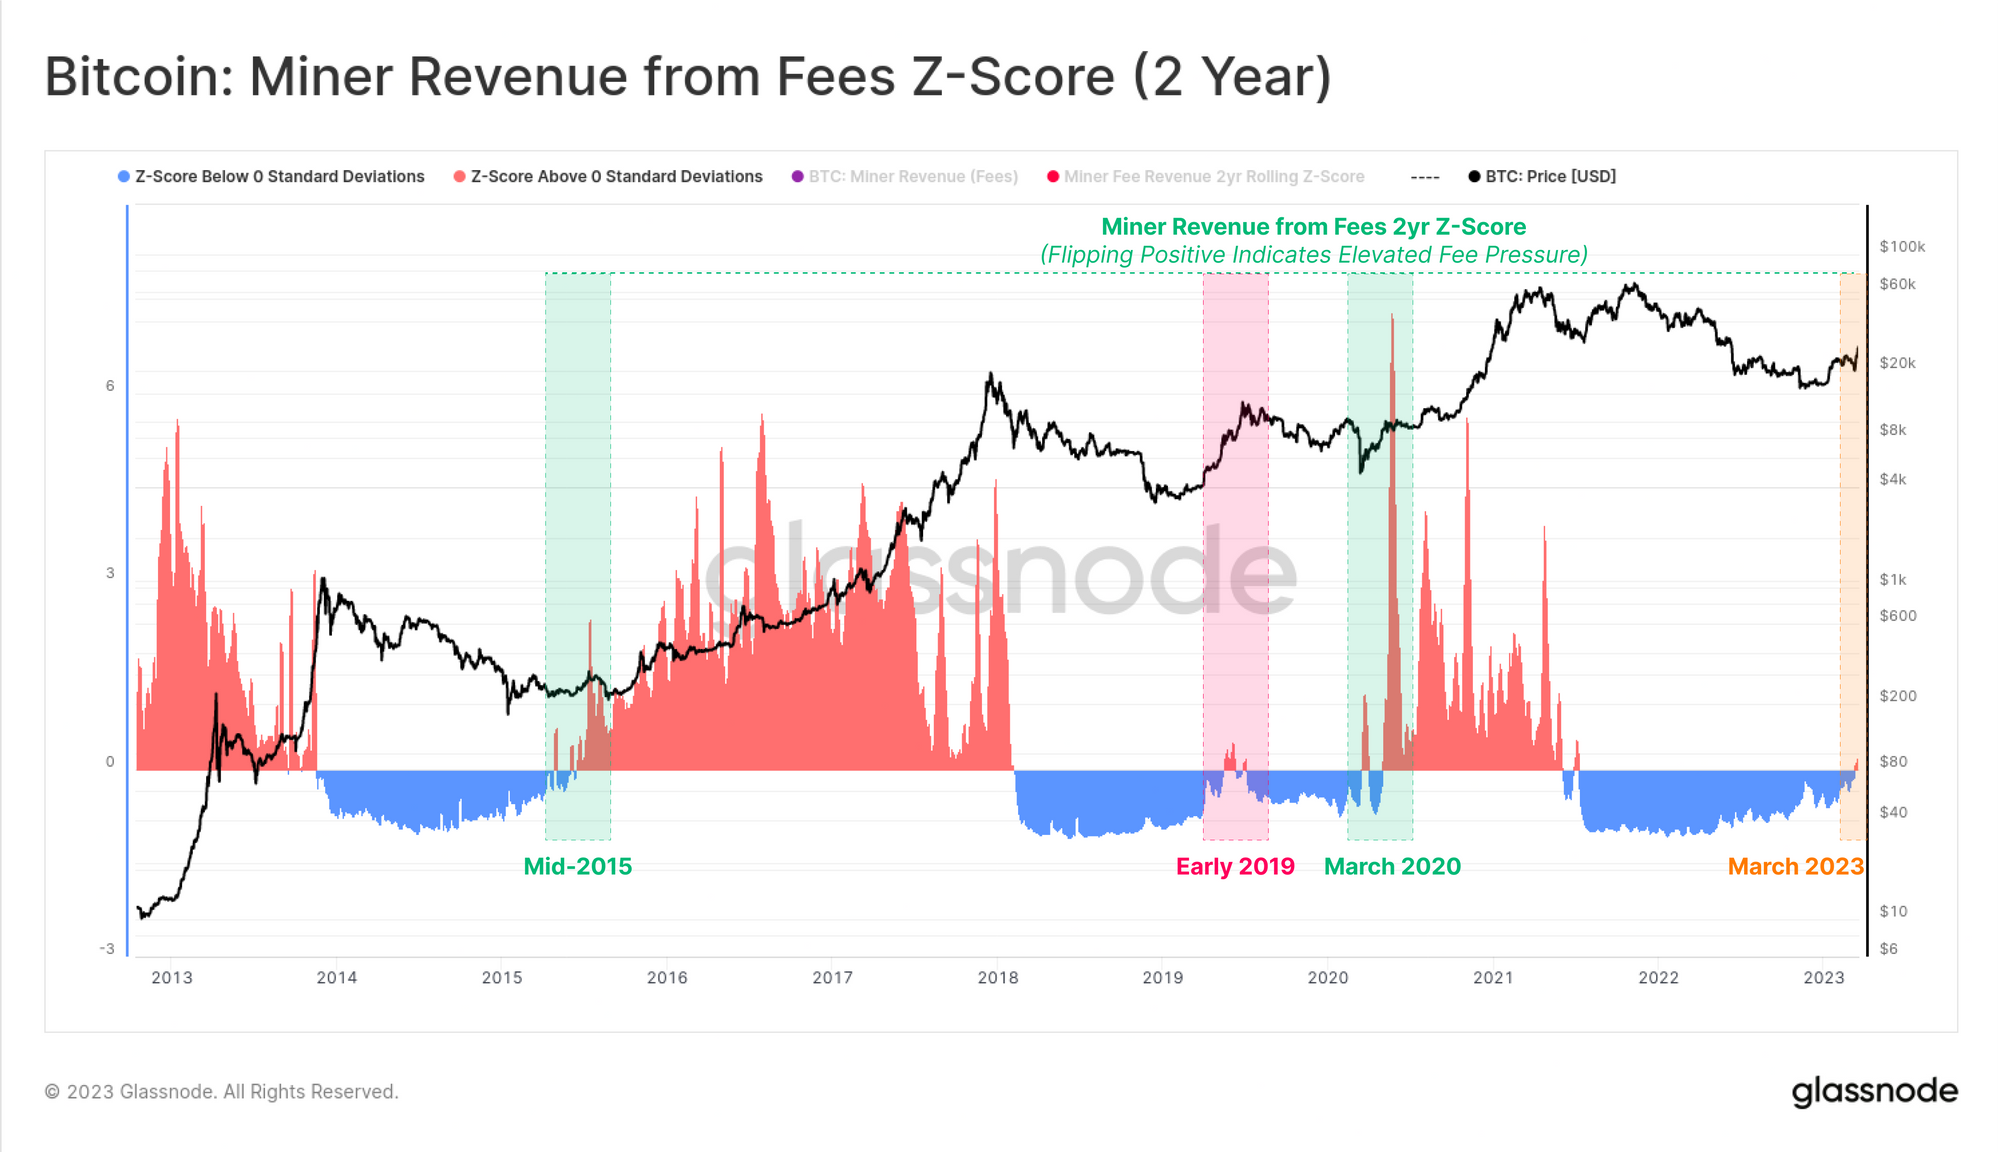
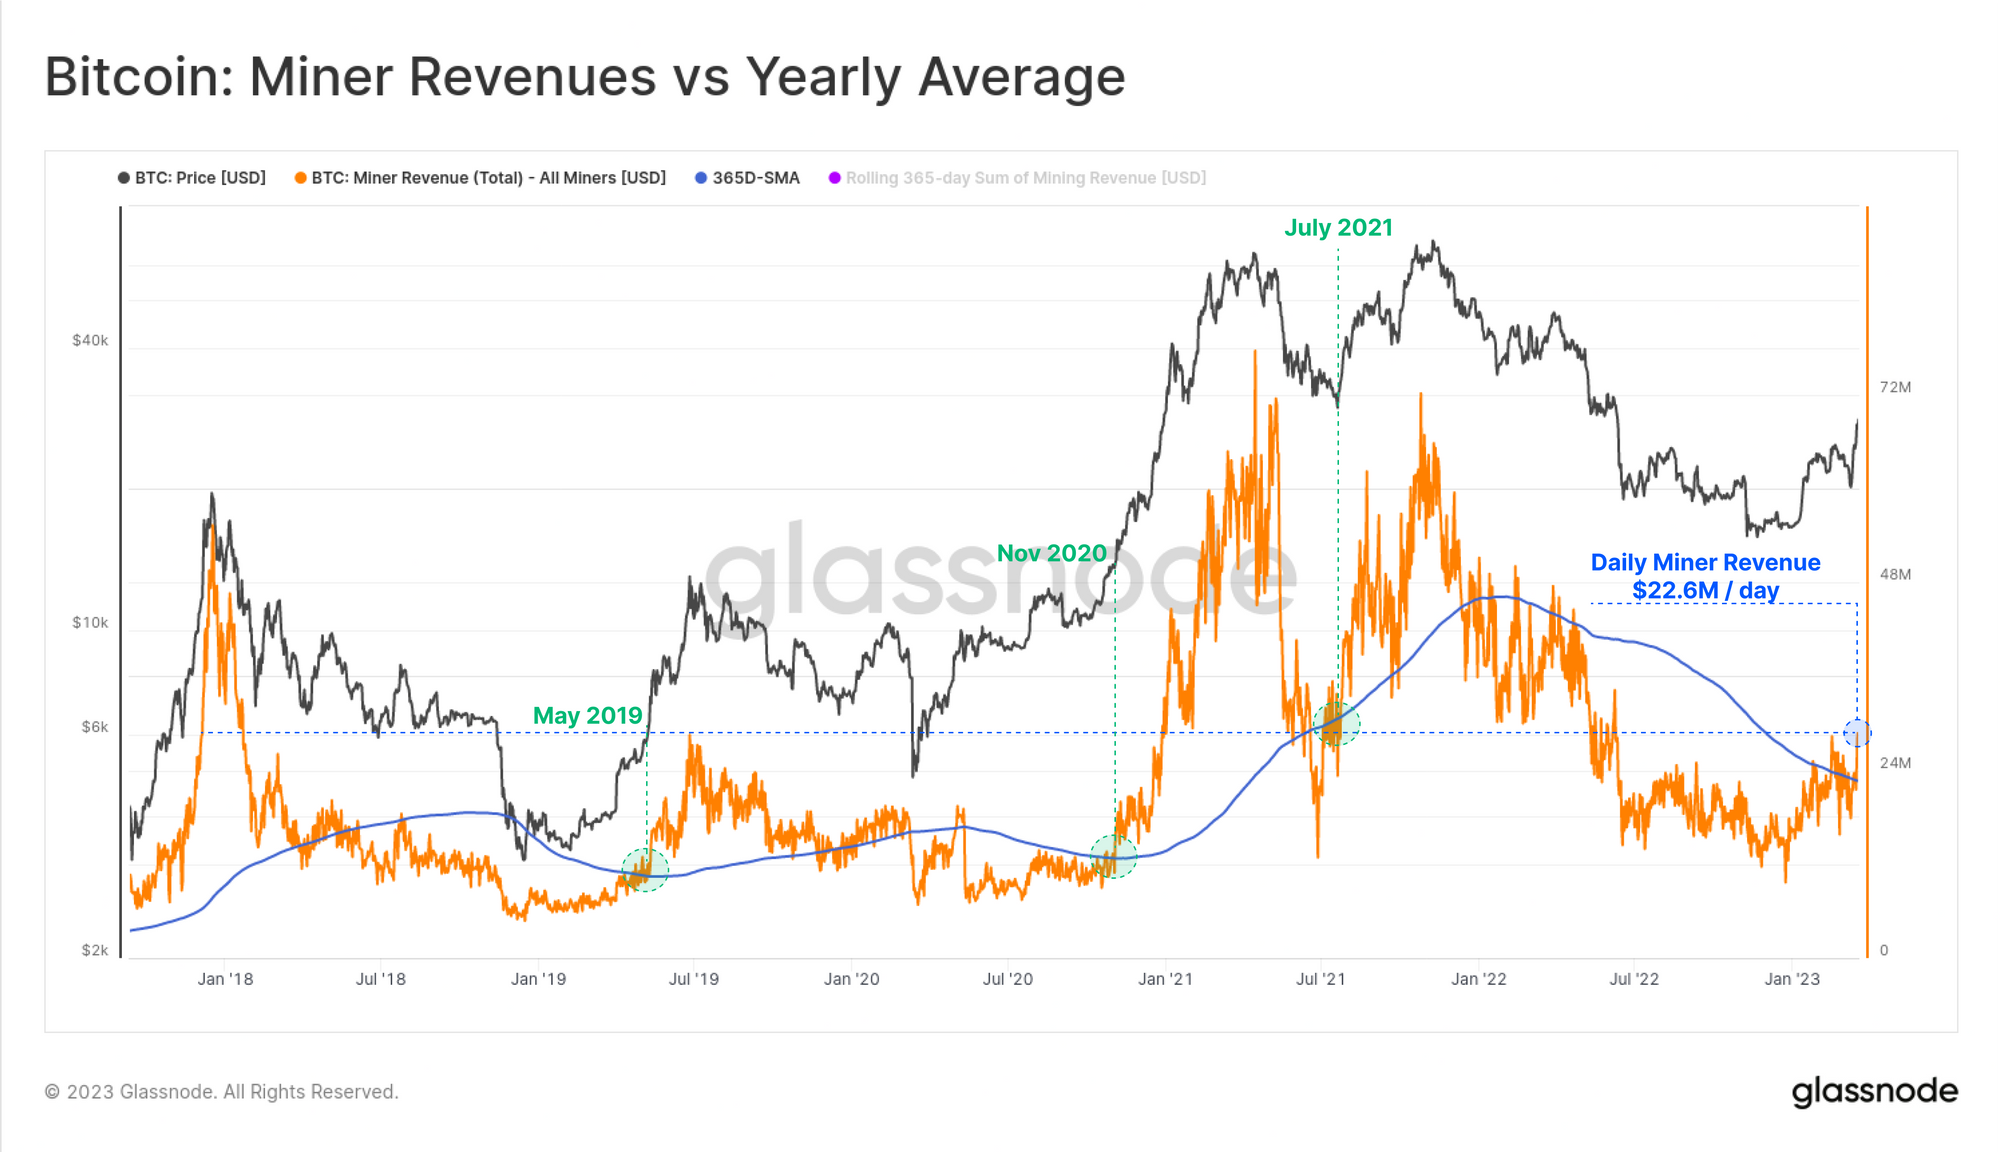
As a result, network congestion is climbing, putting upwards pressure on transaction fees. Bolstered by a new demand from Ordinals and Inscriptions, the 2yr Z-Score for miner revenue from fees has turned positive.
Elevated fee pressure is a common precursor to more constructive markets, coincident with new waves of adoption, expressed via increasing demand for blockspace.
Miners are of course key beneficiaries of this influx, seeing their total revenue spike up to $22.6M/day. This week, miner revenues have lifted to the highest level since June 2022, breaking convincingly above the yearly average.
Similar to the activity models above, this is typically observed near transition points towards a more constructive market.
📖 New Research: Shrimp Supply Sink
The supply distribution of Bitcoin continues to be a topic of great interest, for analysis of capital flows, and also for observing behaviors of investor cohorts. In this piece, we break down the BTC supply by wallet size, explore how coins disperse over time, and demonstrate how smaller holders have continued to grow their share of the Bitcoin pie.
⚙️ Shifting Up A Gear
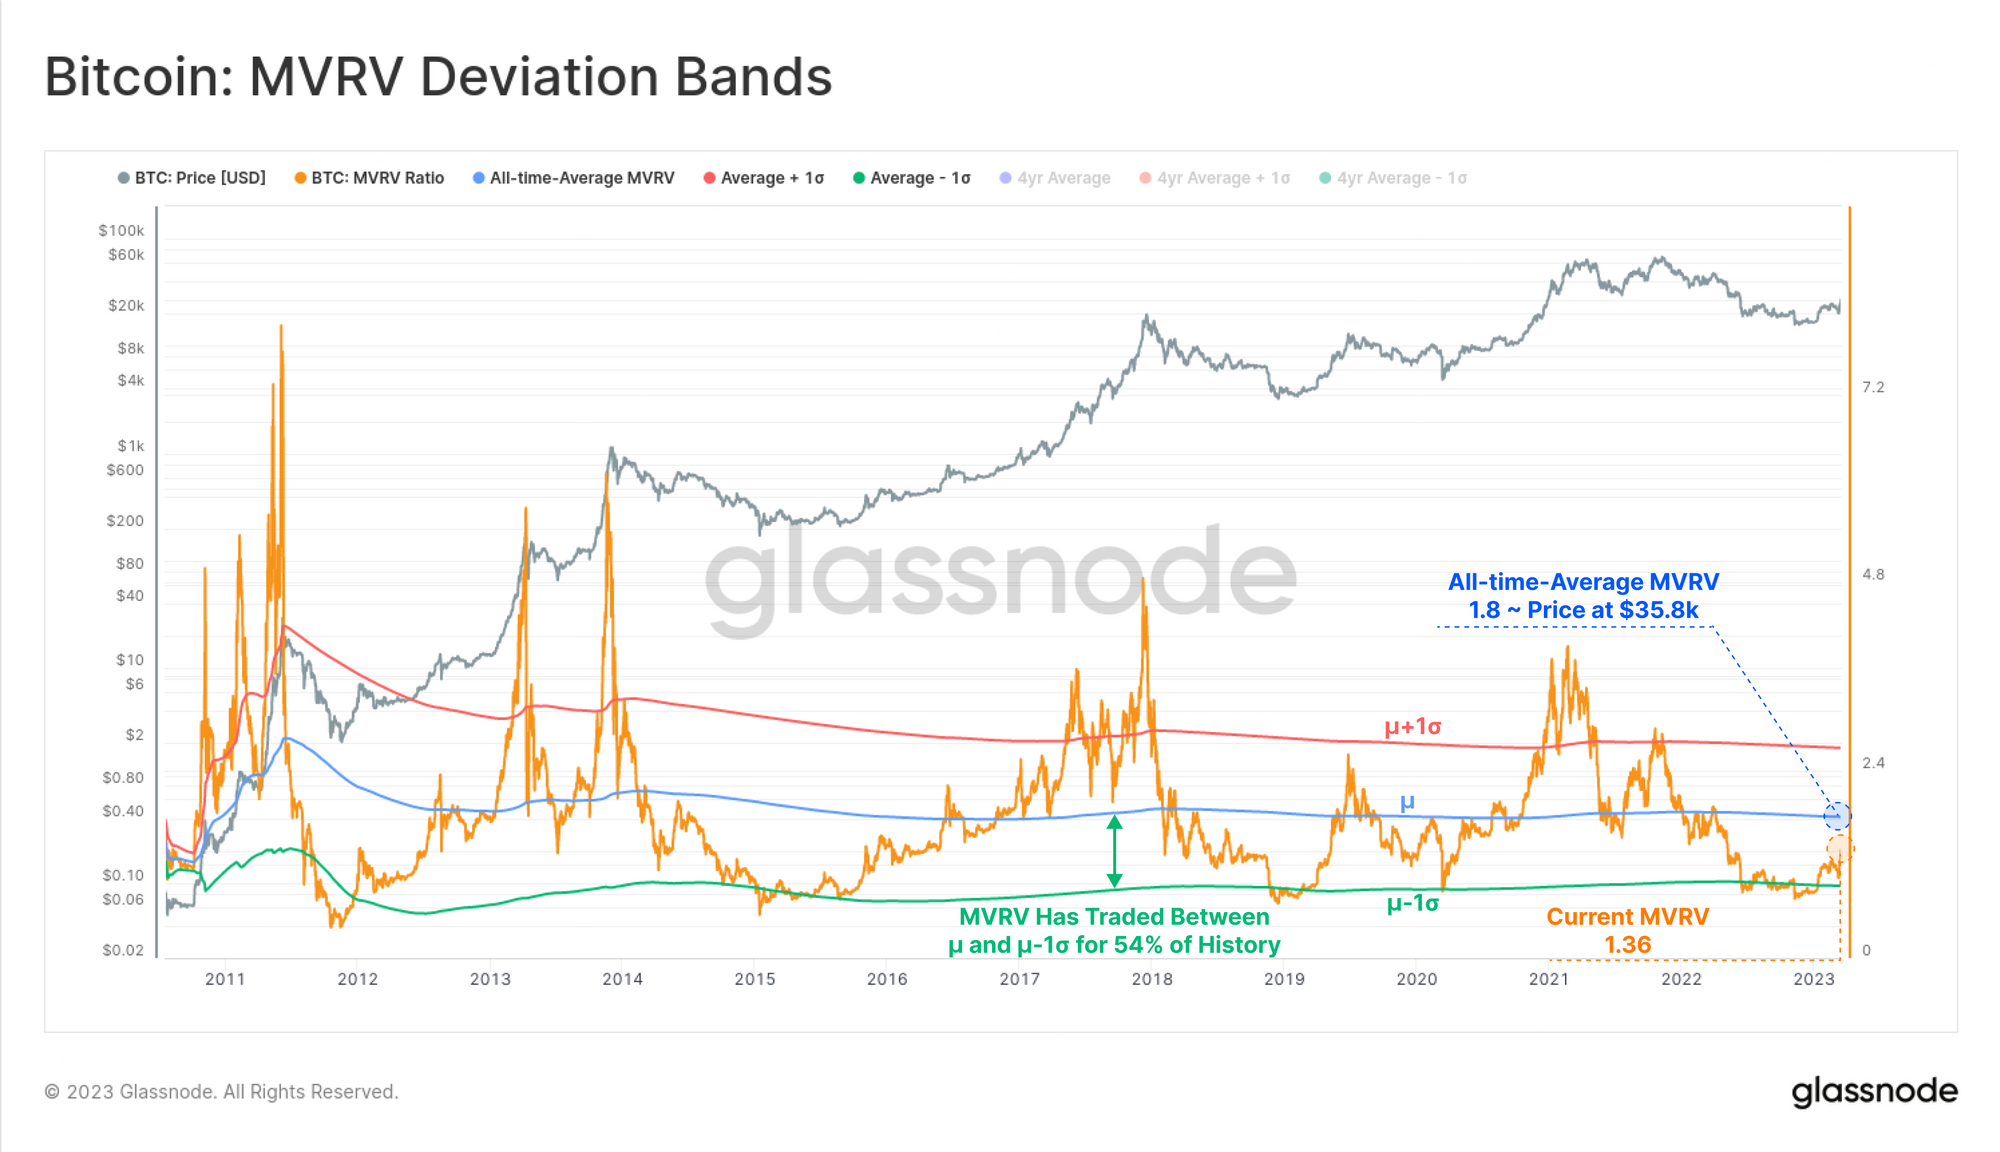
As we explored in early Feb (WoC 6), several on-chain indicators have been transitioning from conditions typical of deep bear markets, and back towards more neutral, and constructive territory. MVRV is one such metric, modelling the unrealized profit multiple held within the coin supply.
The chart below shows that MVRV has traded up to 1.36, which sits between the all-time-average of 1.82, and the 'oversold' -1 standard deviation level. Historically, Bitcoin has traded within this middle ground band for 54% of all trading days, both during late stage bears, as well as early bull market recoveries.
🔔 Alert Idea: MVRV breaking above 1.82 would signal a return to the all-time-average, which has historically defined the boundary between early-to-late bull and bear markets.
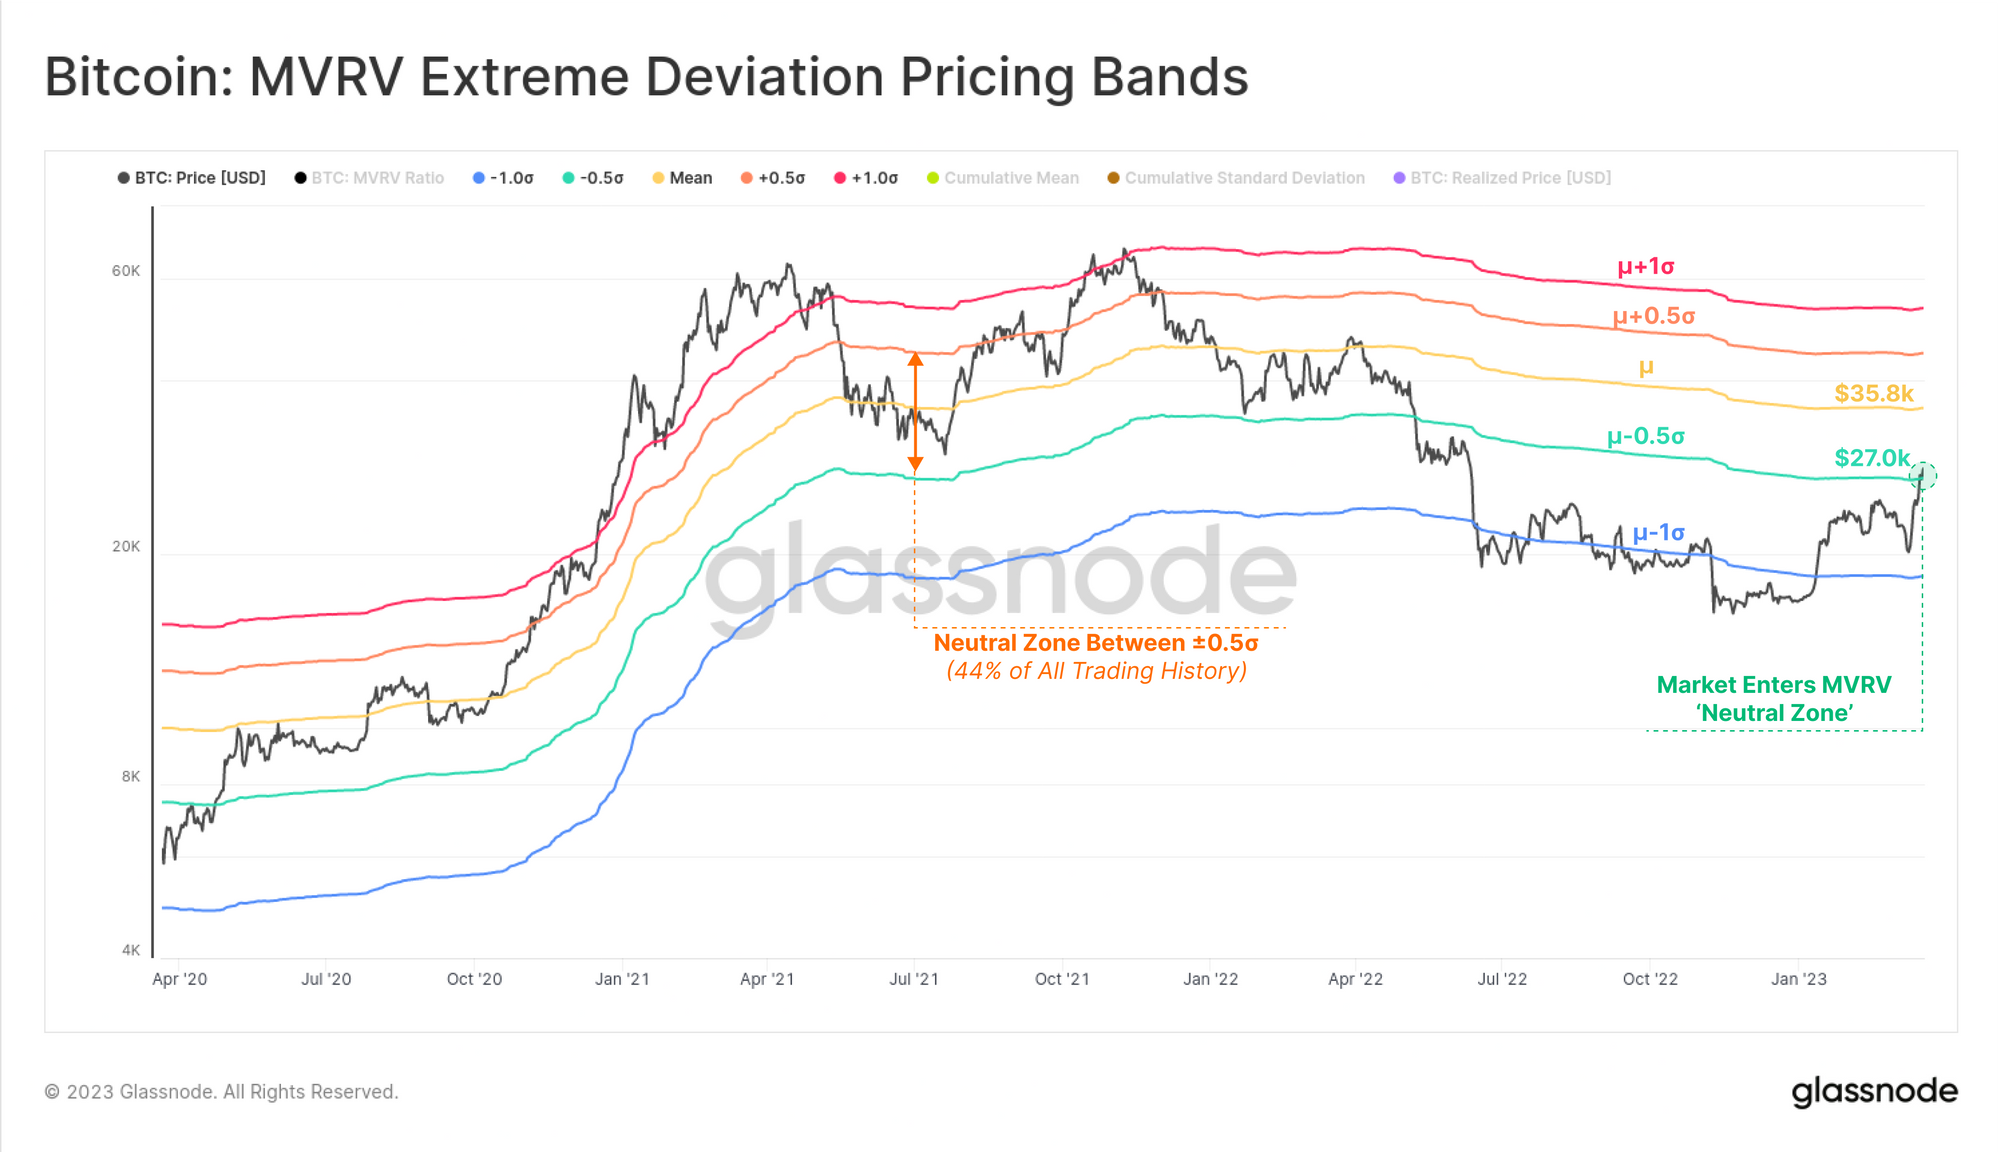
Given MVRV is a ratio derived from the Realized Price, we can back-calculate a pricing level that would correspond with these key MVRV levels. With BTC prices breaking above $27k this week, the market is now trading within the neutral zone of ±0.5 standard deviations from the long term mean.
This indicates that BTC prices are no longer heavily discounted relative to the average on-chain market cost basis.
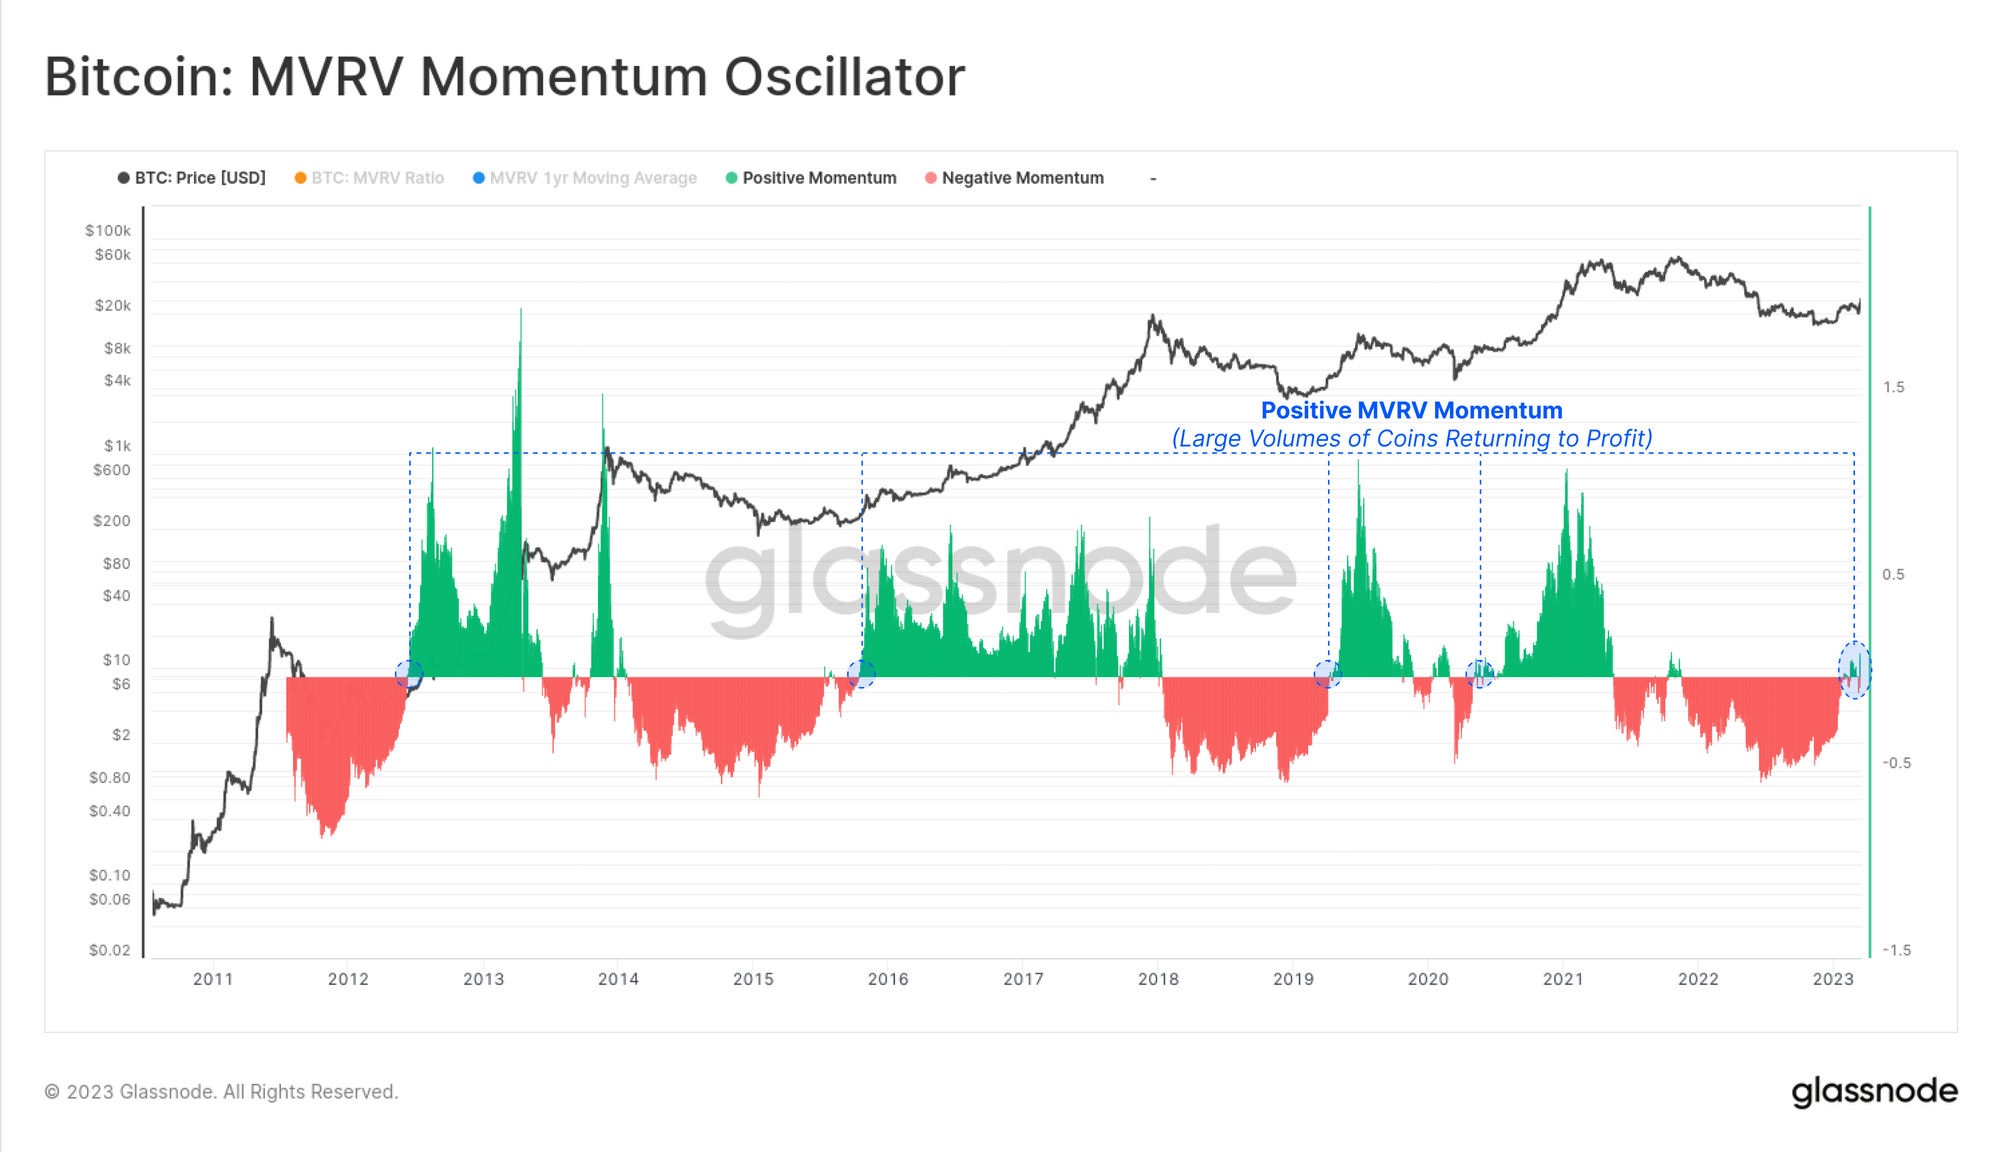
The MVRV Momentum Oscillator is a powerful tool to identify these macro phase shifts, and it is currently in the process of breaking above 0. This indicator is very responsive to events where large proportions of the coin supply are acquired above, or below the spot price, and quickly revert to holding an unrealized loss, or profit respectively (i.e. near cycle inflection points).
MVRV Momentum has just flipped positive, signalling that a large proportion of the coin supply was acquired below the current price, and is now back in profit. Similar to the metrics above, past instances of positive flips tend to also correlate with upticks in network adoption and on-chain activity.
🗜️Workbench Tip: Momentum oscillators take the ratio between metric m1 and sma(m1,365)to observe short-term changes relative to the yearly baseline.
📖 Related Analysis: Mastering MVRV
The MVRV metrics above draw on a methodology for identifying extreme deviations from the long-term mean, with live dashboards and charts available for both the Bitcoin MVRV and Ethereum MVRV.
🧊 Following the Cold Money
One of the more powerful tools within on-chain analysis is our ability to monitor the holding time of coins, called Lifespan. This allows us to identify when older coins, typically held by longer-term, high conviction HODLers are on the move.
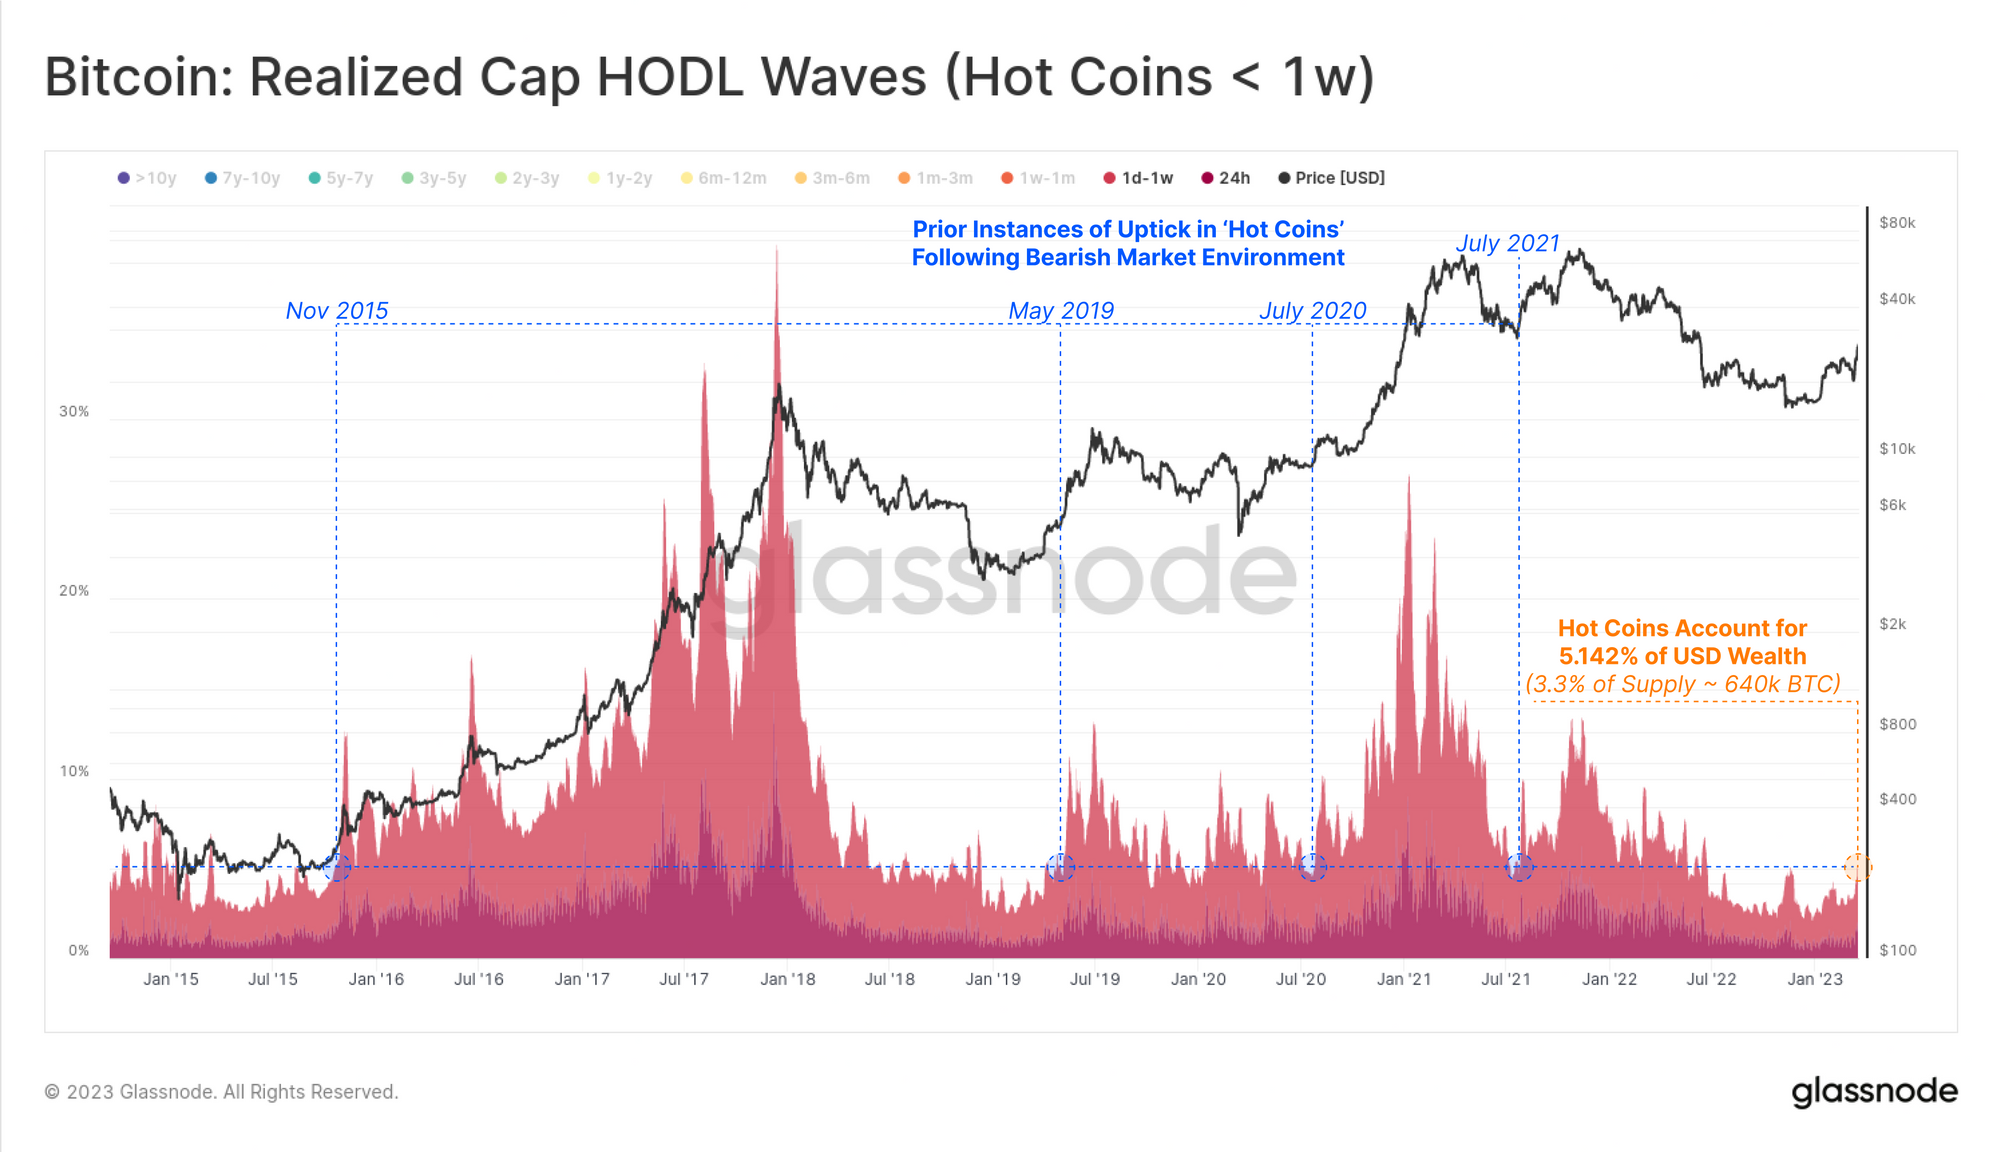
The chart below shows the proportion of USD wealth held in 'hot coins', defined as coins that transacted within the last 7-days. This metric primarily increases when old coins are spent and take profits, transferring cheap and old coins, to new buyers at expensive prices.
Whilst there has been an slight uptick in the proportion of 'hot coins', it remains close to cycle lows, once again similar to transitional periods following significant bearish trends. This indicates that despite the strong price performance, it still insufficient to motivate most owners of older coins to take profits.
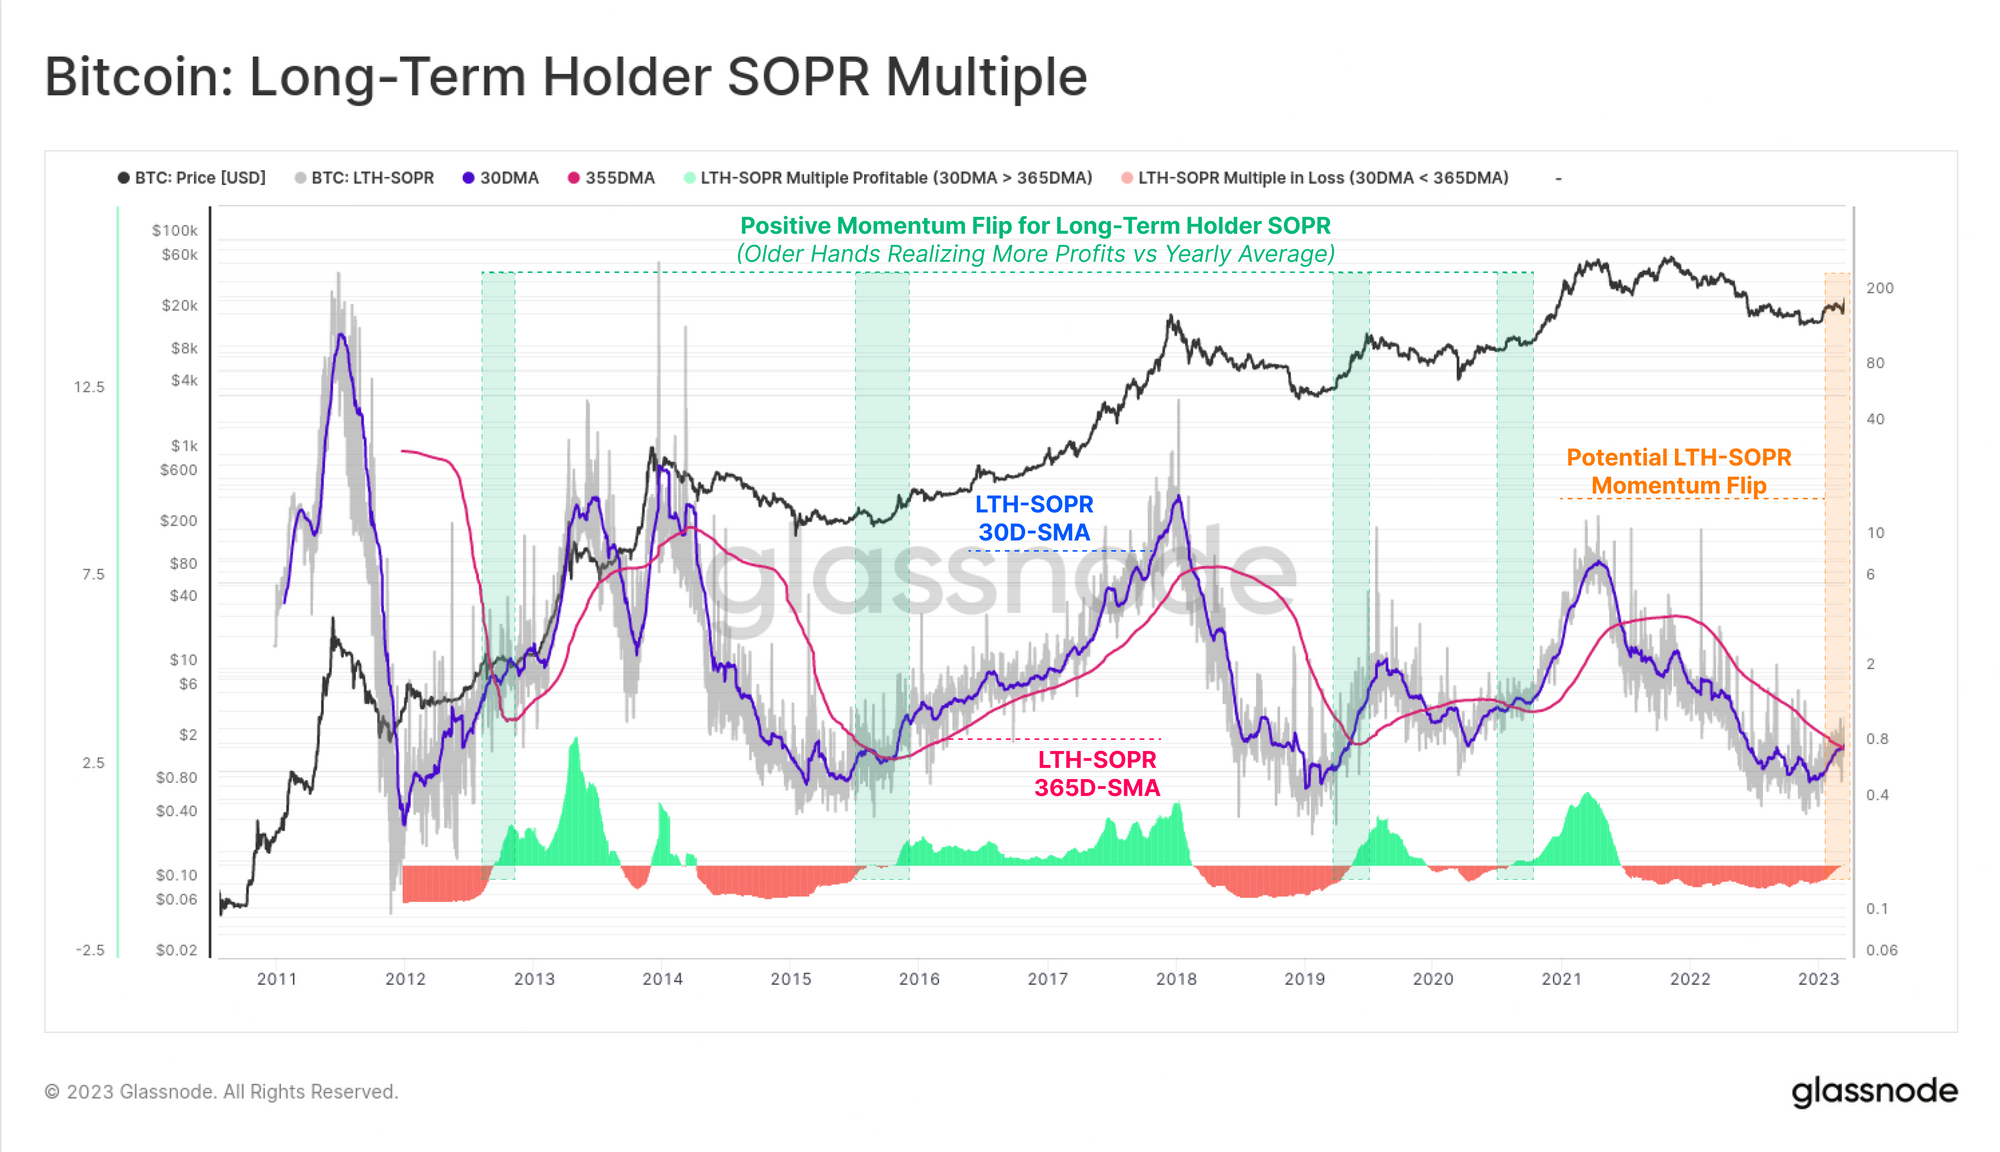
We can see this in Long-Term Holder SOPR, which is in the process of returning to neutral territory. Long-Term Holders (LTHs) are largely buyers from the 2020-22 cycle, and they have been locking in losses for almost 12 consecutive months.
The monthly average of LTH-SOPR is currently breaking above the yearly average, suggesting a return of both confidence, and a return of positive momentum in their spending patterns.
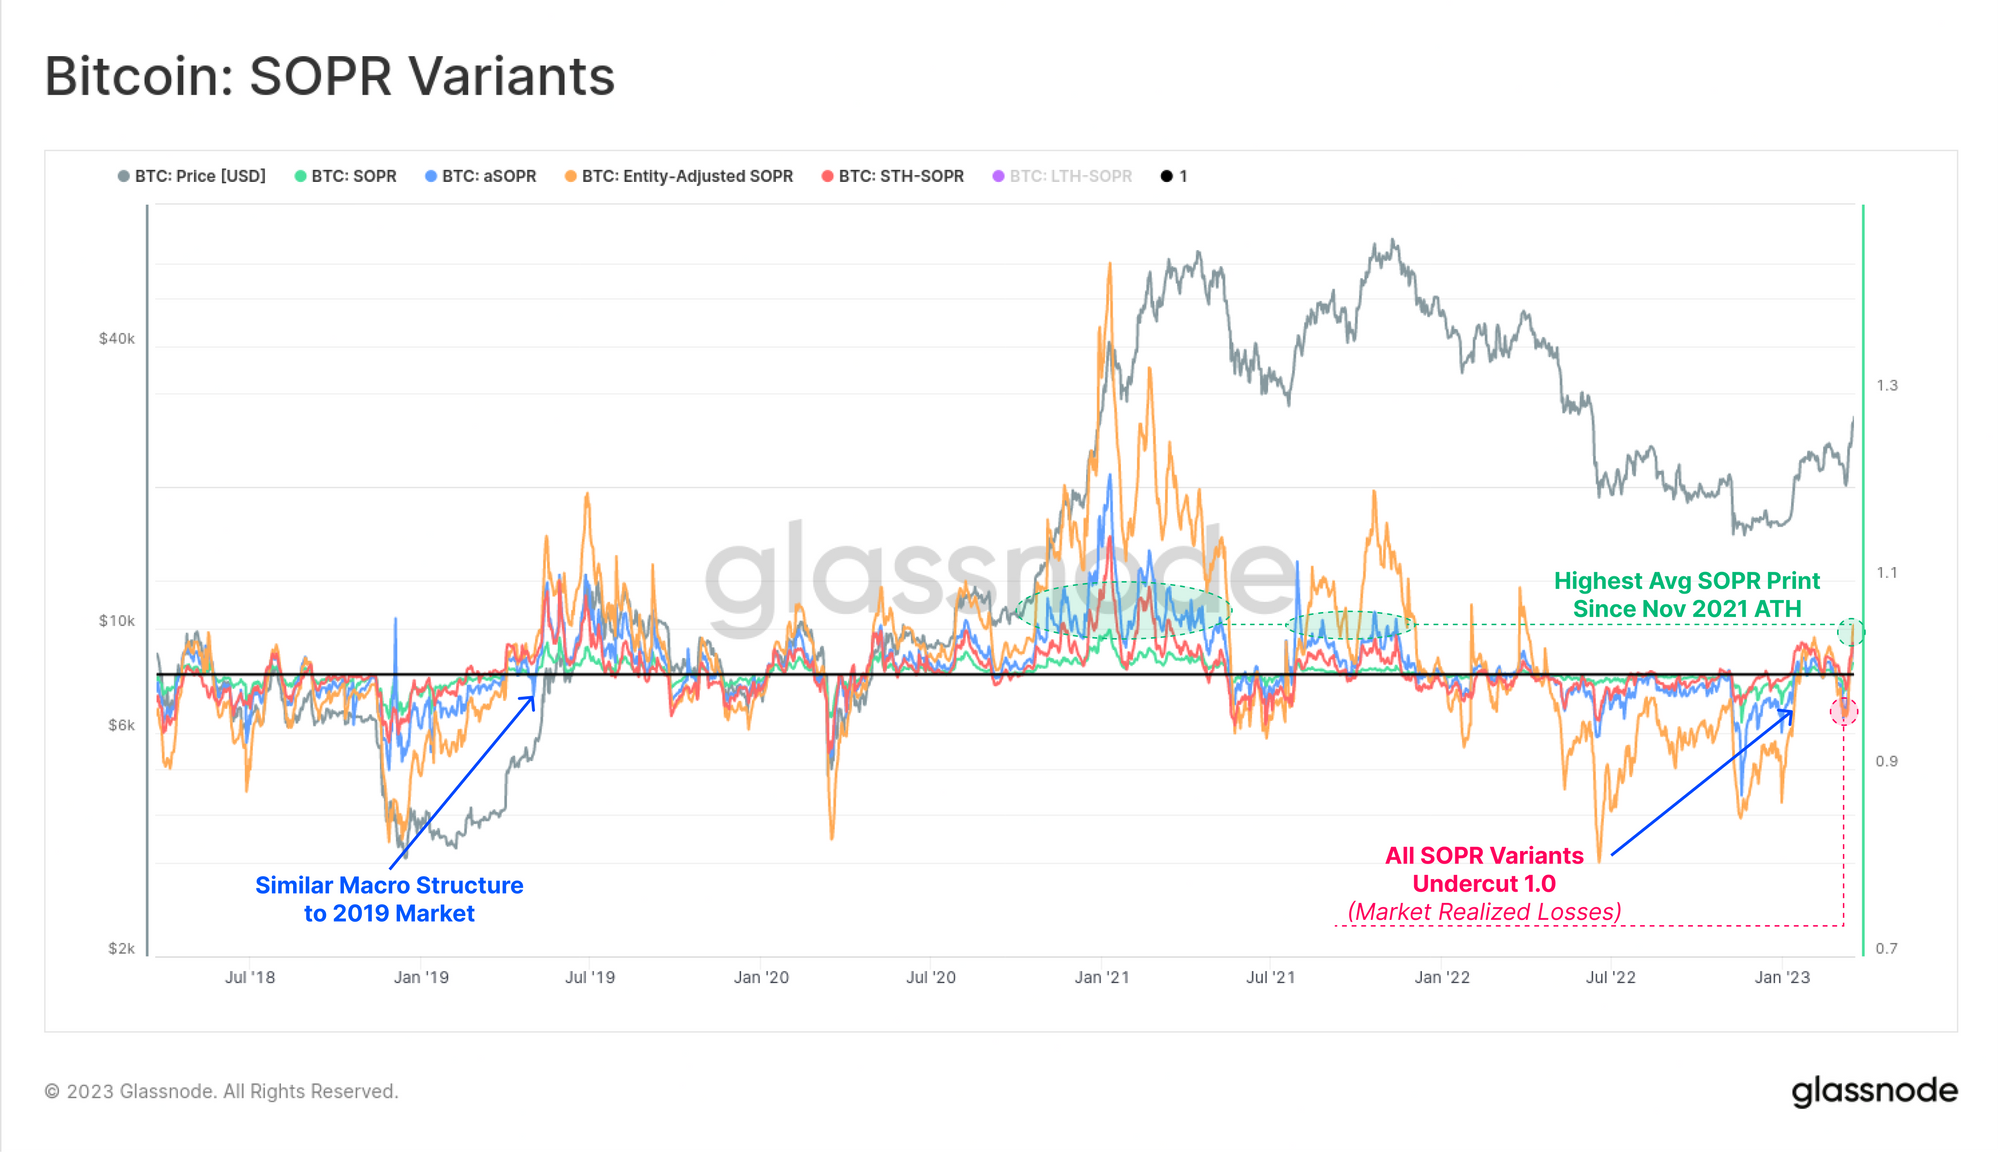
Finally, taking a view over the entire market, we revisit several SOPR variants, which is a metric we also covered in last weeks edition (WoC 11). SOPR is an all-weather metric which can be used to track the degree of profit and loss realized by market cohorts.
Here we have overlaid four SOPR variants:
- 🟢 SOPR - covering spending behavior of the entire network.
- 🔵 Adjusted SOPR - filtering out non-economical relay transactions (< 1hr lifespan).
- 🟠 Entity-Adjusted SOPR - our cleanest filtering for the most economically meaningful spending activity across the whole network.
- 🔴 Short-Term Holder SOPR - filtering only for coins acquired within the last 155-days.
We note a similar recovery structure to the 2018-19 cycle is currently underway. A healthy 'wash-out' event took place last week, with all SOPR variants undercutting a level of 1.0. This indicates a widescale realized loss event during the sell-off the $19.8k.
This week however, has followed up with the highest SOPR print since the Nov 2021 ATH, suggesting that whilst profits are undoubtedly being taken, it has yet to put brakes on the prevailing uptrend.
Summary and Conclusions
Bitcoin investors have experienced one of the strongest one-week gains on record, amidst a backdrop of stress, consolidation, and liquidity injections across the global banking system. Several on-chain indicators suggest that the Bitcoin market is transitioning out of conditions historically associated with deep bear markets, and back towards and greener pastures.
Adoption on-chain is accelerating higher, and the majority of coin holders who have weathered volatility for over 5-months remain largely firm handed. Few longer-term investors appear to be motivated to take profits into this rally, signalling a remarkable strength, and a reflection of the beliefs held about Bitcoin's important role in the future of the global financial system.
Disclaimer: This report does not provide any investment advice. All data is provided for information and educational purposes only. No investment decision shall be based on the information provided here and you are solely responsible for your own investment decisions.