Betting on the Merge

As Bitcoin and Ethereum derivative markets mature, sophisticated trade positions can be established using both options and futures. The Ethereum Merge presents an opportunity to observe such market positioning at a large scale.

Betting on the Merge

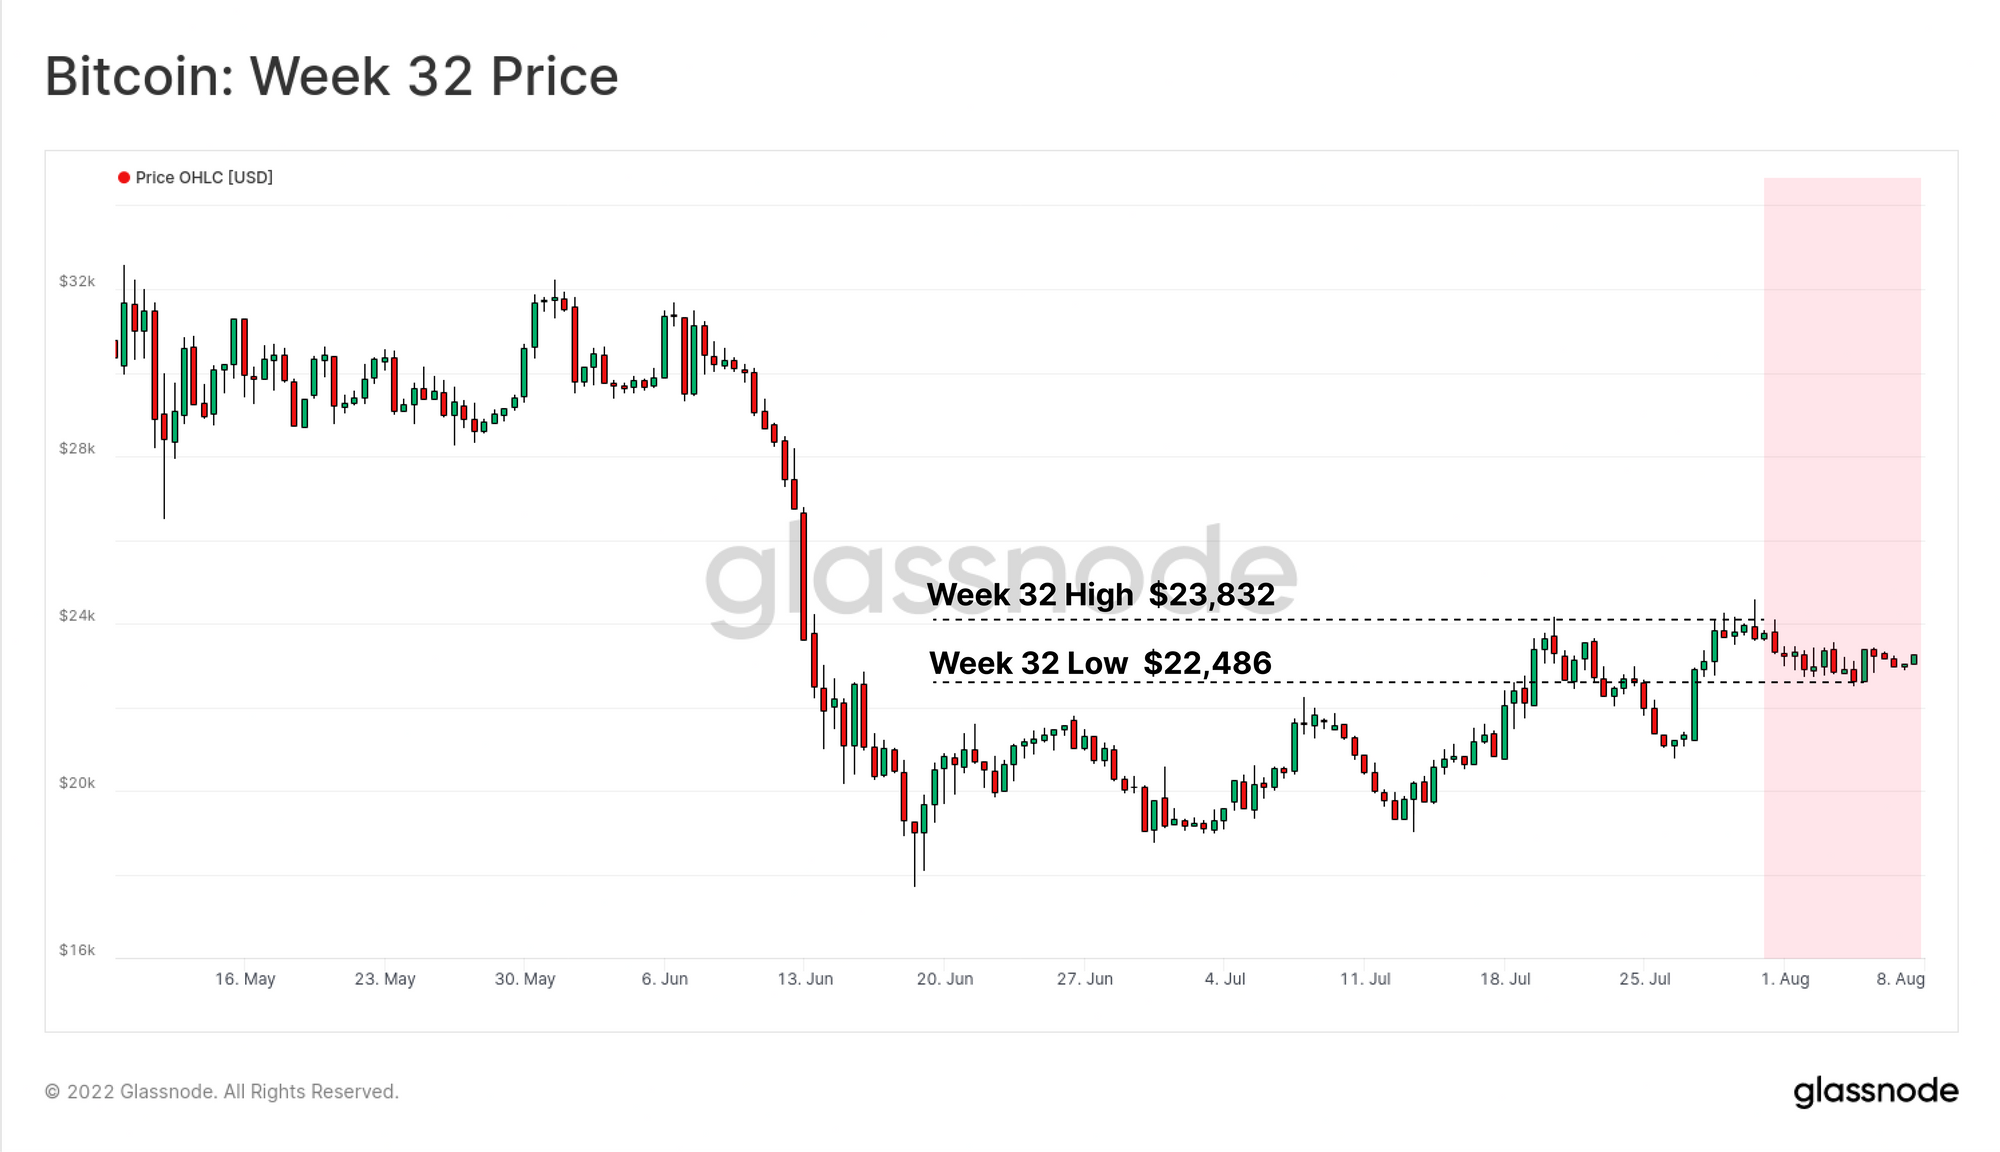
The Bitcoin market was relatively quiet this week, consolidating between a high of $23,832, and a low of $22,486. With market conditions still recovering from a fairly volatile June, there are subtle shifts occurring in positioning within Bitcoin and Ethereum derivatives markets.

In this weeks newsletter, we will explore a notable divergence which has developed in the futures and options markets, centred around the Etheruem Merge scheduled for September. Traders appear to be utilising call options to bet on the ETH price into September, whilst futures and options backwardation indicate an expectation to sell-the-news is in play.

This appears to be relatively sophisticated market positioning, adding further evidence of institutional capital being deployed into the maturing liquidity of futures and options markets.


Translations

This Week On-chain is now being translated into Spanish, Italian, Chinese, Japanese, Turkish, French, Portuguese, Farsi, Polish, Russian, Arabic and Greek.

The Week Onchain Dashboard

The Week Onchain Newsletter has a live dashboard with all featured charts available here. This dashboard and all covered metrics are explored further in our Video Report, which is released on Tuesdays each week. Visit and subscribe to our Youtube Channel, and visit our Video Portal for more video content and metric tutorials.


The Bitcoin Baseline

To start our analysis, we will assess how derivatives markets are pricing Bitcoin, given there are few protocol level fundamental changes affecting the near term pricing.

Since the start of April, Bitcoin futures markets have seen a dramatic increase in open interest, lifting off the baseline of around 350k BTC, and reaching new heights of 538k BTC. Growth is led by a handful of exchanges, primarily Binance, Deribit, OKEx, Bybit, FTX and CME.

Comparing open interest in a BTC denomination helps isolate periods of growth in futures leverage, from coin price changes. On a USD basis, current open interest is $12.4B, which is relatively low, and equivalent to the early bull market in Jan 2021, and at the $29k sell-off lows in June 2021.


🔔 Alert Idea: Futures Open Interest breaking above 550k BTC would signal a new ATH in futures leverage, and suggest increased probability of a deleveraging event.
Live Advanced Chart-

Futures trade volume appears to have stabilised in the post-LUNA collapse era. Trade volume experienced a structural decline over the 12-months since the May 2021 sell-off, but appears to be re-establishing a floor at around $33B/day.

Given the large scale increase in open interest (on a relative scale), this may indicate that traders are increasingly willing to take on Bitcoin price exposure following the two major capitulation events in May and June.


🔔 Alert Idea: Futures Volume (7D SMA) breaking above $45B would signal a notable uptick in trade volume, and suggest increased probability of near-term volatility.
Live Advanced Chart

A structural change has also taken place in futures markets over the last 18-months. The proportion of coin-backed margin has declined from 70%, to a new normal baseline of around 40% dominance. In other words, approximately 60% of futures margin is now posted via stablecoin and fiat collateral, removing the added volatility brought on by collateral value changing alongside the futures contracts.

This means that whilst futures leverage is high, the underlying margin appears to be much more stable, reducing the impact of negative convexity in contrast to early 2021.

Live Professional Chart

Futures are pricing Bitcoin in a state of contango, where traders must pay a slight premium to obtain exposure to Bitcoin in the future. This is the more common condition for Bitcoin markets, and the premium out to years end is just 3.24%. This cash-and-carry yield is only barely competitive with yields available on US treasuries, and thus hardly indicative of any long-term bullish bias just yet.

Live Professional Chart

A similar level of neutrality can be seen in the perpetual swap funding rates, which are slightly positive, and yielding 2.3% on an annualized basis. As per the calendar futures, slightly positive yield is normal, and the level of funding rates suggest there is relatively little bias in either direction.

Overall, Bitcoin futures markets appear to stabilising in trade volume, and are suggesting a slight bias towards upside. Open interest is high on a BTC relative basis, however not so much on a USD basis. This appears to indicate that traders are increasingly willing to take on BTC price exposure, but are not 'betting the farm' just yet.


🔔 Alert Idea: Funding Rates (7D SMA) breaking below 0 would signal a negative reversal of current premium, and breaking above 0.005% would signcal increased speculative premium.
Live Advanced Chart

Merge Calling

On the other side of the fence however, derivatives traders are placing directionally obvious bets for Ethereum, specifically relating to the upcoming Merge planned on 19 September. For the first time in history, Ethereum options open interest at $6.6B is now higher than for Bitcoin at $4.8B.

Whilst not an all-time-high yet, ETH options OI is close to setting a new one, whilst Bitcoin open interest remains well below the peak at just 35% of the ATH.

Live Advanced Chart

If we look the the September contracts on Deribit, the directional bias of Ethereum traders is immediately clear. Call options dwarf put options for size, with traders betting on ETH prices upwards of $2.2k, with significant open interest even out to $5.0k.

The max pain price however is currently at around $1.35k, which would lead to the maximum number of options expiring out of the money. Given this is below the spot price as of today, it sets up for a very interesting month ahead.

Live Professional Chart

This large buy side demand for ETH call options expiring in September has pushed the volatility smile into a state of extreme bullish bias. Overlaid on this chart are open interest bars, where it can be seen that the upwards slope is driven heavily by traders willing to pay a premium for long call exposure.

Implied volatility for this contract is well above 100% at almost all strike prices. The most bullish traders, who are buying call options above $5k, are willing to pay a premium of over 130% implied volatility.

Live Professional Chart

If we compare the shape and scale of the September volatility smile to October, we can see a dramatic decline on the right tail, with a relatively flat shape, and sub-110% IV across the curve. This suggests a relatively lower demand for ETH exposure via options after the Merge event.

Interestingly, post merge, the left tail is pricing in significantly higher implied volatility, indicating traders are paying a premium for 'sell-the-news' put option protection post-Merge.

Live Professional Chart

Selling the Future News

Given the strongly bullish bias in ETH options markets, it would be expected that spot demand would be quite strong. However, a look to the exchange net position change shows just -$700M on net withdrawn per month.

Whilst $700M is a large sum, exchange withdrawals pale in comparison to the recent peaks of $3B+ per month, and also in comparison to the $6.6B in options open interest. Monthly exchange withdrawals today are just 2% the size of futures trade volume, whereas this ratio reached over 20% in April 2022 and November 2021.

Live Advanced Chart

The futures term structure for ETH is remarkably different to the Bitcoin curve in shape, and is in a condition of backwardation. This means that futures traders are pricing ETH at a discount post Merge, aligning with the higher premium paid by options traders.

Whilst the discount is only small, just -2.27% annualized, it does suggest there is a large degree of short activity in the calendar futures markets. The most probable explanation is that investors are utilizing futures markets to both hedge downside risk, and perhaps finance the premiums paid on the options positions.

Live Professional Chart

Lastly, we can see that demand for short calendar futures (3-month basis) is manifesting as a negative cost of carry, reaching around -3.68% annualized. This confirms that traders are willing to pay a premium for downside protection, with eyes on the Merge for both upside speculation into it, and a sell-the-news event after the fact.

This demonstrates how traders are placing increasingly sophisticated positions, utilizing the growing depth of futures and options markets. This however, is not reflected as strongly in spot markets, suggesting traders see the Merge primarily as an opportunity for price exposure, and less so as a case for a more fundamental spot position as yet.

Live Advanced Workbench

Summary and Conclusions

In this newsletter, we analyzed both futures and options markets, to assess what the market is pricing for in the near term. With Bitcoin as a baseline, it suggests that investors are willing to take on more price exposure, but have not yet taken on heavy exposure. There is little directional bias evident in Bitcoin derivatives markets.

On the Ethereum side however, traders are clearly holding a long bias, expressed heavily in options contracts centred in September. Both futures and options market are in backwardation after September, suggesting traders are expecting the Merge to be a 'buy the rumor, sell the news' style event, and have positioned accordingly.

Spot withdrawals for ETH from exchanges are however relatively small compared to recent demand peaks. This indicates that sophisticated traders are utilizing the depth of derivatives markets as the preferred instrument, to obtain price exposure, and hedging risk of the Merge event.


Product Updates

All product updates, improvements and manual updates to metrics and data are recorded in our changelog for your reference.

Disclaimer: This report does not provide any investment advice. All data is provided for information purposes only. No investment decision shall be based on the information provided here and you are solely responsible for your own investment decisions.