The Week Onchain (Week 40, 2021)

The Bitcoin price has rallied strongly out of a zone of heavy accumulation, seeing around $1.75B worth of capital inflows per day.

The Week Onchain (Week 40, 2021)

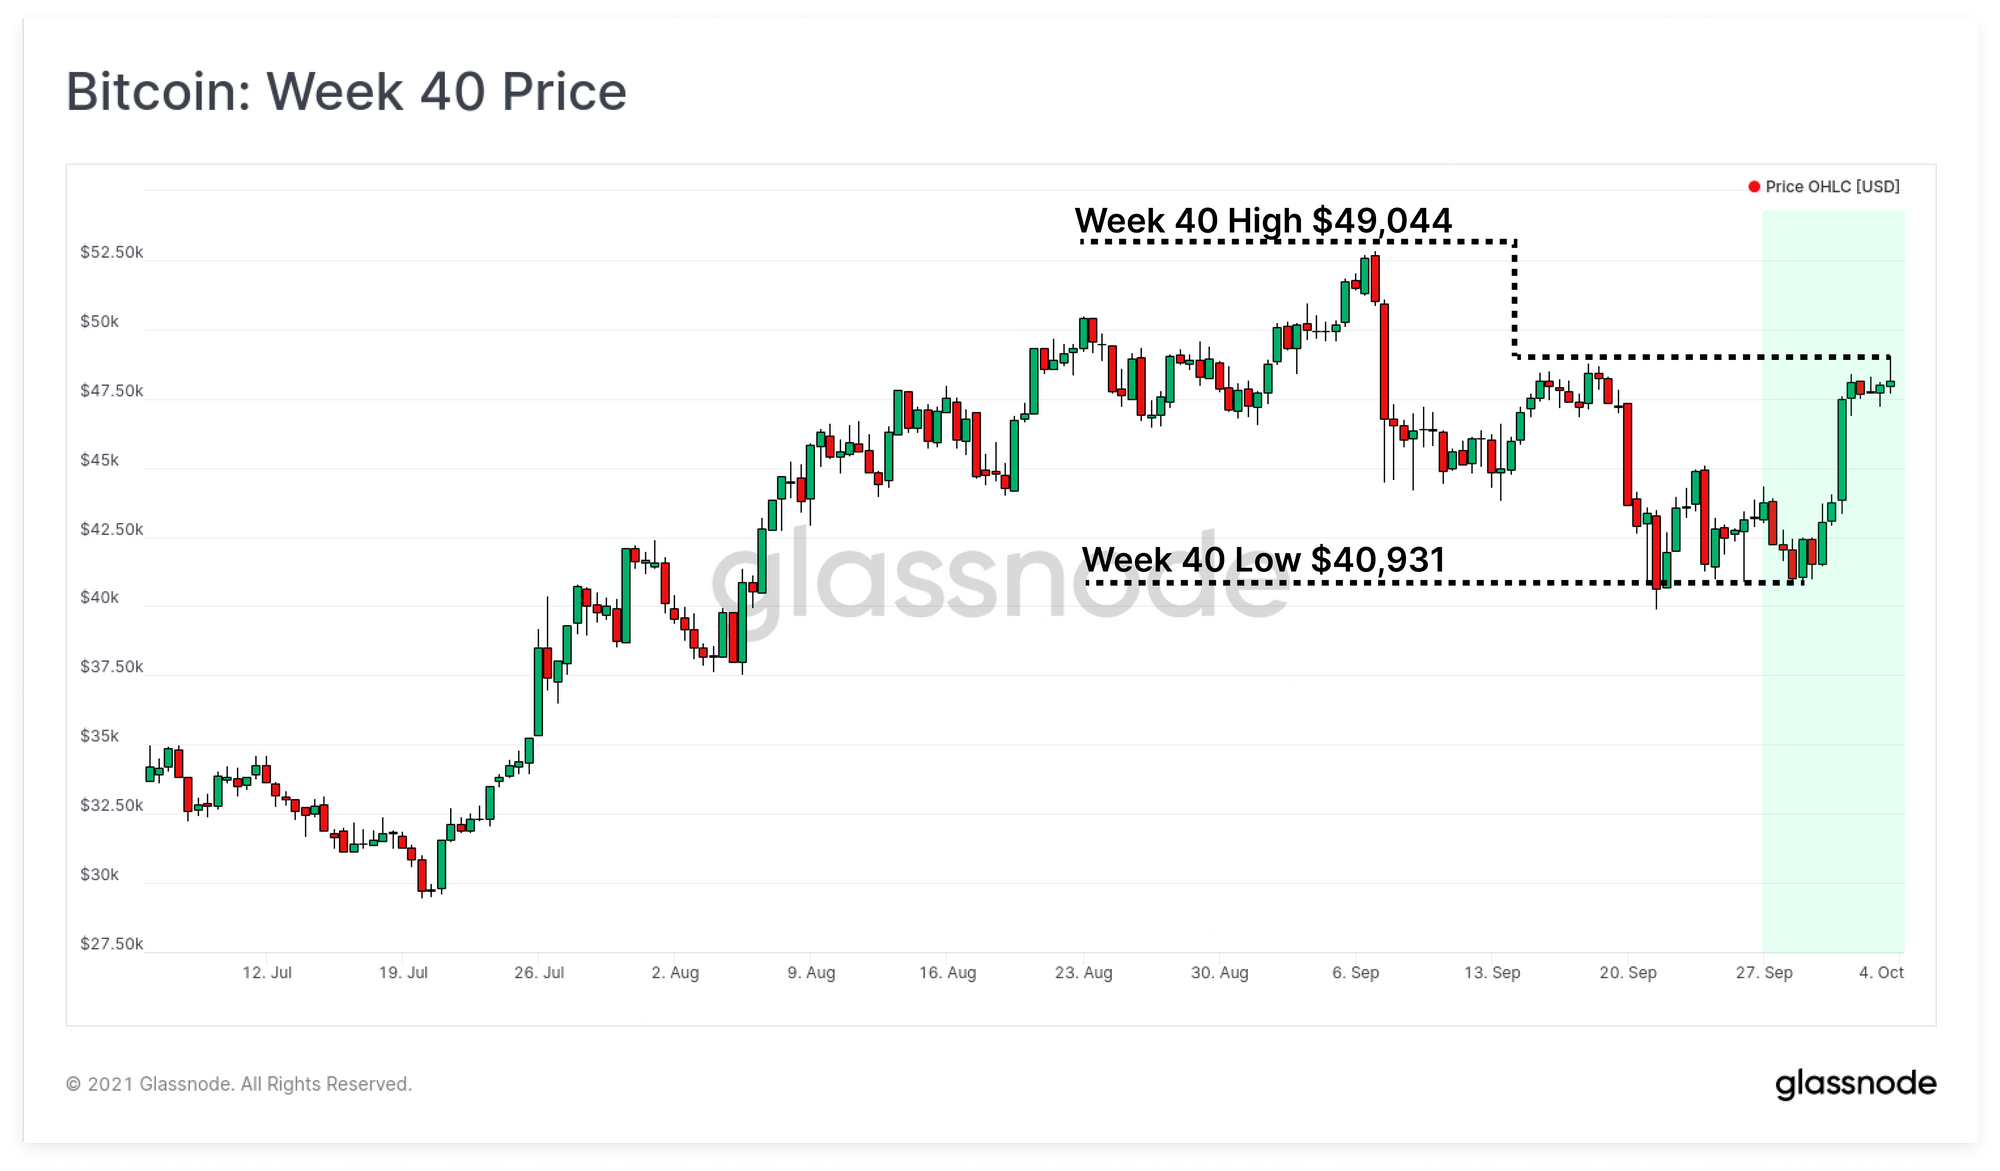
The Bitcoin market has rallied strongly this week, breaking out of the recent consolidation range low of $40,931, and peaking at $49,044 over the weekend. After a fairly brutal September, this rally has brought with it renewed optimism for the last quarter of 2021.

Similar to our observation during the rally in late July, a non-trivial volume of BTC changed hands during the recent consolidation trading range. We can see this via inspection of the coin volume which has now returned to holding an unrealised profit. This week we will analyse this return to profitability and how the fractals compare to previous market cycles. We will also look into the mining market which continues to recover after the Great Migration commenced in May.


Week On-chain Dashboard

The Week On-chain Newsletter now has a live dashboard for all featured charts here. We have also started production for Week On-chain video analysis to provide a deeper dive into the thesis and logic behind each weeks analysis. Visit and subscribe to our YouTube channel, and visit our Video Portal to see our video content.


Return to Profitability

In on-chain analysis, we generally consider coins that are spent (especially for entity-adjusted variants) to have changed hands, as existing coin holders sell, and new buyers take possession. When prices consolidate in a range for an extended period, and a large volume of coins transact on-chain, this can be considered as zone of accumulation. As such we can consider this an established cost basis for many buyers.

As prices rally above this trading range this week, approximately 10.3% of the circulating supply returned to an unrealised profit. We can therefore deduce, that alongside the $29k to $40k range in May-July, the recent lows of $40k to $41k represented a significant 'value add' zone for buyers who stepped in and purchased to set a price floor. A total of 86.6% of all circulating BTC are currently held at an unrealised profit.

Supply in Profit Live Chart

If we inspect the breakdown of profitability between Long- (LTH) and Short-Term (STH) Holders we can see that overall, STHs benefited the most from this rally. Around 15.6% of the BTC supply is currently held by investors who purchased within the last ~155-days and are at an unrealised profit.

LTHs in profit currently hold 73.4% of the supply, leaving a remaining 11% of coins held at a loss (split 31:69 STH:LTH). As a larger portion of the market return to profit, it creates incentives for some investors to take profits, but also can recover conviction to hold onto their winners.

Relative LTH-STH Supply Live Chart

The magnitude of net unrealised profit has also reached an interesting milestone, bouncing off a NUPL value of 0.5. This indicates that the total unrealised profit held in the coin supply is equivalent to approximately 50% of the market cap (approximately $450B in global unrealised gains).

If the market were to continue to trend higher and into a bullish continuation, this fractal would be similar to both the 2013 and 2017 market. In both prior cycles, a NUPL value of 0.5 acted as a 'support' level during major corrections as the market's profitability and conviction to hold was tested, bounced and subsequently rallied higher.

Conversely, falling below 0.5 again could potentially trigger more coin holders to spend coins in fear of seeing their unrealised profits diminish further.

NUPL Live Chart

On-chain Spending Behaviour

As the market rallies higher, it is valuable to observe the various cohorts who are transacting on-chain to establish a case for both capital inflows, outflows, and aggregate market sentiment.

This week saw a marked decline in investors spending coins that were held at a loss. Realised losses fell to a multi-week low of around $175M per day. On the other hand, realised profits rose sharply to $996M/day. These observations are likely a function of:

  • More coins returning to profit overall (discussed above)
  • Profits taken by traders who bought the recent lows
  • Investors who may have bought the March-May top 'getting their money back' closer to, or just above their cost basis.

Given the market continued to hold most of the weeks gains, this also indicates that around $1.75B worth of capital is flowing into the market as buy side demand per day.

Realised PnL Live Chart

The structural downtrend on old coin volume dominance continues this week, reaching a multi-year low of around 2%. In the pre-bull phase of 2019-20, old coin volume represented around 4% of all volume moved on-chain as a baseline. This spiked in late 2020 and early 2021 as long term investors took profits in the bull market.

With old coin dominance at multi-year lows, is suggests two dynamics are at play:

  • Old Hands have strong conviction and are not spending at current prices.
  • Young coin dominance is at multi-year highs which indicates the same liquid supply is transacting and likely being absorbed by new buyers (as noted in net capital inflows from the previous chart).
Spent Volume Age Bands Live Chart

Breaking down the on-chain volume by transaction size, we can also see that very large transaction sizes ($10M+) continue to dominate. Overall entity-adjusted transaction volumes have largely returned to the peak of between $13.6B and $16.8B per day. The rising dominance of large transaction sizes hints to the increased maturation of Bitcoin as a macro scale asset with increasing interest from high net worth individuals, trading desks, and institutions.

Transaction Breakdown by Size Live Chart

On the spending behaviour of Long-term Holders, the overall profitability of spent coins has fallen to relatively low levels. LTH-SOPR has returned to a value of 2.0 which indicates that spent coins have a profit multiple of around 200% (i.e. aggregate cost basis of $24k for coins spent at $48k).

As a longer term cyclical metric, the LTH-SOPR usually trades in this range during late stage bear markets, and early stage bull markets. This is a result of lengthy sideways price action which compresses profit multiples, even for longer-term investors.

LTH-SOPR Live Chart

For Short-Term Holders, we also have relatively constructive signals, with the STH-SOPR metric rallying back into profitability. In bullish market structure, a return of STH-SOPR to a value of 1.0 generally suggests:

  • STHs have stopped taking profits, else the metric would trend higher. This suggests conviction to hold remains.
  • Some STHs are panic selling and realising losses, often pushing STH-SOPR slightly below 1 during price pull-backs.

As a result, a SOPR value of 1.0 usually indicates market support, which in this case has played out. A return to profitability alongside positive or sustained price action indicates that sufficient demand is present to absorb spent coins, providing confluence to many of the charts discussed above.

STH-SOPR Live Chart

Weekly Feature: Mining Recovery

The Bitcoin mining industry experienced the most dramatic short term disruption in all history, with over 50% of the network hash-power coming offline throughout May. Despite this massive impact to its industrial base, the Bitcoin hash-power network has been on a consistent path to recovery every since.

After bottoming out in late July, protocol mining difficulty has risen by 39%, with a further additional upwards adjustment of around 3.9% expected this week. Mining difficulty has now returned to last 2020 levels, requiring around 80 sextillion hashes to solve a block (that is 8 followed by 22 zeros!).

Difficulty Live Chart

The Difficulty ribbon is also about to flip over and signal full recovery, as the slowest 200-day moving average crosses over the fastest 9-day moving average. The only comparable difficulty ribbon flip to the current market was following the December 2018 bear market capitulation event that took prises down 50% to $3k.

The 2018-19 mining recovery took a total of 164-days to completely reverse the bearish difficulty ribbon signal. The current market has been in recovery for 120-days and is likely to complete the flip after the next upwards difficulty adjustment.

Difficulty Ribbon Live Chart

Finally, we can look to miner total revenues to assess overall income for the mining industry. Despite a 50% reduction in the block-subsidy from 12.5 BTC/block to 6.25 BTC/block in May 2020, total USD miner revenue is up significantly.

Remember, miners have CAPEX (hardware, facilities, logistics) and OPEX (power, personnel, maintenance etc) costs that are denominated in fiat currencies. Comparing the current aggregate mining income of $40M per day to revenues observed around the 2020 halving event, we can see that miner revenues are up:

  • +275% since the pre-halving period of $14M to $18M/day
  • +630% compared to the post-halving period of $6M to $8M/day

Despite dramatic shifts in the mining market, multiple deep price corrections, and a halving event in May 2020, the Bitcoin block reward value continues to rise, creating incentives for the market to adapt, innovate and recover. Quite incredible really.

Mining Revenue Live Chart

Product Updates

Metrics and Assets


Disclaimer: This report does not provide any investment advice. All data is provided for information purposes only. No investment decision shall be based on the information provided here and you are solely responsible for your own investment decisions.