The Week Onchain (Week 41, 2021)

Underlying on-chain fundamentals continue to paint a bullish picture for Bitcoin, as leverage and futures premiums increase in derivatives markets.

The Week Onchain (Week 41, 2021)

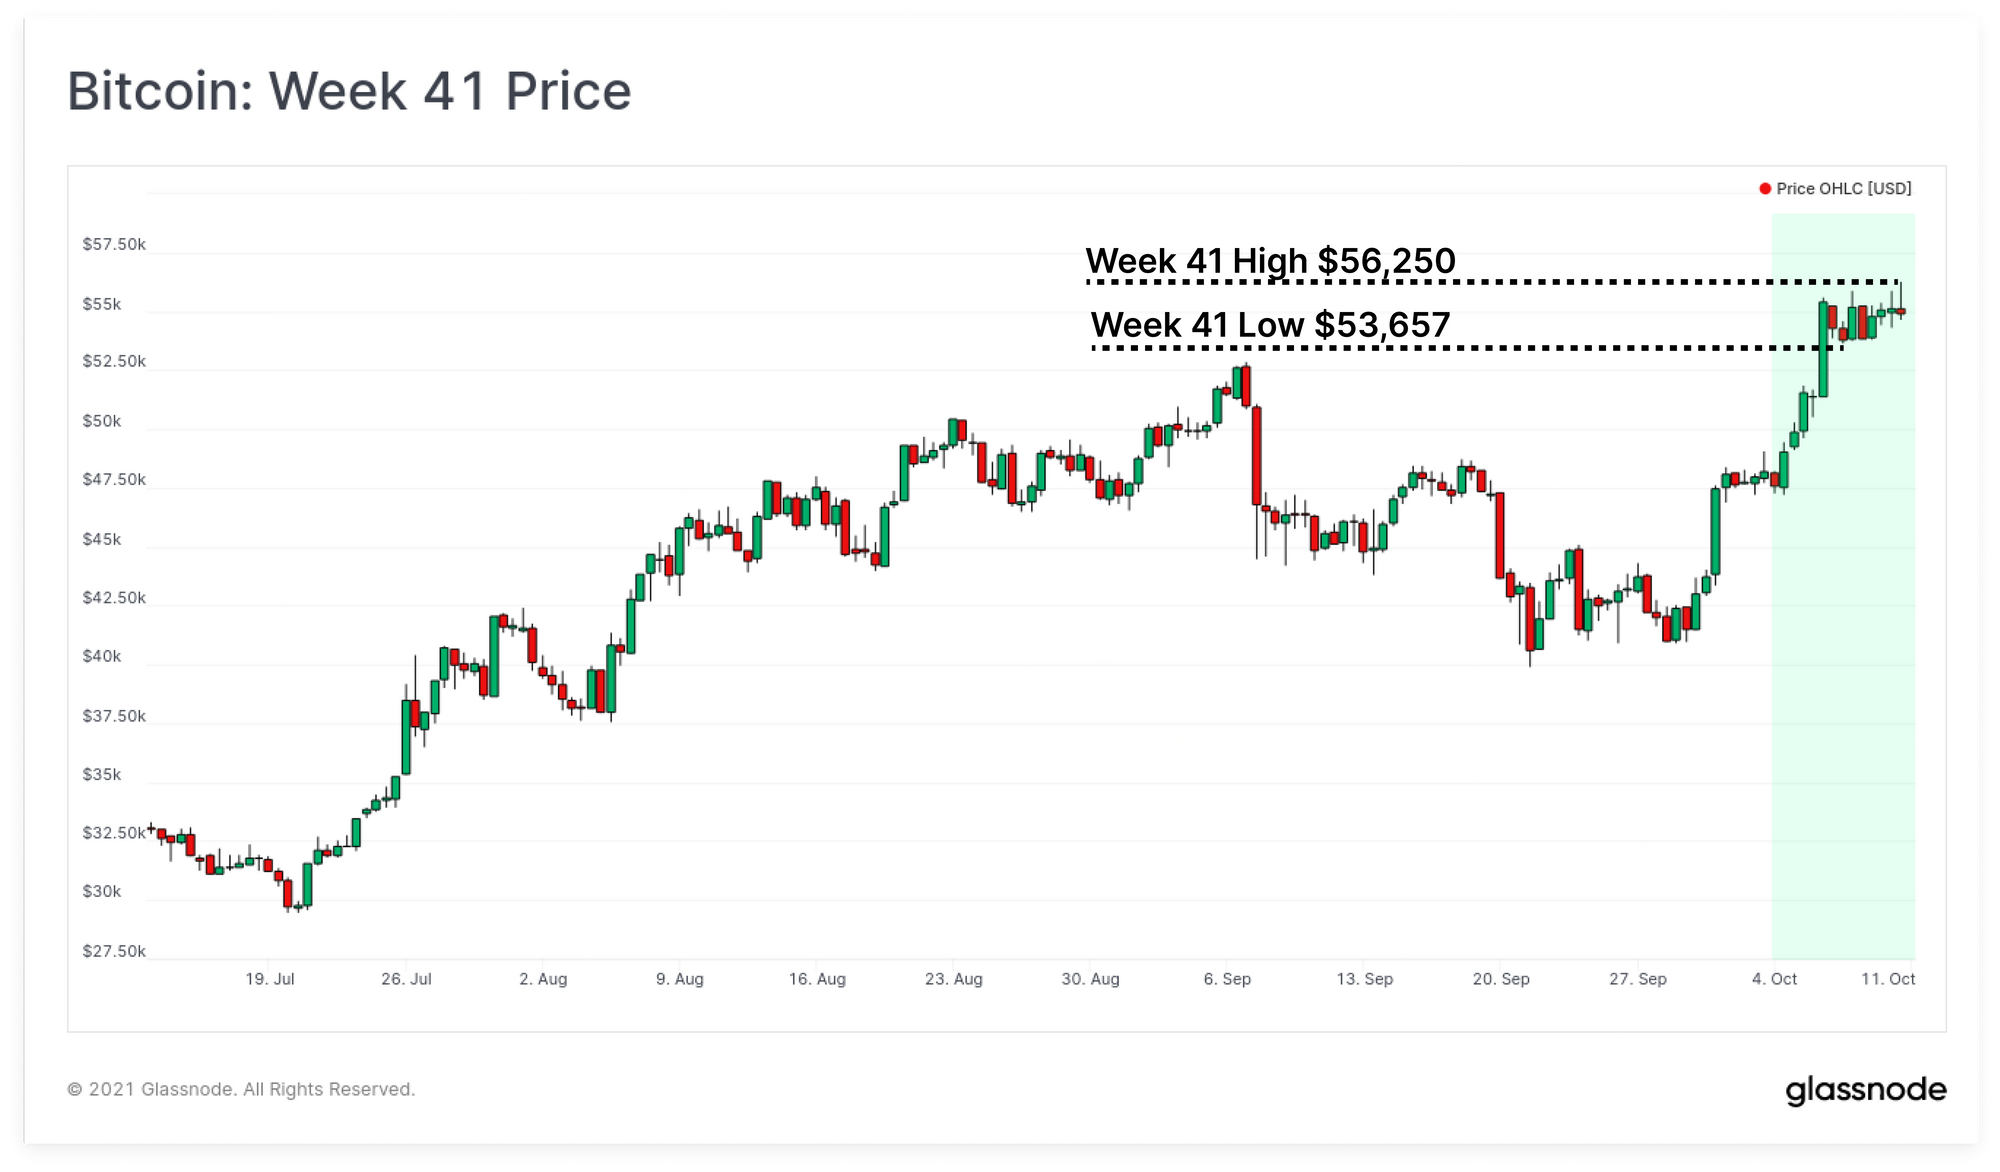
The Bitcoin market has continued to show strength this week, with prices trading within a tight consolidation range, with a low at $53,657, and a high of $56,250. Following an impressive rally from the September lows, the market has managed to hold onto the gains whilst on-chain activity has commenced a welcome climb higher.

This week we analyse the increased leveraged creeping into derivatives markets, the impressive growth of long-term holder supply, and the recent elevation of on-chain activity. Across many facets of the Bitcoin market, signals continue to paint a constructive view for prices, and market sentiment remains positive.


Week On-chain Dashboard

The Week On-chain Newsletter now has a live dashboard for all featured charts here. We have also started production for Week On-chain video analysis to provide a deeper dive into the thesis and logic behind each weeks analysis. Visit and subscribe to our YouTube channel, and visit our Video Portal to see our video content.


On-chain Activity Climbs Higher

The first week of October has experienced a long awaited boost in network activity, increasing the probability that new demand is beginning to enter in the fourth quarter of 2021.

Active Entities, the count of individual participants on-chain each day, has grown 19% to this week, reaching around 291k active entities per day. This value is on par with counts from late 2020 at the beginning of the last bull run. More active market participants has historically correlated with growing interest in the asset during early stage bull markets.

Link to live chart

Along with an elevated number of market participants, the typical coin value of transactions has also increased. Since mid September, the median transaction size has risen to over 1.3 BTC. The last time the Bitcoin network saw a median transaction size above 1.6 BTC was March 2020 during the liquidity crash.

An increased typical transaction size is not synonymous with price appreciation, but indicative of larger and even institutional sized capital flows present on-chain. Generally speaking, periods near the end of bear markets are when smart money start to accumulate in size. These periods are often characterised by lower (but rising) on-chain activity and increasingly large transaction sizes.

Link to Workbench chart

The dollar value of volume moving on-chain has also increased to meaningful levels. By viewing Transfer Volume (USD) as a percentage of the Realized Cap, we can directly compare network activity to the value 'stored' in the asset. The chart below presents 'Realized Velocity', calculated as a ratio between USD denominated on-chain transaction volume, and the Realized Cap. This gives a sense of the level of demand volume relative to the value of the coin supply valued at the time it was last spent on-chain.

  • Transfer Volume greater than 3% of Realized Cap typically marks the beginning of a bullish market phase as network utility increases relative to realized valuation.
  • Transfer Volume less than 3% of Realized Cap indicates a more bearish phase where network utility is low or declining relative to the realized valuation.

Transfer Volume has once again broken above the 3% threshold suggesting growing demand for on-chain settlement of value. This is a bullish a development worth watching in the coming weeks based on its high historical signal.

Link to Workbench chart

Long-Term Holders HODL On

To further support the constructive increase on-chain activity, the supply held by Long-Term Holders (LTH) is showing no signs of slowing down. LTHs distributed coins from October 2020 through to March 20201 where their held supply bottom out at 10.91M BTC.

Over the last 7-months, HODling behaviour has dominated and over 2.37M BTC have migrated across the Short-to-Long Term holder threshold (~155days). To put this into context, only 186k BTC have been freshly mined in that same period, meaning LTHs have HODLed 12.7x more coins than have been mined on average.

LTH Supply Live Chart

Using the Workbench tool, we can quantify the magnitude of LTH accumulation relative to current coin issuance to miners. Here we take the ratio between the 30-day change in LTH supply (blue), and the 30-day change in circulating supply (orange, equals total issuance).

This ratio is shown in pink below and represents the multiple of monthly coin issuance that is being accumulated/HODLed (+ve) or distributed (-ve) by LTHs. February 2021 shows that LTHs distributed heavily, reaching 26.4x the number of mined coins. Conversely, June was an all-time-high of relative accumulation, reaching 27.7x issuance.

Since July, LTH accumulation/HODLing has been quite consistent between 13.6 and 15.0x issuance indicating the number of coins taken out of circulation are significantly more than are being newly minted.

Live Workbench Chart

Further corroborating evidence for this observation is the Revived Supply 1yr+ metric which presents the volume of 1yr+ old coins that are spent each day.

  • During bull markets, it is typical to see LTHs distribute into market strength which eventually puts in a local or global top when supply overwhelms demand (uptrend, pink).
  • After global tops are established, LTHs slow spending and await cheaper prices to recommence accumulation (downtrend, blue)
  • When prices reach 'value zones' smart money investors start to accumulate which is characterised by low, baseline levels of revived supply as older coins remain dormant and young coins change hands (sideways, green)

In the current market structure, revived supply suggests the market remains in a relative accumulation zone, with low volumes of revived supply coming back into liquid circulation.

Revived Supply Live Chart

Alongside higher prices, a very large portion of the UTXO set have also returned to profit, reaching 95.7% of all UTXOs. This is an uplift of around 11.3% since the September lows. Note also that whilst the market correction since May was deep, it did not result in the proportion of UTXOs in profit falling to the extreme lows of 40% to 60% seen in the 2018-19 bear, or in March 2020. Note also that in strong bull markets, UTXOs in profit can maintain values above 90% for many months at a time.

UTXOs in Profit Live chart

Leverage Creeps Back Into Derivatives Markets

The positive sentiment and constructive price action has also started to be reflected in derivatives markets with climbing open interest, healthy contango in futures markets, and rising perpetual swap funding rates. Futures open interest has risen by $5.6B (+45%) since the lows in September. Note that this magnitude of open interest is similar to that in early September, and in mid-May, both of which preceded significant long squeezes.

Futures Open Interest Live chart

Constructive future prices can also be seen in the futures term structure, where the consensus price ranges across exchanges are highlighted in blue below. Through to the end of the year, traders on most exchanges (excl. Huobi) are pricing Bitcoin at approximately $58.5k (a 12.4% annualised premium). Traders on FTX and Huobi are currently the outliers for March 2022, trading at a $800 premium, and a $3.1k discount respectively, to the consensus price of around $60.1k.

Futures term Structure Live chart

The 3-month annualised futures basis has also traded higher throughout October, rallying up to +12.4% this week. May-July was a particularly bearish period where futures markets were pricing in only a +2% to +5% annualised premium 3-months out. The premium in late-September returned to this +5% low and accompanied relatively bearish market sentiment. However, such relatively low futures basis has shown to be a strong indicator for a counter trend rally in 2020 and 2021.

Futures 3-month Basis Live Chart

Perpetual swap markets are also growing increasingly bullish over the last week, with funding rates trading between +0.01% and +0.02% across all exchanges. At the time of writing, funding rates are declining towards the lower end of this range, which suggests that perhaps traders are taking on leverage, however in a more controlled manner to previous periods. However, the probability of short-term volatility lead by a long squeeze does increase alongside elevated funding rates and climbing open interest and is a risk to pay attention to.

Perpetual Funding Rate Live Chart

To close, we will look at options markets which are also seeing an expansion in open interest, rising by $3.6B (+64%) through October so far. Options markets still represent a relatively small portion of trade volume (< $1B typical), however their growth reflects a maturity of the market, providing new avenues for hedging of risk, tools for miners and traders to capture volatility premiums, and vehicles for price speculation.

Options open interest Live Chart

It is not uncommon for derivatives markets to see an influx of open interest, futures premiums, and positive funding rates alongside positive price action. Whilst this does increase the likelihood of a leverage squeeze, it must be viewed in combination with fundamental factors observed in spot markets and on-chain for a holistic view.

What we can see is that in many regards, the current constructive price action is supported by very healthy trends in accumulation, HODLing behaviour, and increases in on-chain activity and network utilisation.


New Glassnode Content

Following the Smart Money: A Study of Long-Term Holders

Last week we released a new research piece exploring the on-chain HODLing behaviour and spending patterns of Bitcoins strongest hands: the Long-Term Holders. In this piece we study the trends in LTH accumulation, distribution and how they can be used to characterise market cycles.

Read our analysis on Bitcoin Long-Term Holders here.

Read our Analysis here

Product Updates


Disclaimer: This report does not provide any investment advice. All data is provided for information purposes only. No investment decision shall be based on the information provided here and you are solely responsible for your own investment decisions.