The Week Onchain (Week 42, 2021)
Bitcoin breaks above $60k and approaches its all-time price high. Long-Term Holders begin to realise modest profits as Options volumes explode higher.


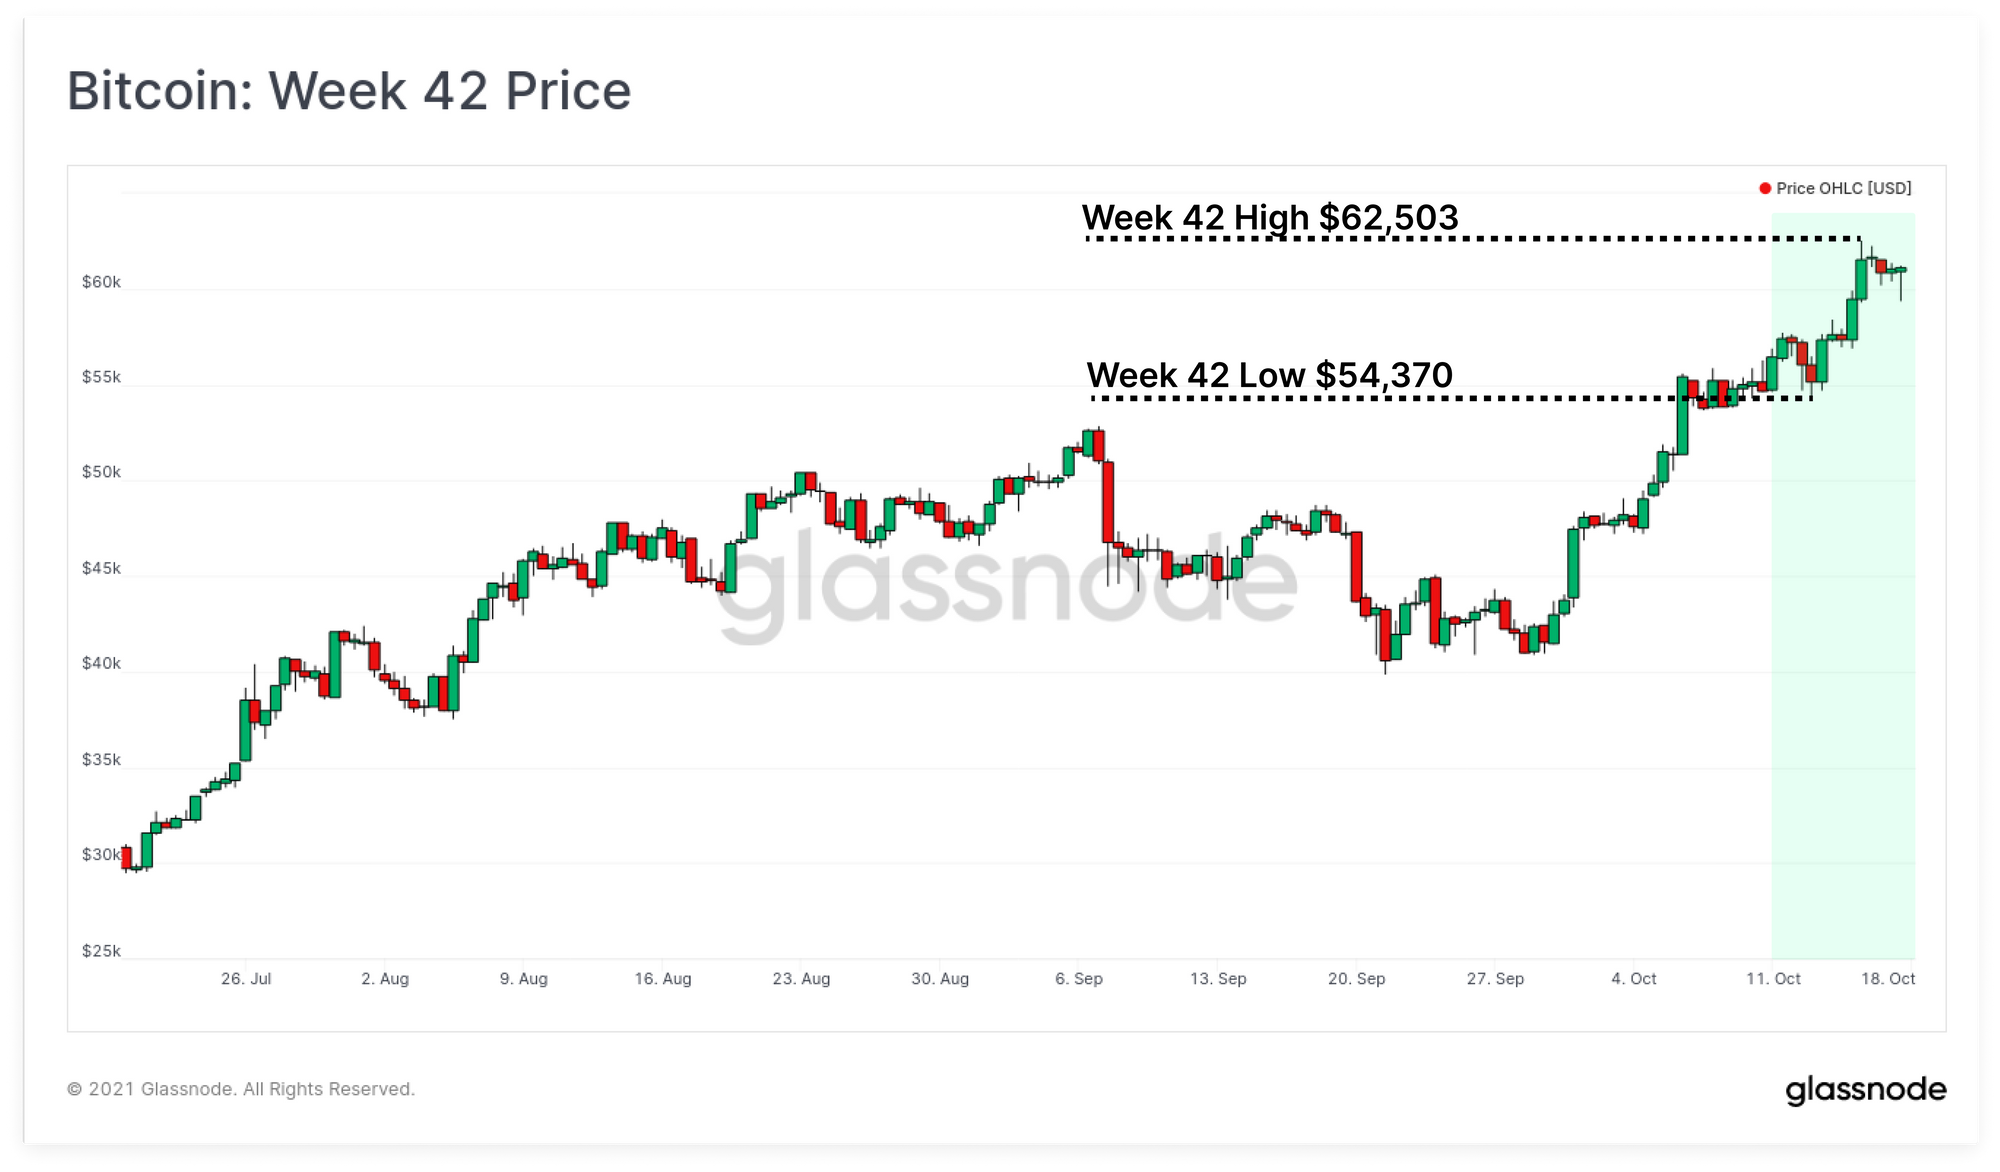
It has been an exciting week for Bitcoin investors as the SEC approves the first Bitcoin futures backed ETF product. The market continued to rally on the news from a low of $54,370 to a high of $62,503. At the weekly peak, prices were within $2,214 of the current all-time-high at $64,717.
The excitement in the market can be seen across a number of indicators and metrics, both in the on-chain spending patterns, and in derivatives markets. This week we explore what looks to be early signs of Long-term Holders realising profits, growing leverage in derivatives markets, and an explosion in options volume and open interest. The bulls are buying call options en mass, with preferred strike prices above $100k through to the end of the year.
Forum Product Release
Last week, we are proud to have launched Glassnode Forum, available for our Advanced and Professional accounts. Forum provides a venue to share ideas, discuss analysis and research, and connect with the brightest minds in on-chain and market analytics in long-form conversation.
Head over to Forum at forum.glassnode.com and read the User Guide here.

Long-Term Holders Start Realising Profits
To set the stage, we will begin to the URPD metric which presents the distribution of prices at which the circulating supply was last spent on-chain. At the time of writing, only 311.8k BTC were last moved at higher prices. Note also that the owners of these coins HODLed throughout all the ups, downs and volatility of the last 6 months and did not sell.
With only 1.66% of the supply held at an unrealised loss, this means 98.34% of coins are now held at an unrealised profit.
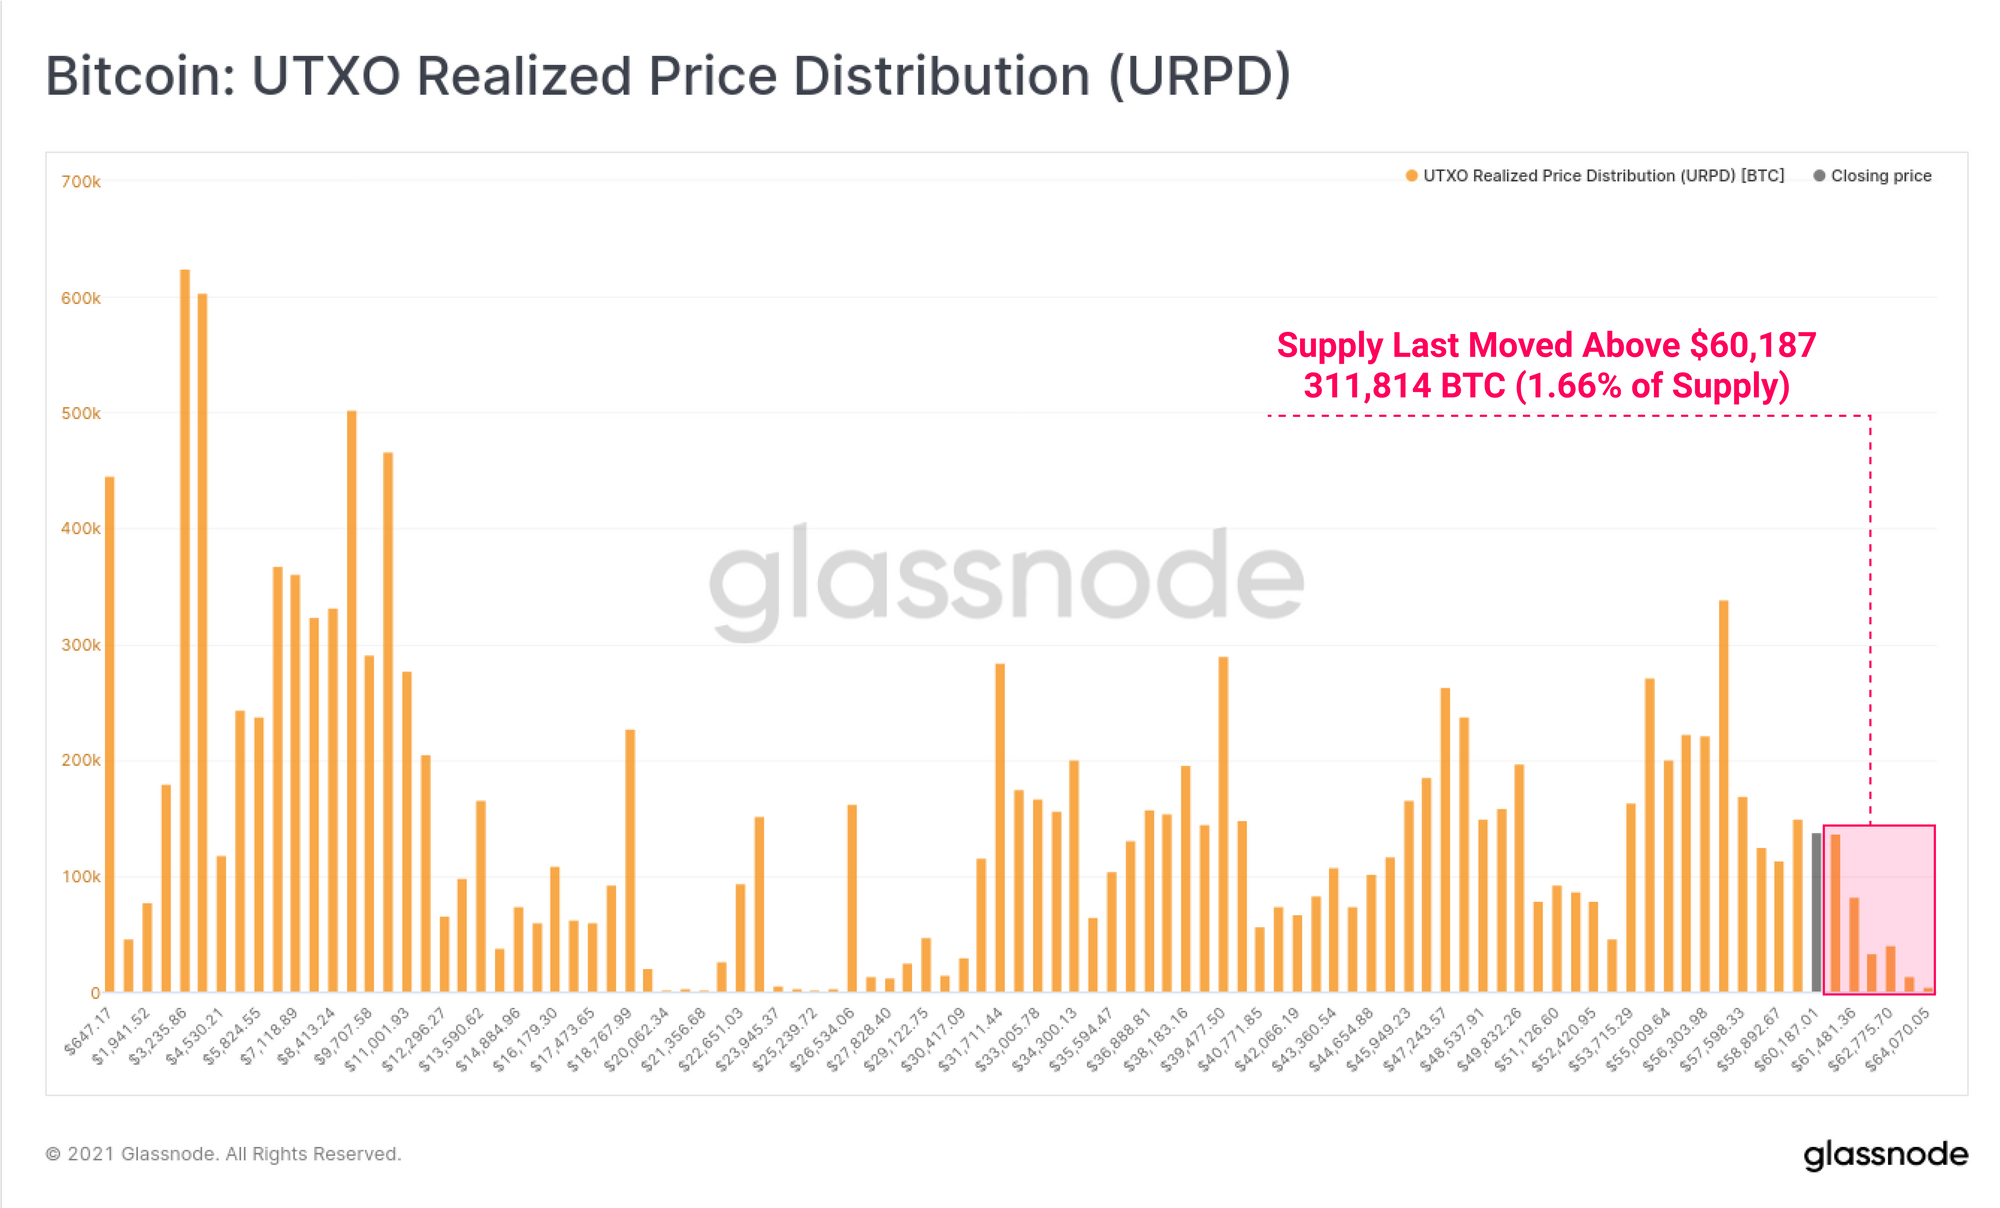
As the market pushes towards the ATH, and investors hold increasingly large unrealised profits, the incentive to sell is growing.
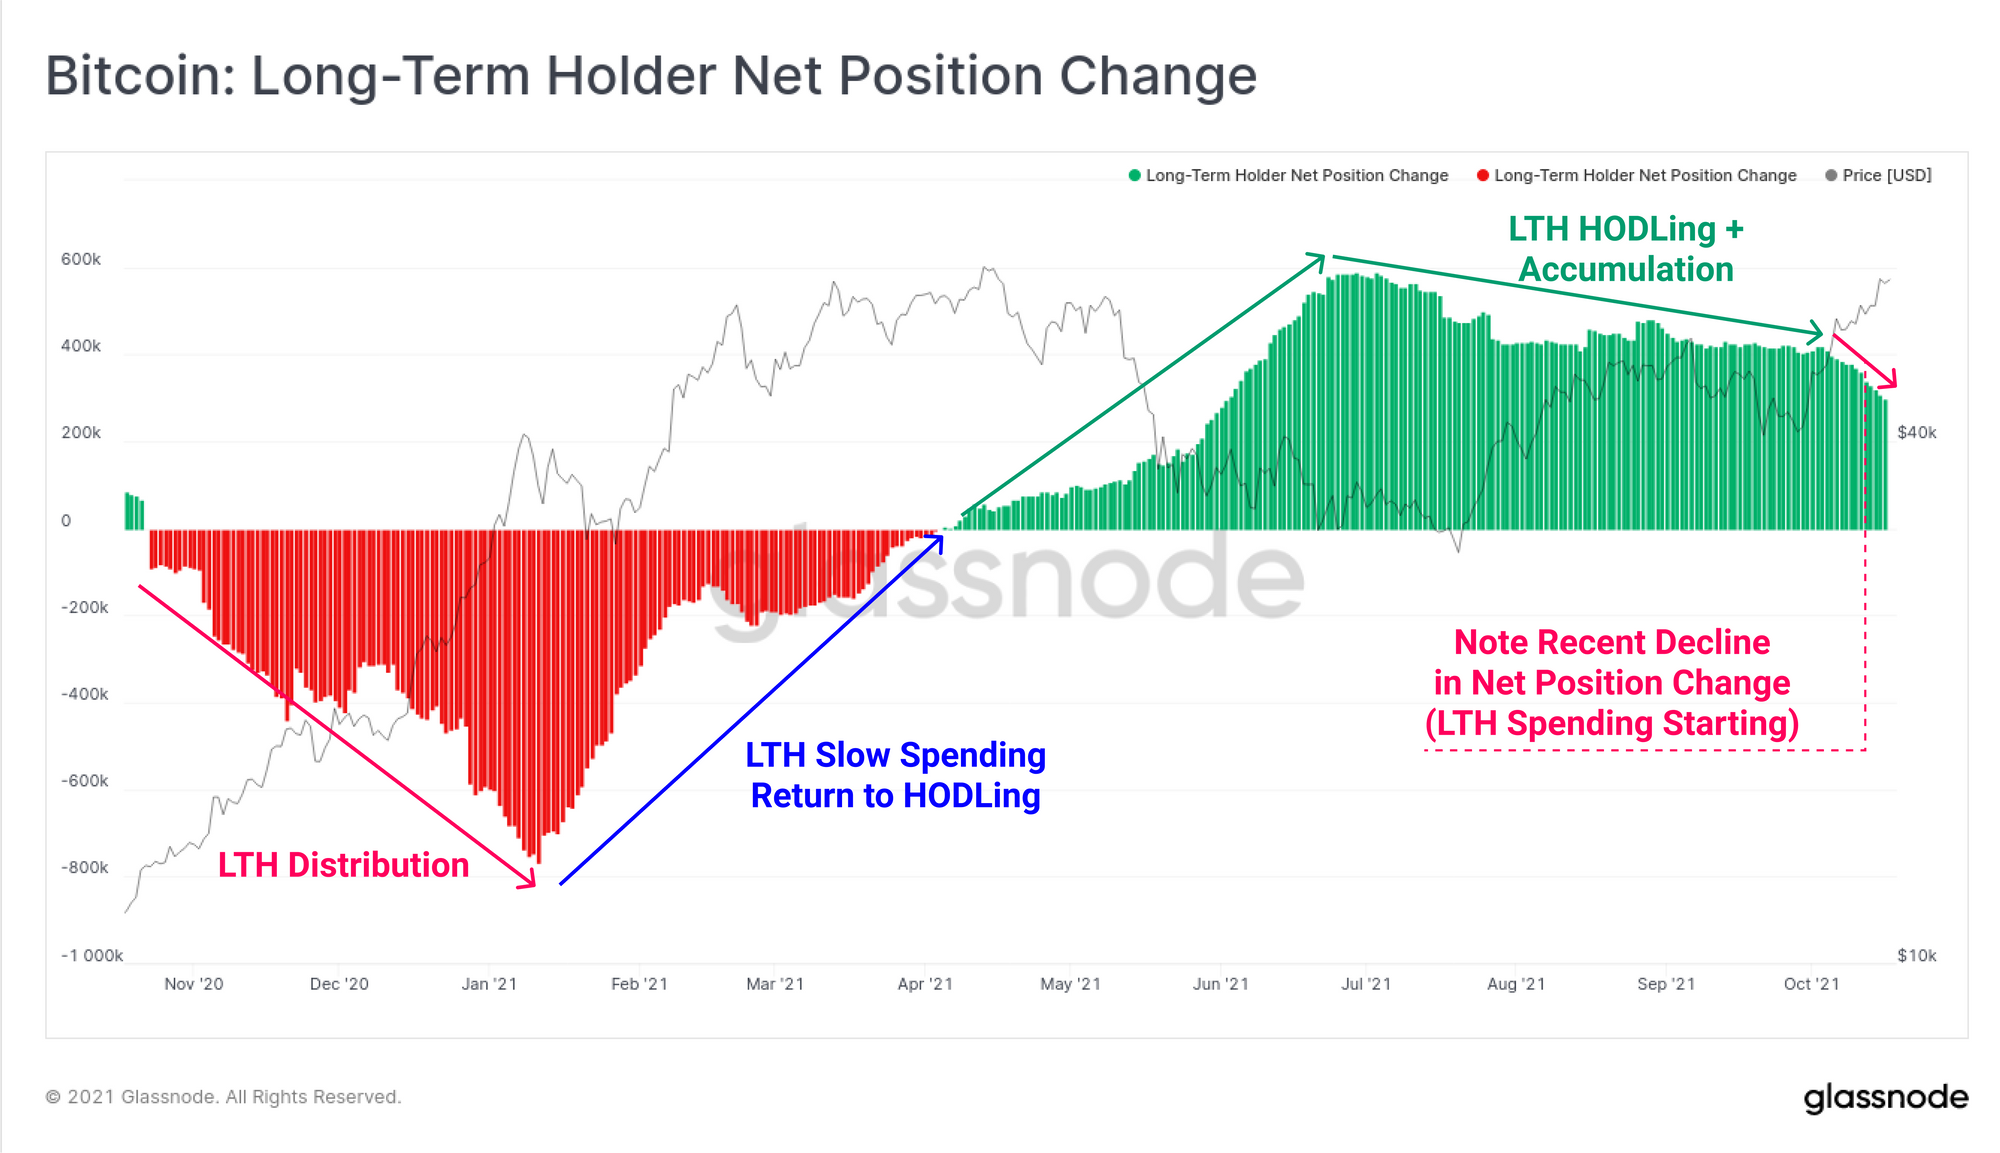
We recently released an article which explores the macro cyclical behaviour of Bitcoins strongest hands: the Long-Term Holders (LTH). These entities are classified as owners of coins that have been held for ~155-days or longer and are generally considered as the 'Bitcoin smart money'.
Typical on-chain behaviour of LTHs can be summarised as buying low (accumulation in a bear) and selling high (selling into bullish strength). The trend of LTHs increasing their spending of coins usually coincides with price breaking the previous ATH. Thus it is expected that this trend or more old coin spending will start to develop as market prices trade higher.
Over the past week, we can see a slight softening of the LTH net position change metric. This suggests a degree of LTH spending is occurring as prices rally above $60k.
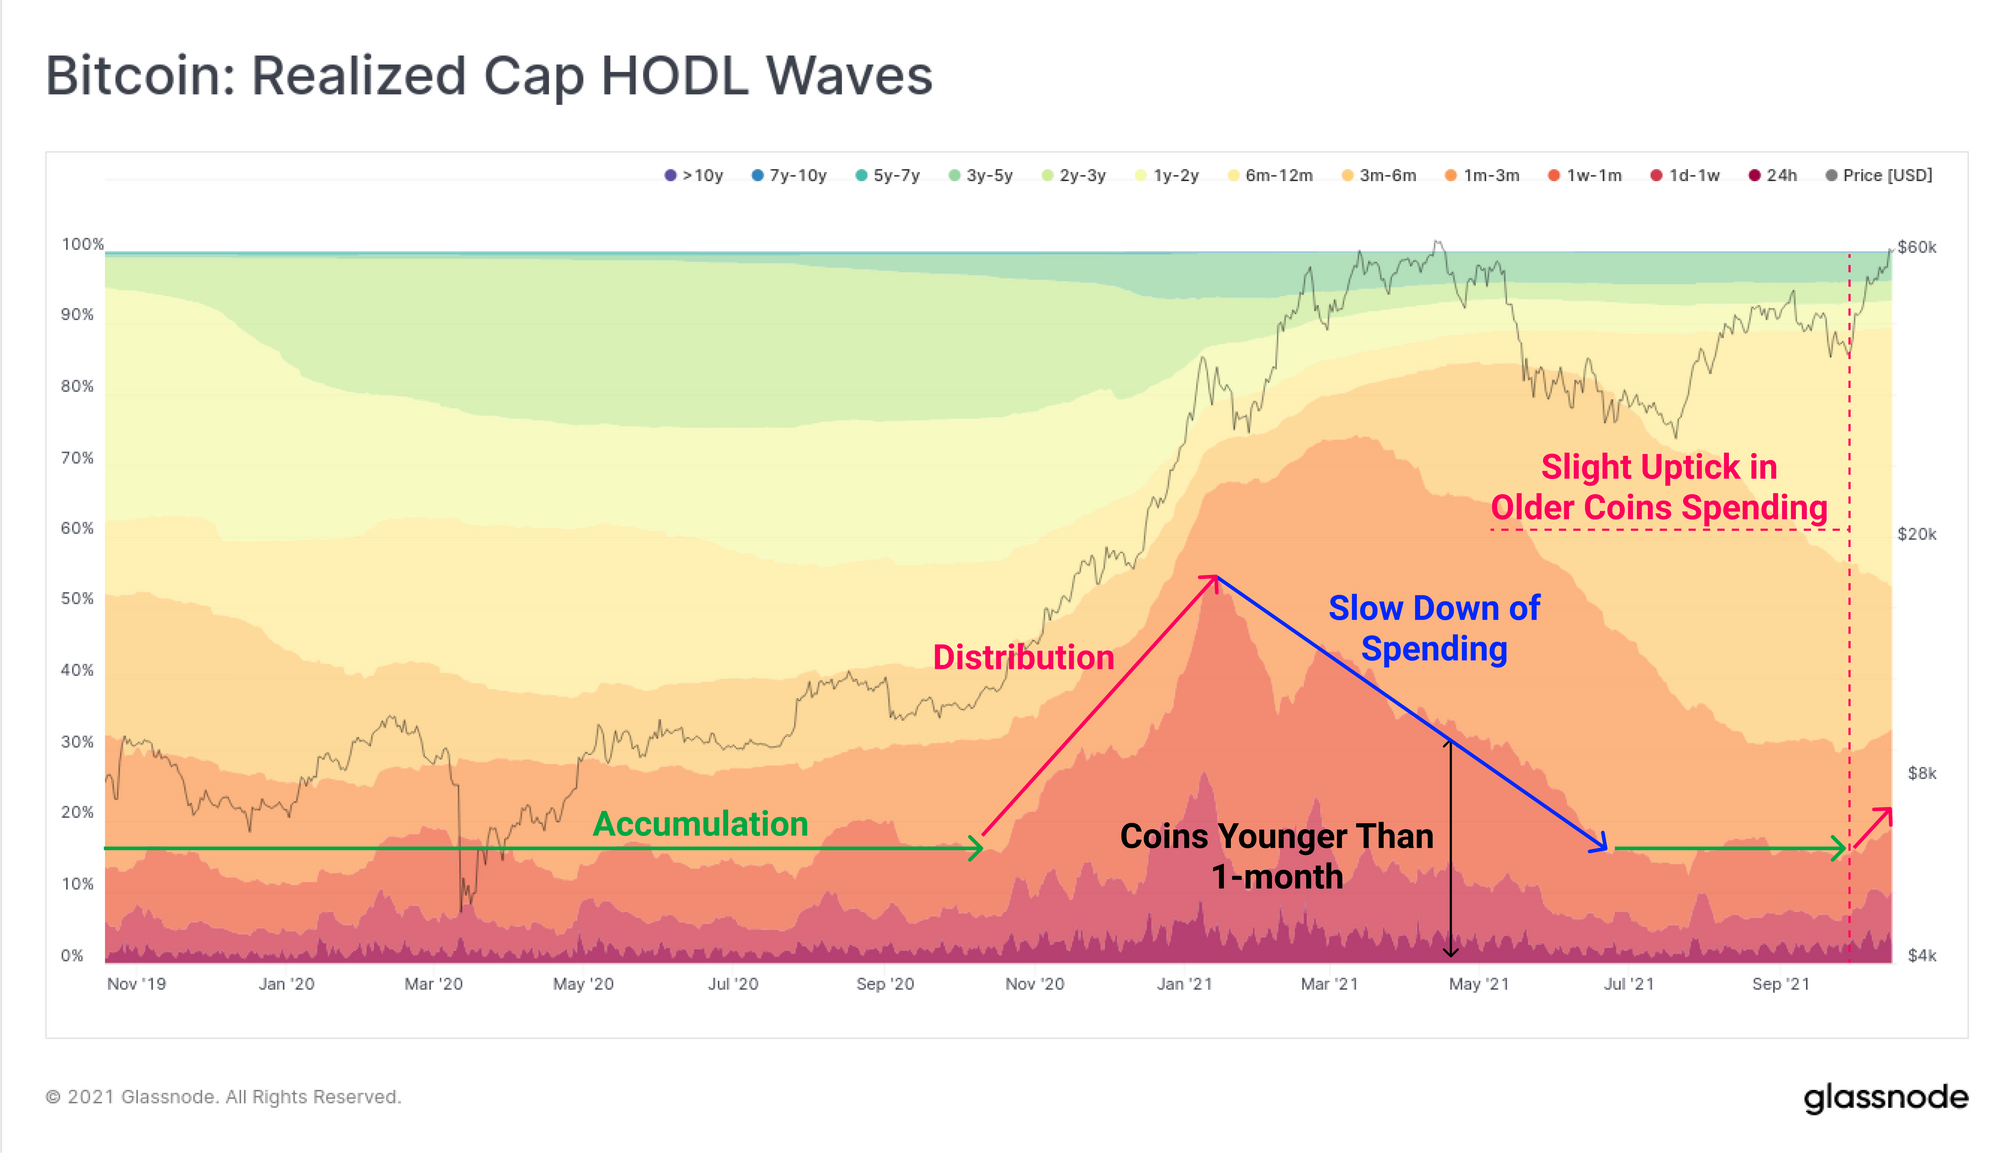
This spending behaviour has flowed into the Realised Cap HODL waves. This metric reflects the proportional realised value of coins categorised into age brackets.
Here we can see that the downtrend in young coins (< 1-month), which had persisted since February, has experienced a slight uptick this week. When younger coin bands thicken up, it can only be a result of older coins being spent, destroying their accumulated lifespan and, and assumed to be changing hands.
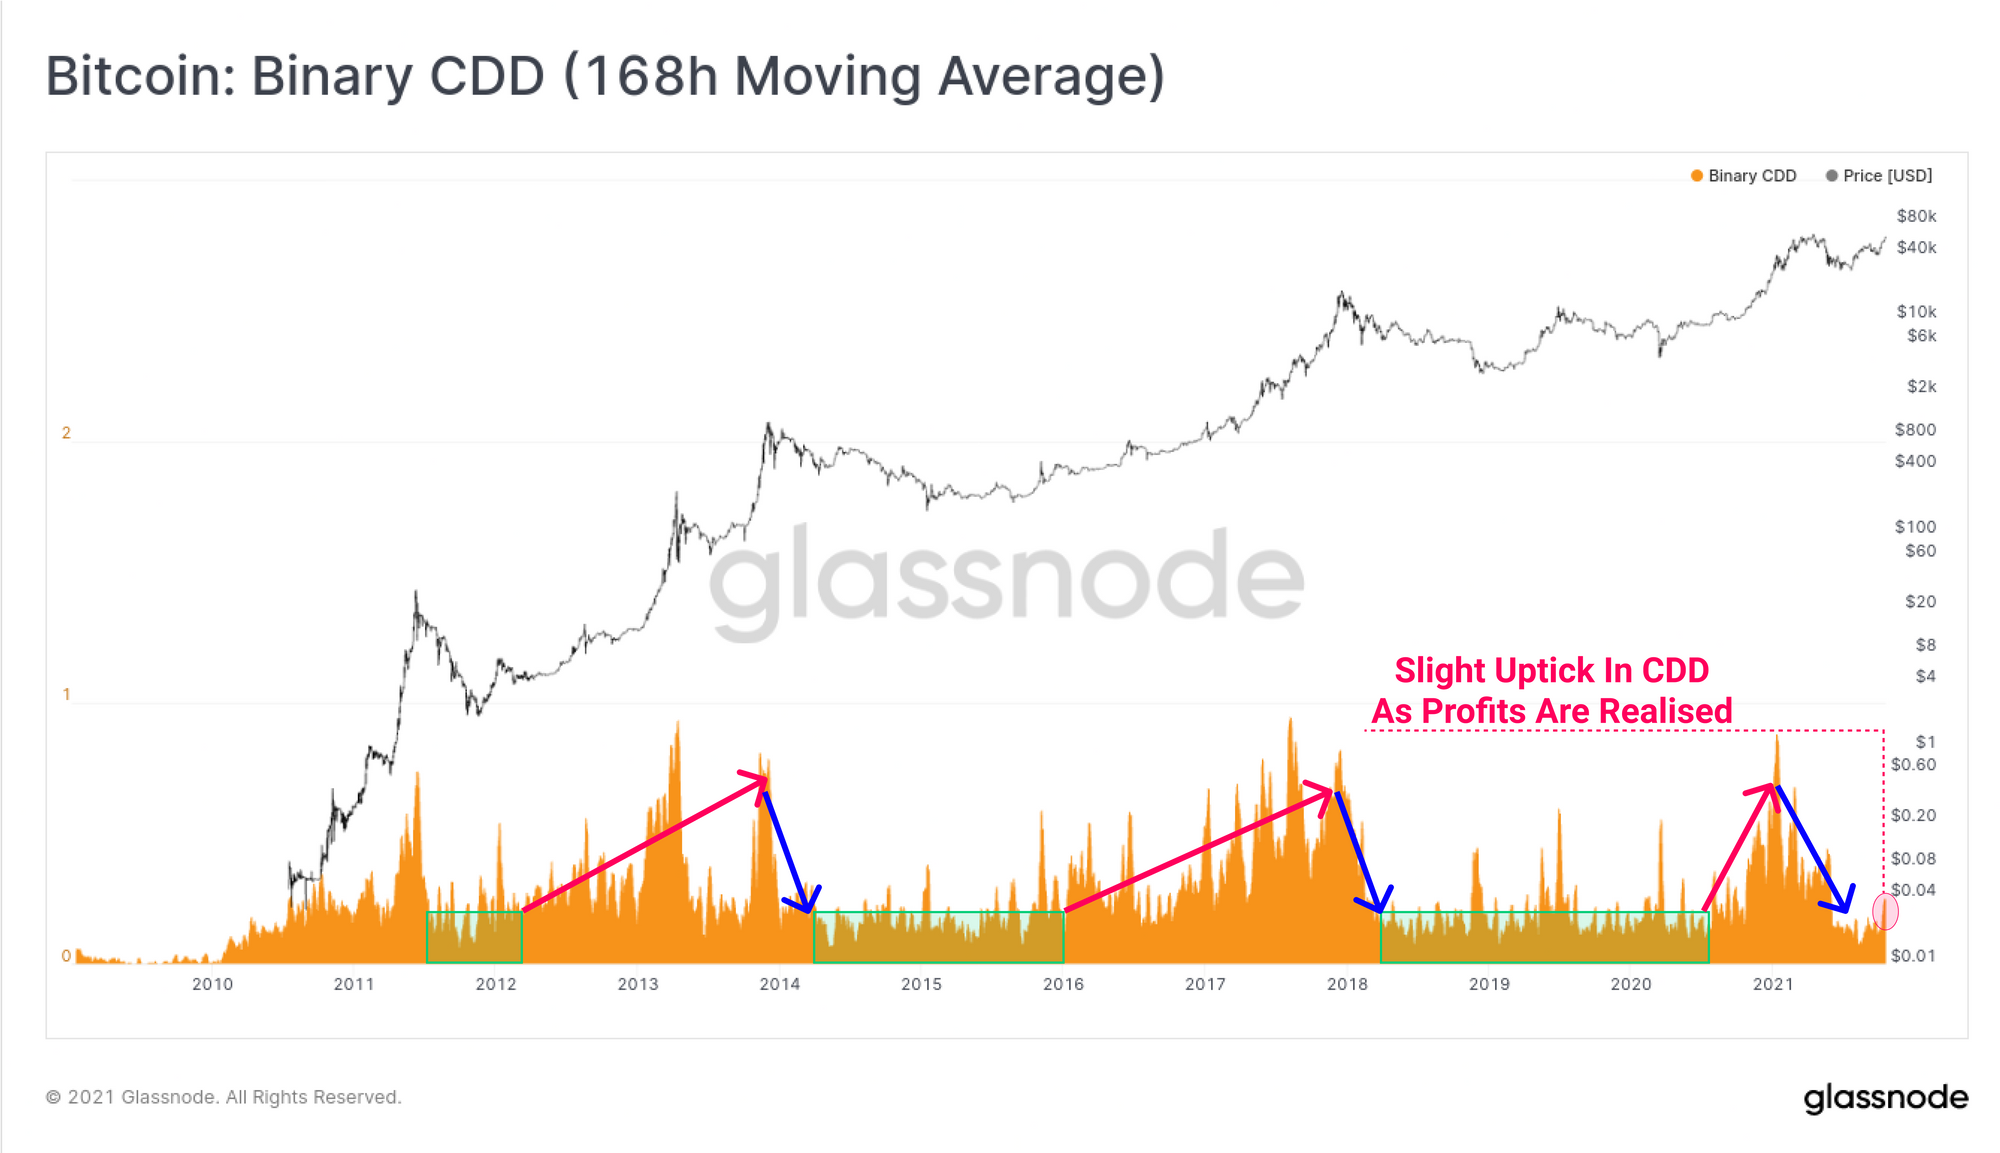
As volumes pick back up in the on-chain transaction space, we can again revisit the Binary Coin-days Destroyed metric. This metric has a 7-day moving average applied and is very useful for identifying trends of older coins being spent. General interpretation of this metric is:
- Low Sideways Values: Accumulation as old coins remain dormant
- Uptrends: As older coins are spent, usually distributing into market strength
- Downtrends: After market peaks as owners of older coins slow their spending and prepare for accumulation.
This week has seen a very early sign of an uptick on older spending, confirming that more coin-days were destroyed than the long term average. That said, bullish markets can often absorb many months of such distribution behaviour as is observed in all previous cycles.
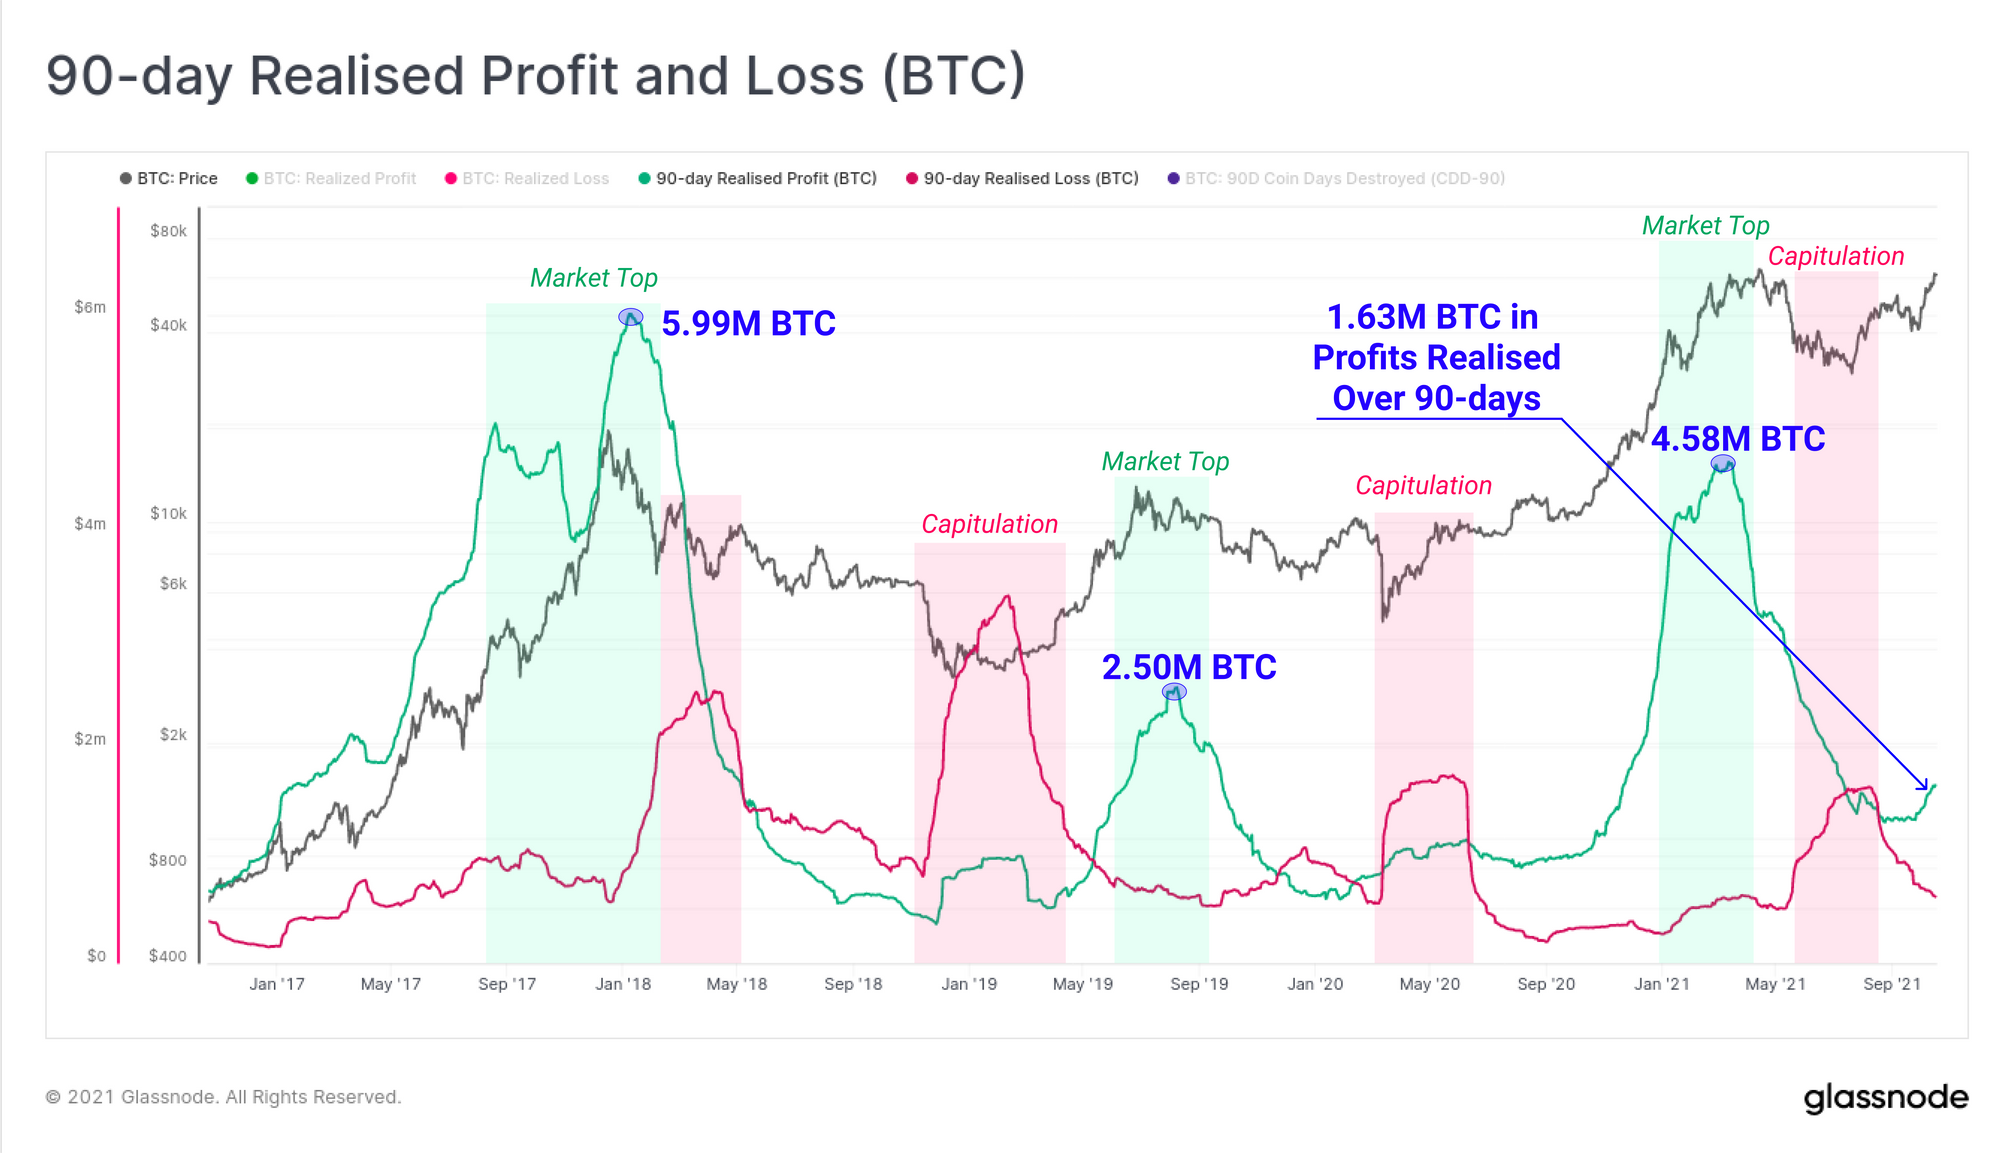
Using the Workbench tool, we can establish the BTC volume that has been spent, both realising losses and realising profits. The chart below plots out the 90-day sum of realised profits (green) and realised losses (red), both denominated in BTC.
Marked out are key macro shifts in sentiment and direction, such as market tops, and capitulation bottoms. Over the past 90-days, a total of 1.63M BTC worth of profits, and 676k BTC in losses have been realised (total of 2.3M BTC). Note that the realised profits metric remains significantly below the market tops in 2018 (5.99M BTC), 2019 (2.50M BTC) and most recently in Q2 2021 (4.58M BTC).
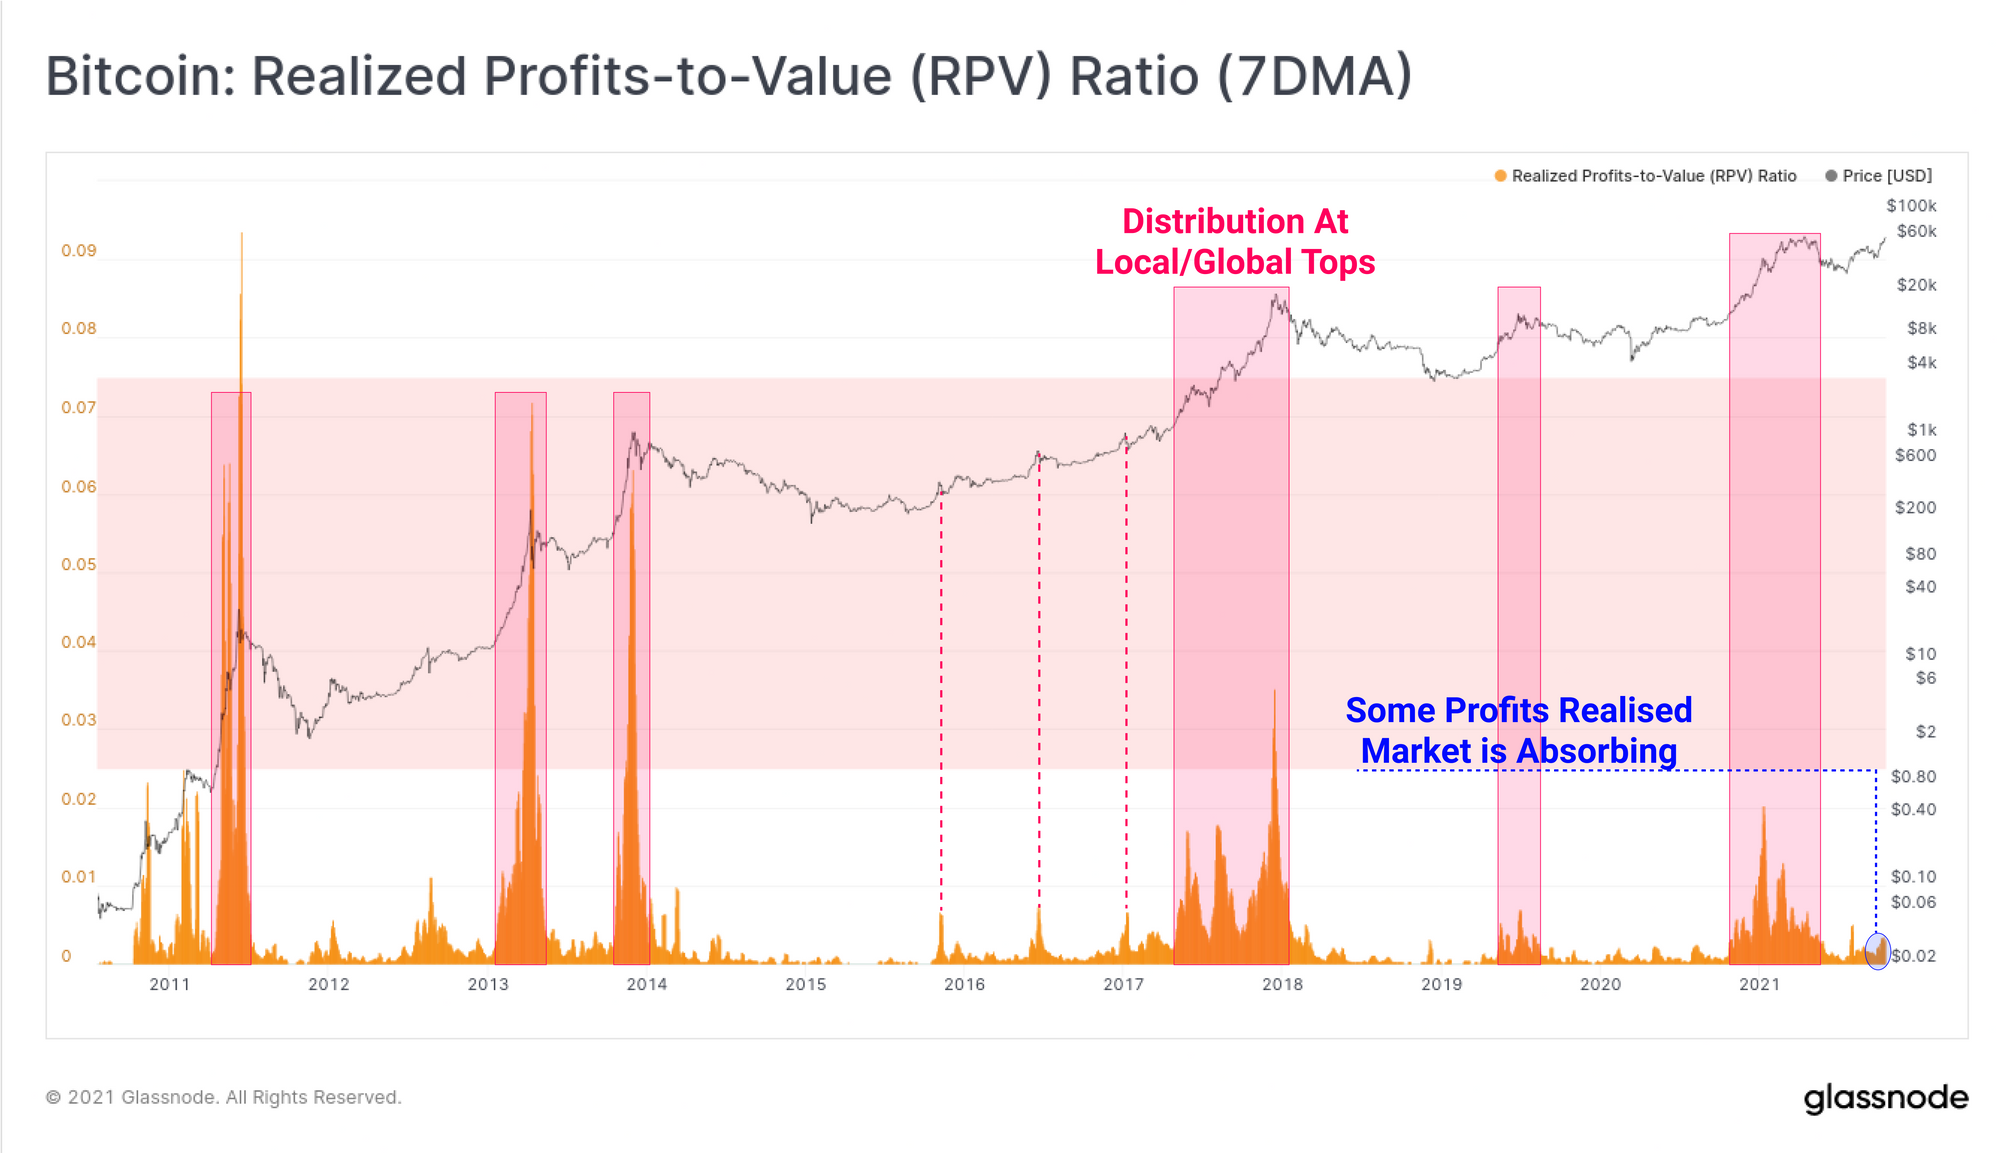
The Realised Profits-to-Value Ratio (RPV) shows the scale of these realised profits to the market on-chain cost basis (Realised cap).
In other words, this metric compares the magnitude of profitable volume spent on-chain (assumed sell pressure), to the value that investors have stored in Bitcoin (sum of all coin value at the price when it was last spent).
Compared to previous market tops and bull markets, the current spending is relatively insignificant compared to the network valuation. Whilst we have now confirmed that profitable coins are on the move, these metrics indicate that current demand is sufficient to absorb any sell-side pressure applied.
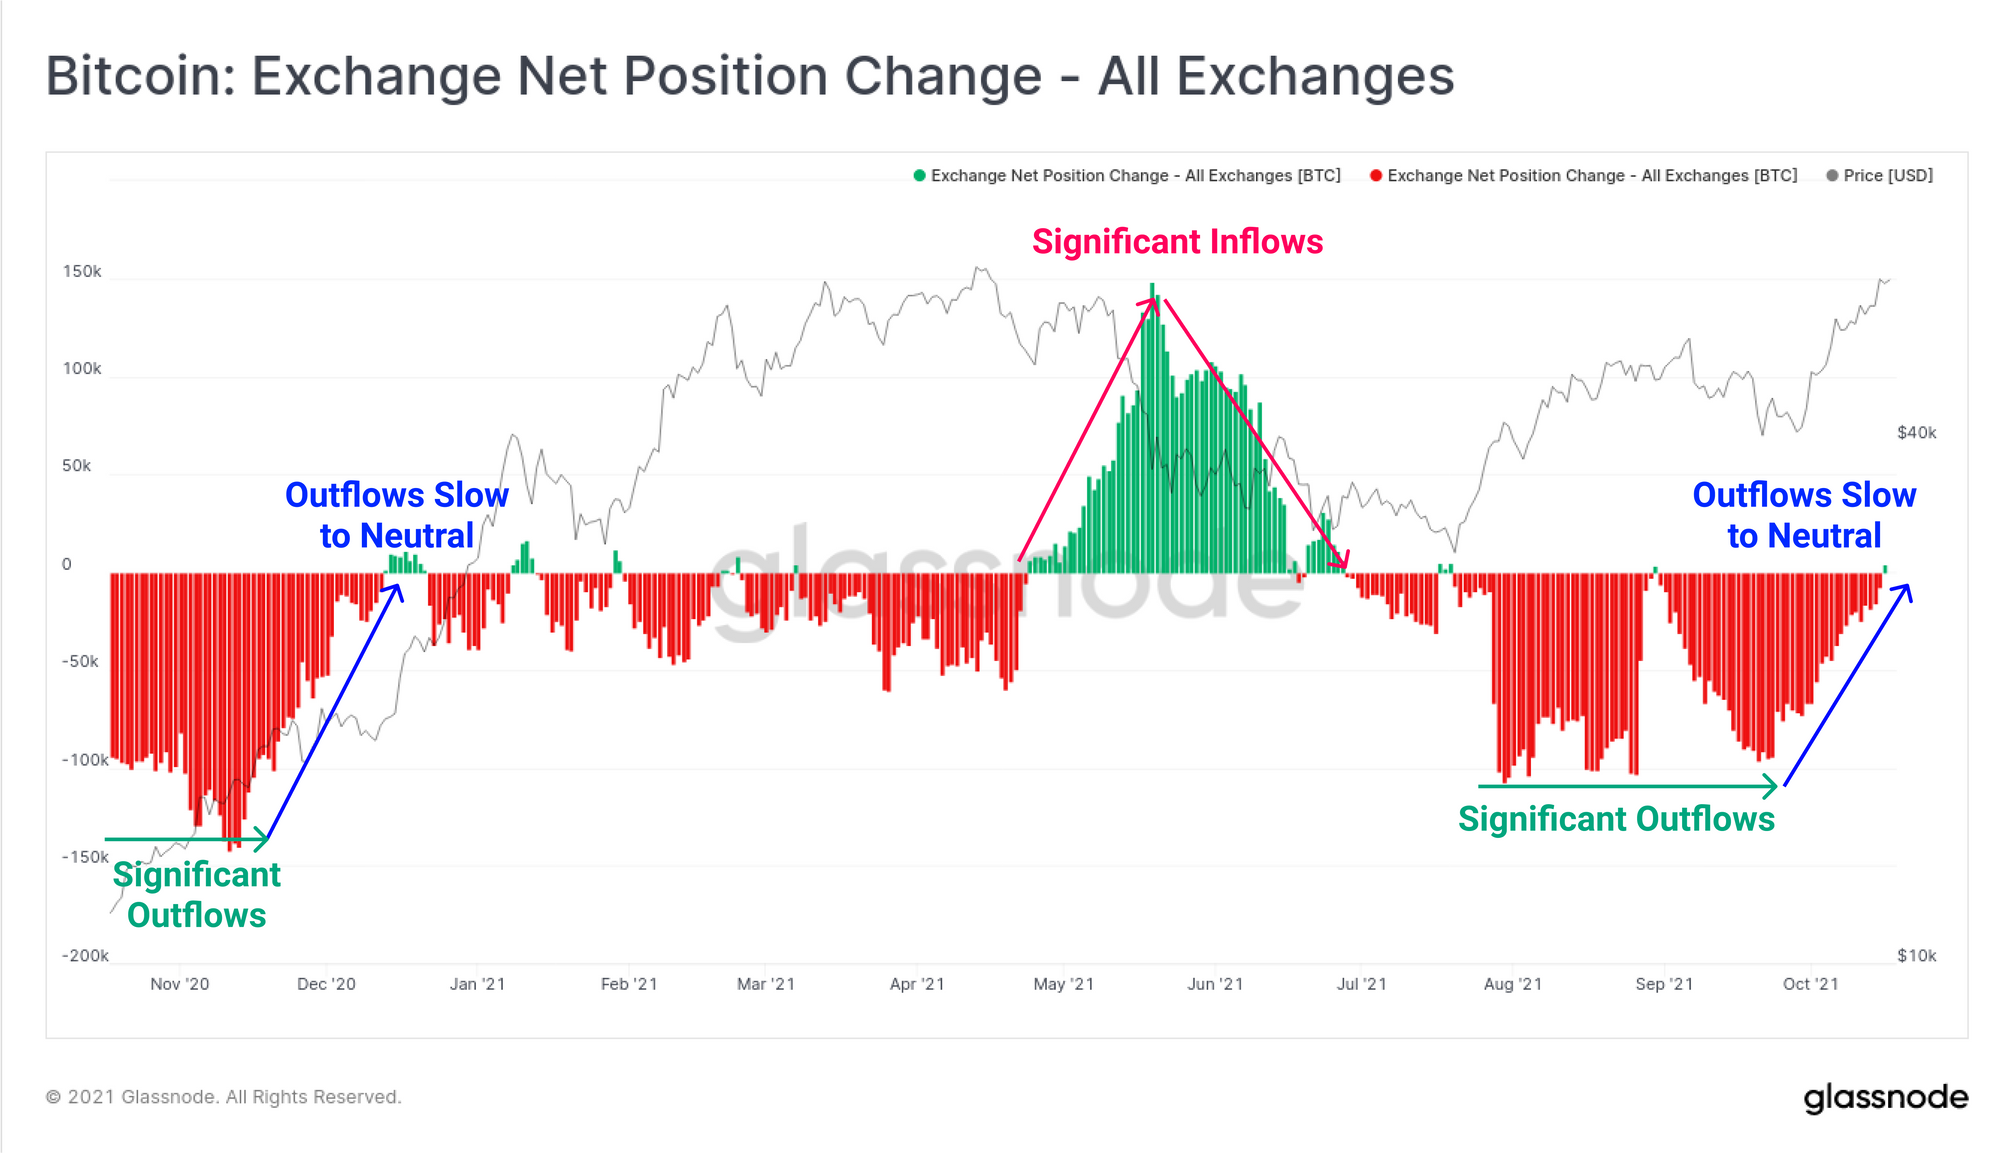
Finally, closing out our investigation into on-chain market structure, we can look to the Exchange Net Position change metric to see if these coins are flowing into exchanges for sale. What we can see is that after an extended period of sustained outflows, the on-net change in exchange balances has returned neutral.
This suggests that over the last 30-days, inflows have been matched with outflows which further indicates that there is sufficient demand at present to absorb the sell-side. It does however indicate fewer coins are being withdrawn and is obviously less constructive for price than net outflows.
Interestingly, this market structure is very similar to the period in late 2020 as Bitcoin approached last cycles $20k ATH. All in all, the market remains quite bullish, however it is likely that this early signal of older coins, owned by LTHs being spent on-chain will continue as it has in all previous Bitcoin cycles.
Derivatives Explode Higher
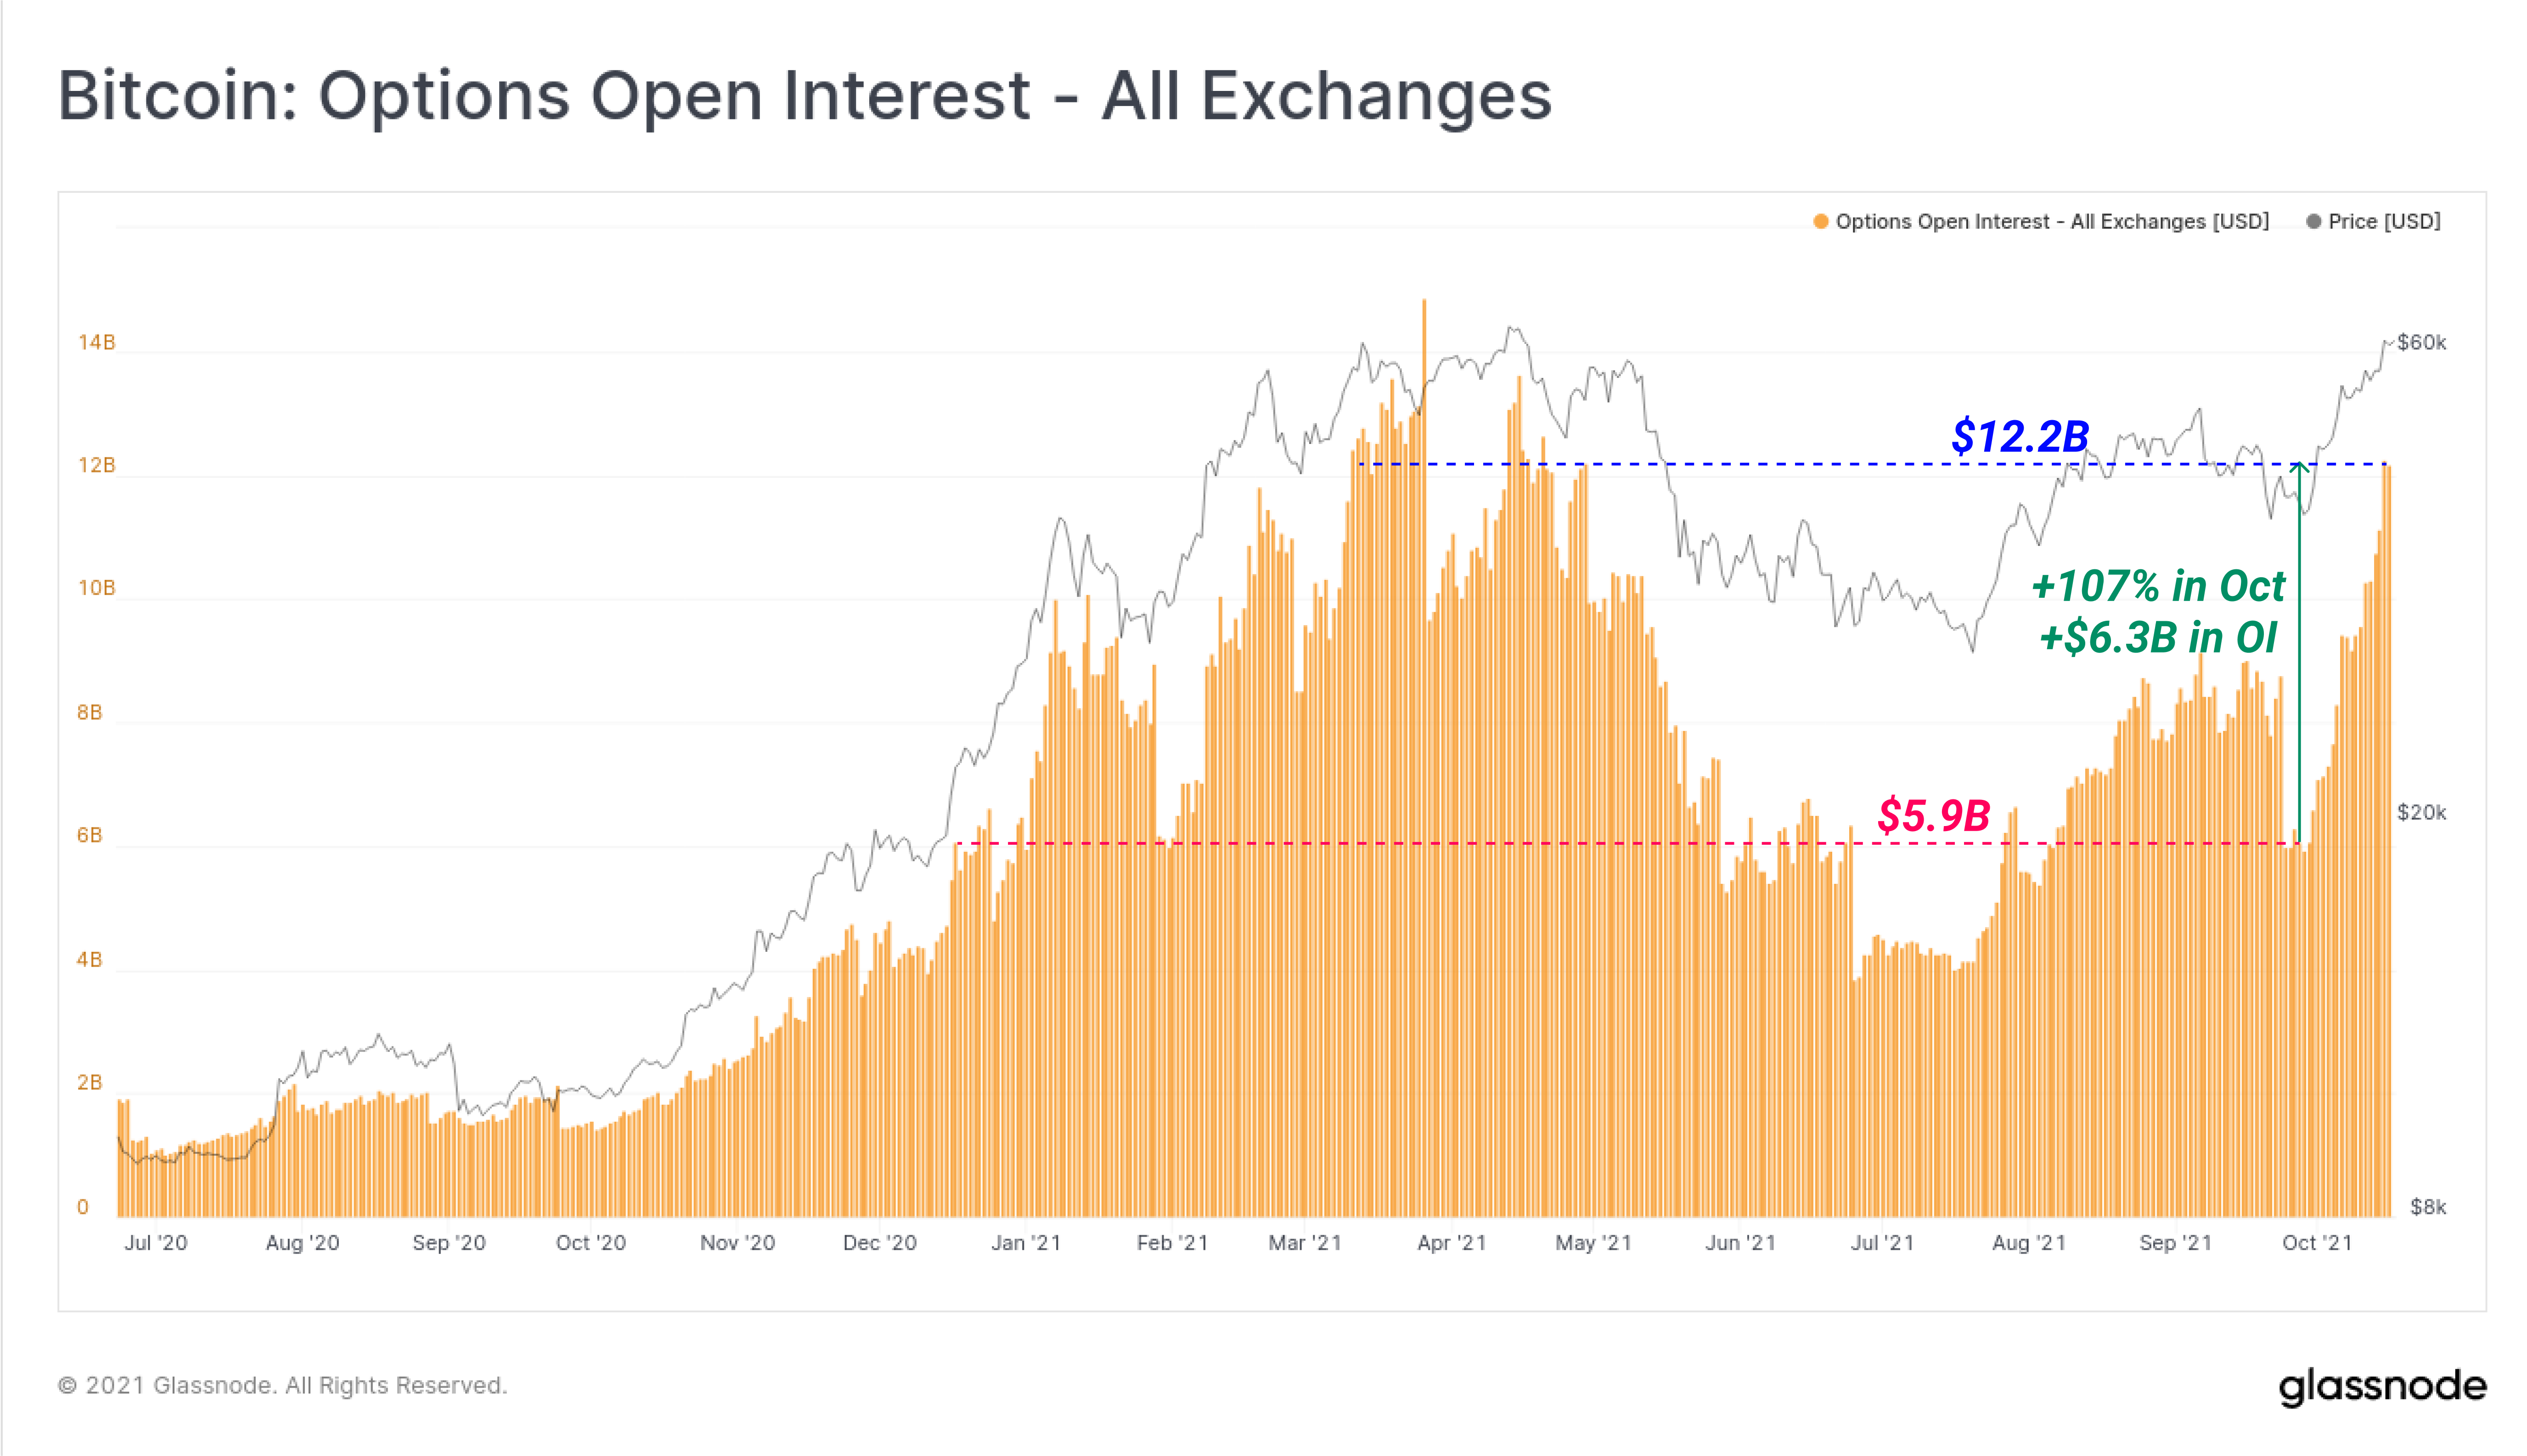
The derivatives markets for Bitcoin have seen marked increases in open interest and volume, particularly in the options space. Options open interest expanded by a remarkable +107% ($6.3B) over the course of October alone. Whilst not an all-time-high, it is not all that far away.
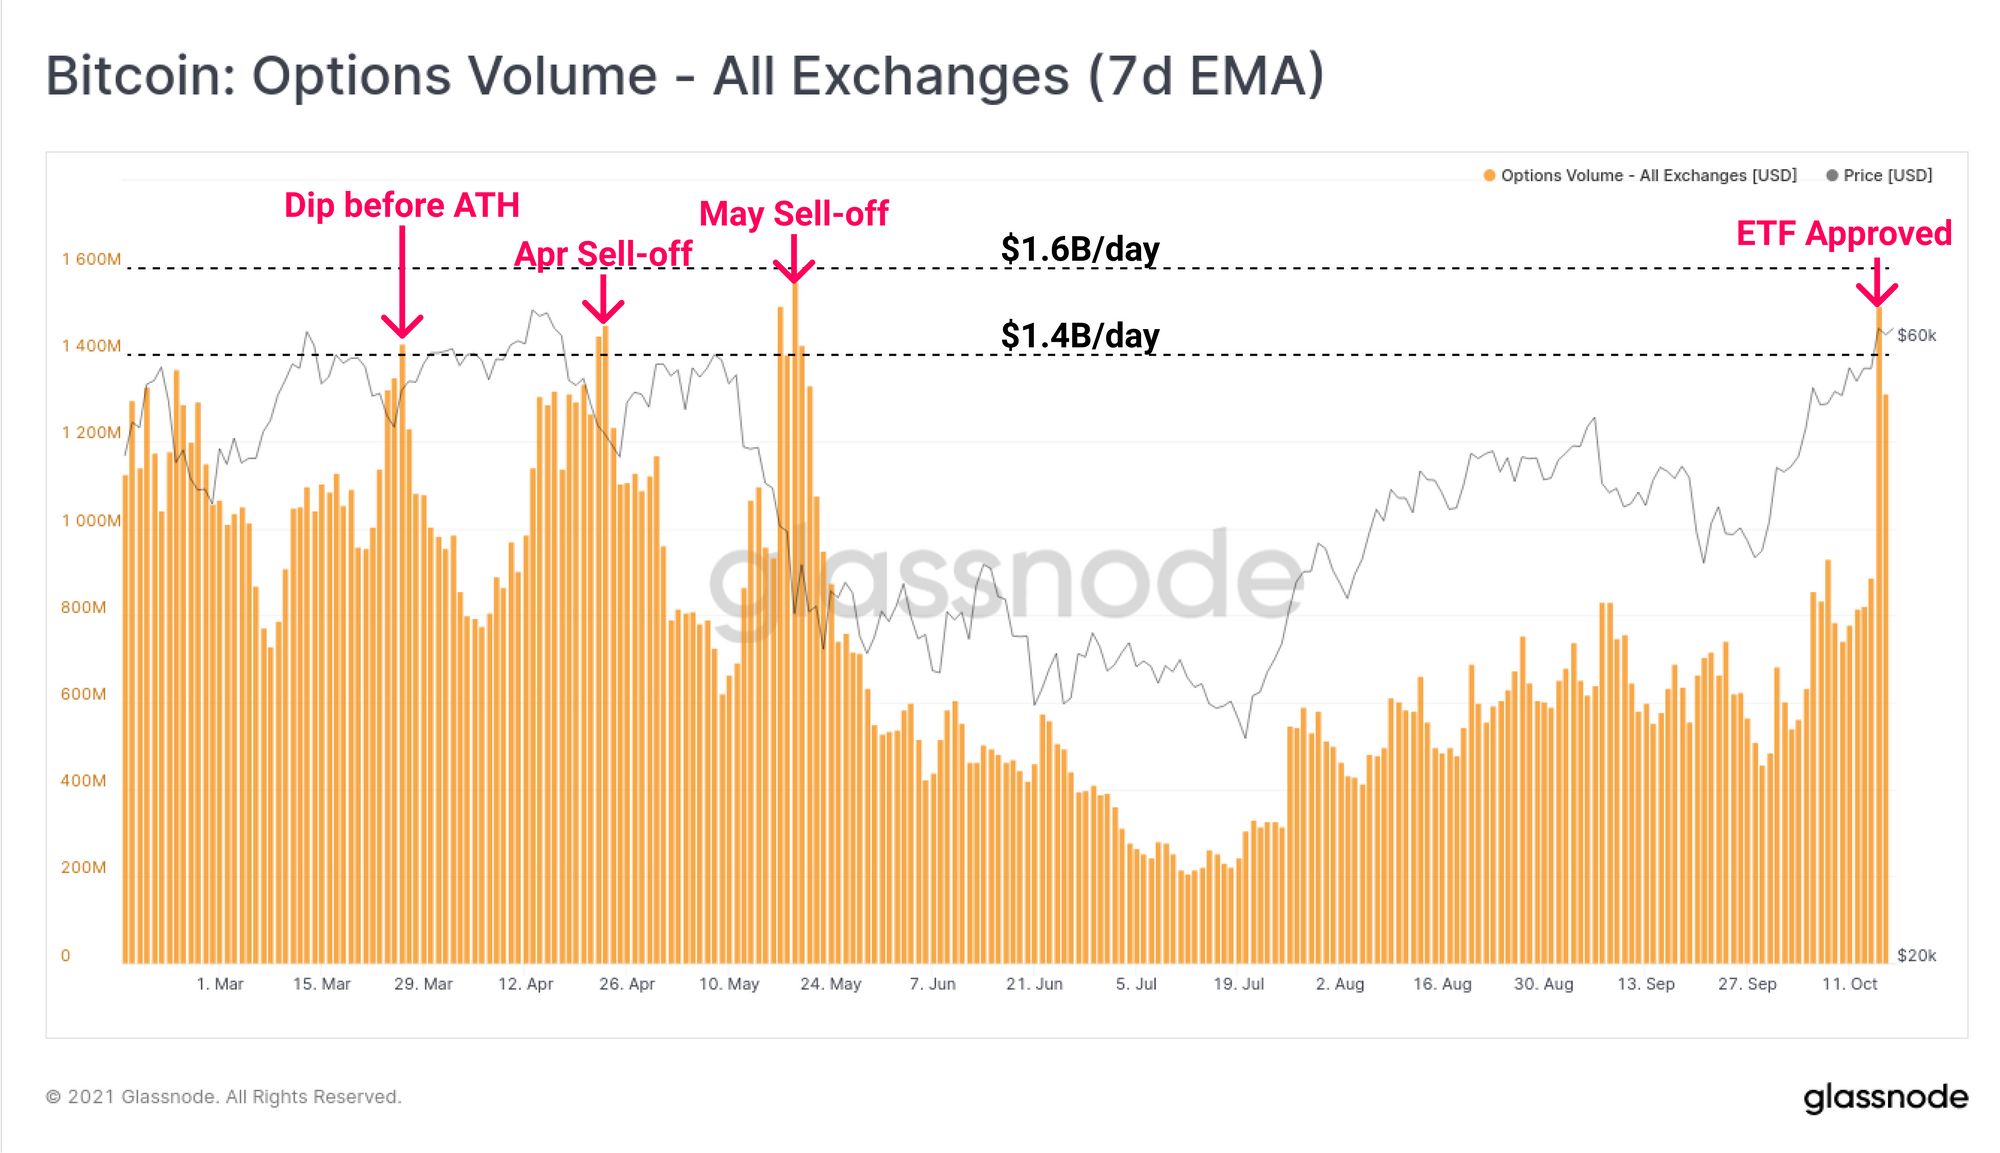
Options trade volume has similarly seen an extraordinary week, rising up to $1.5B as Bitcoin prices breached the $60k price level. Options trade volume has only reached levels this high on three prior occasions, all at similar price points between March and May this year.
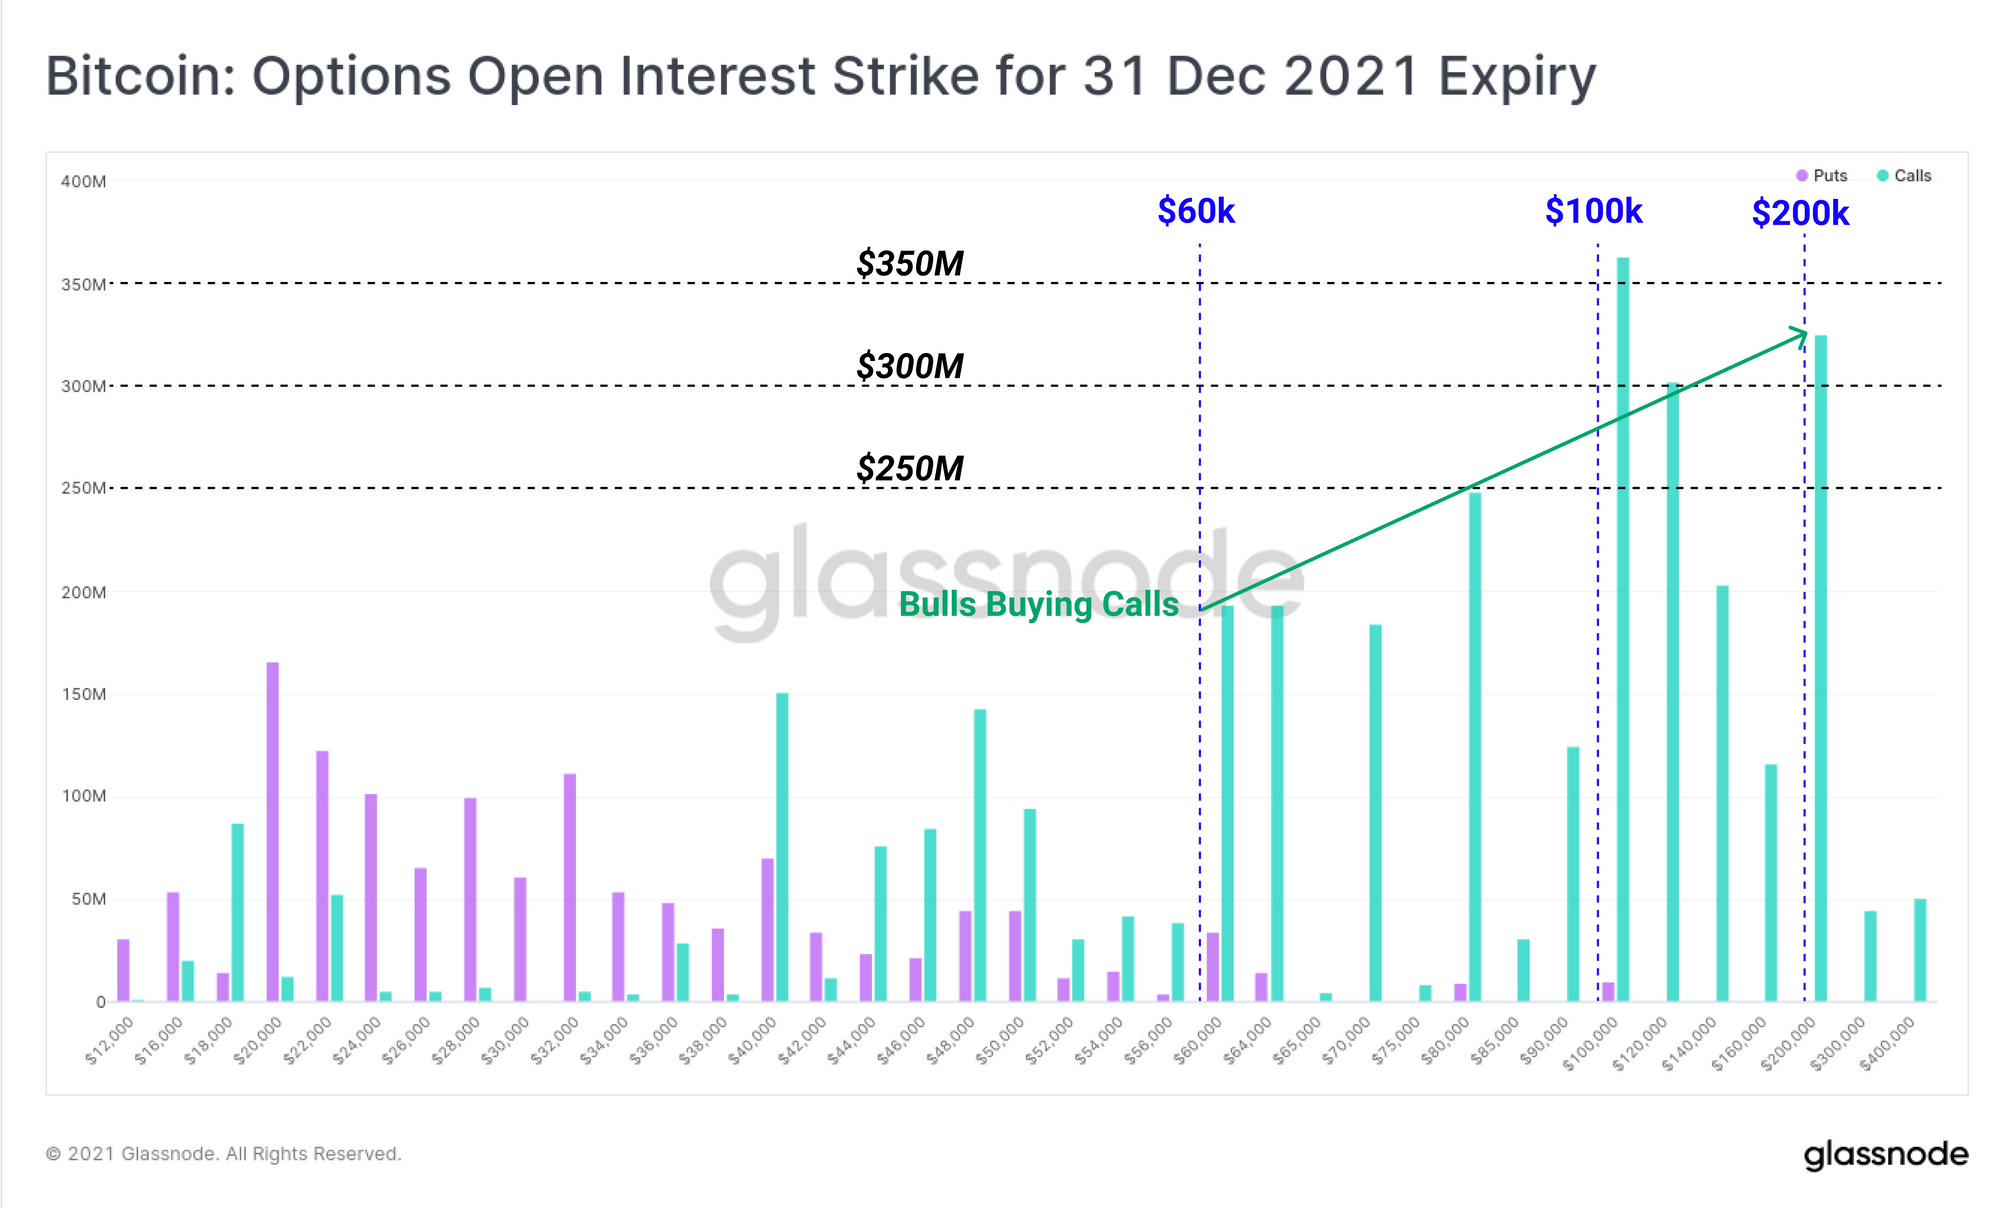
The favoured options contracts appear to be call options with strike prices above $100k, with a typical open interest of $250M to $350M for call options expiring at the end of the year. The open interest in call options dwarfs that in put options, aligning with the overall bullish market sentiment.
In futures markets, open interest has climbed, although certainly not to the same relative rate as in the options space. The chart below shows perpetual futures open interest denominated in BTC to help isolate open interest growth, from the influence of the coin price.
Open interest in perpetual markets is currently around 225k BTC which is coincident with a number or periods that preceded leverage flush outs. Primary examples are April, May and September local tops which were all followed by cascading long liquidations. However a similarly high level of open interest was seen in July before shorts were squeezed out at the $29k bottom.
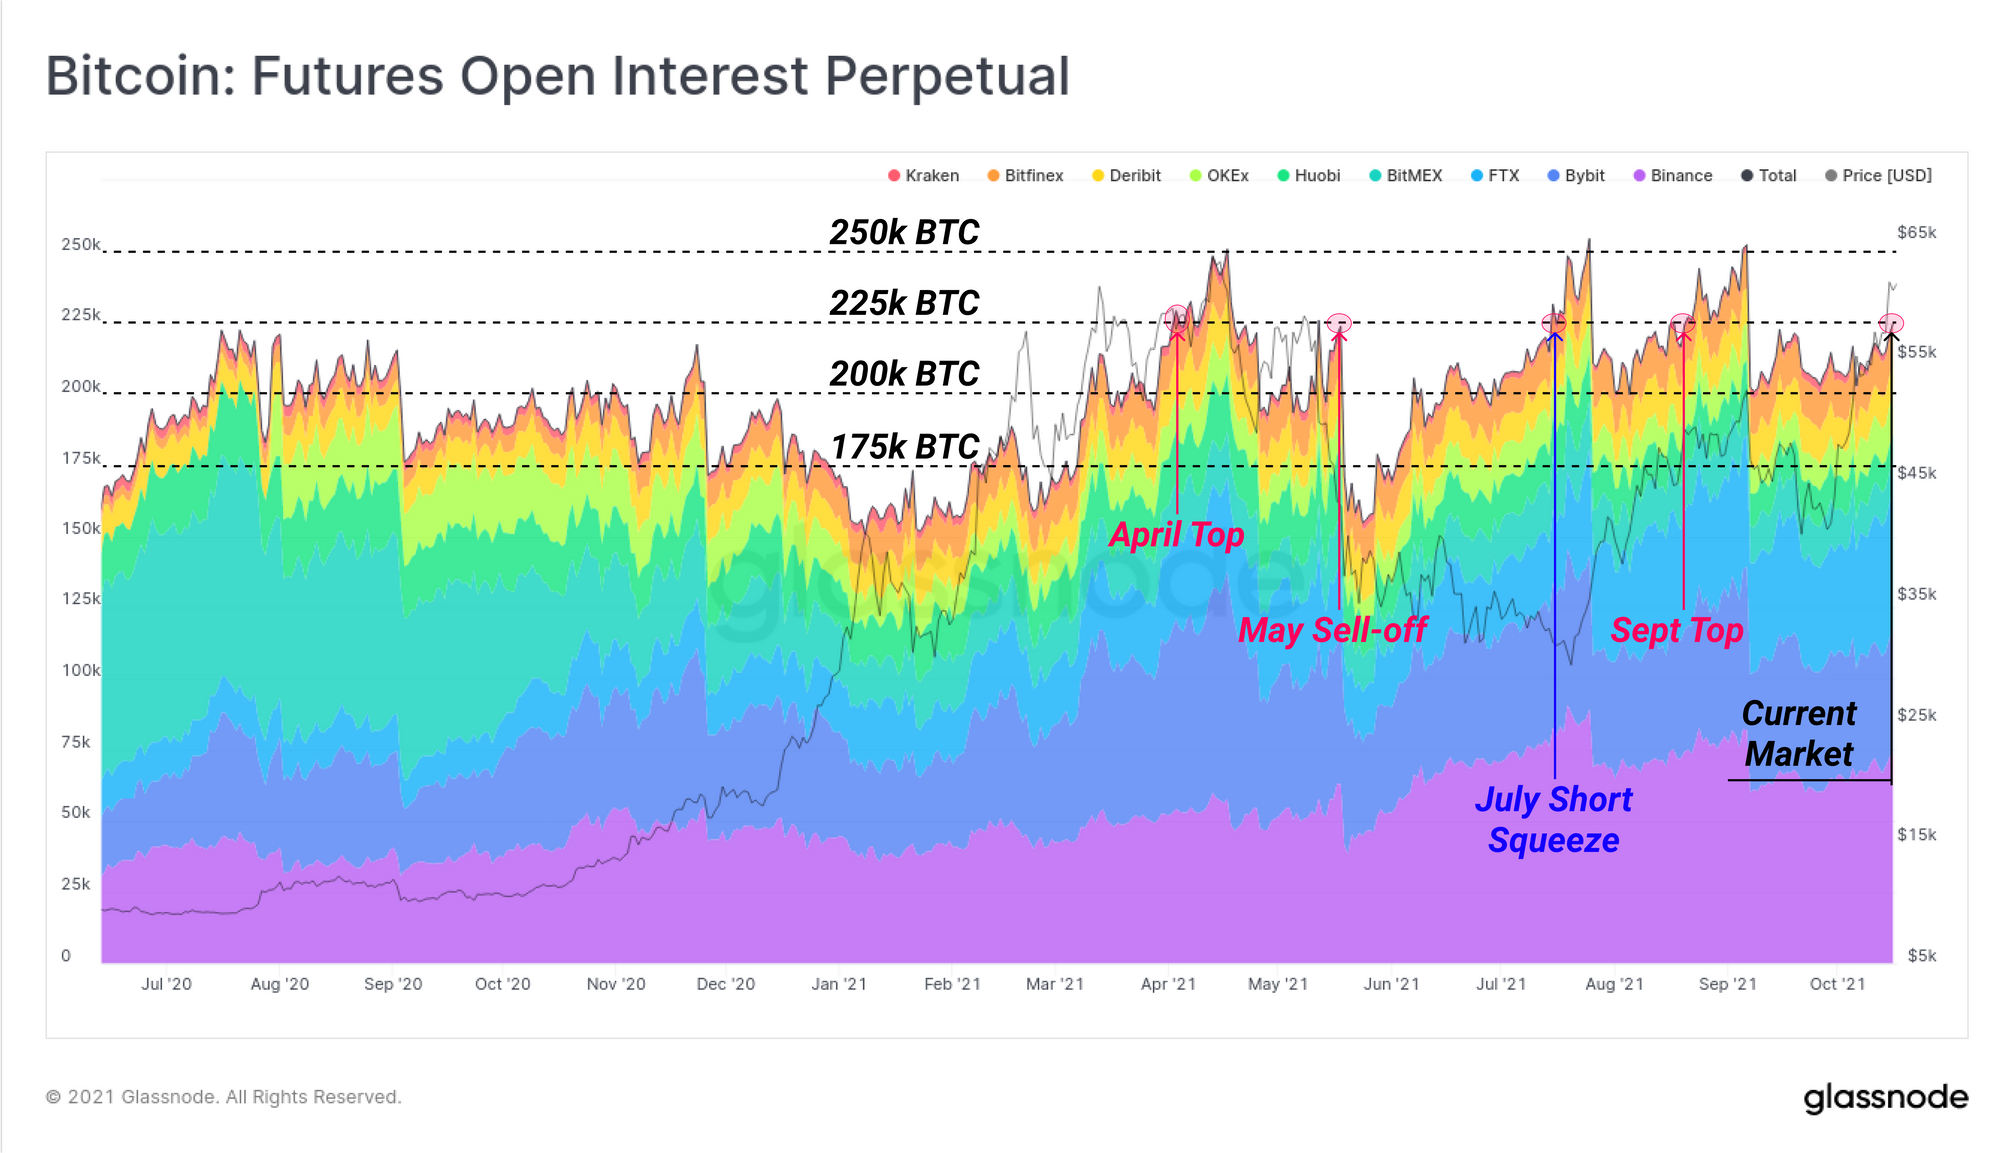
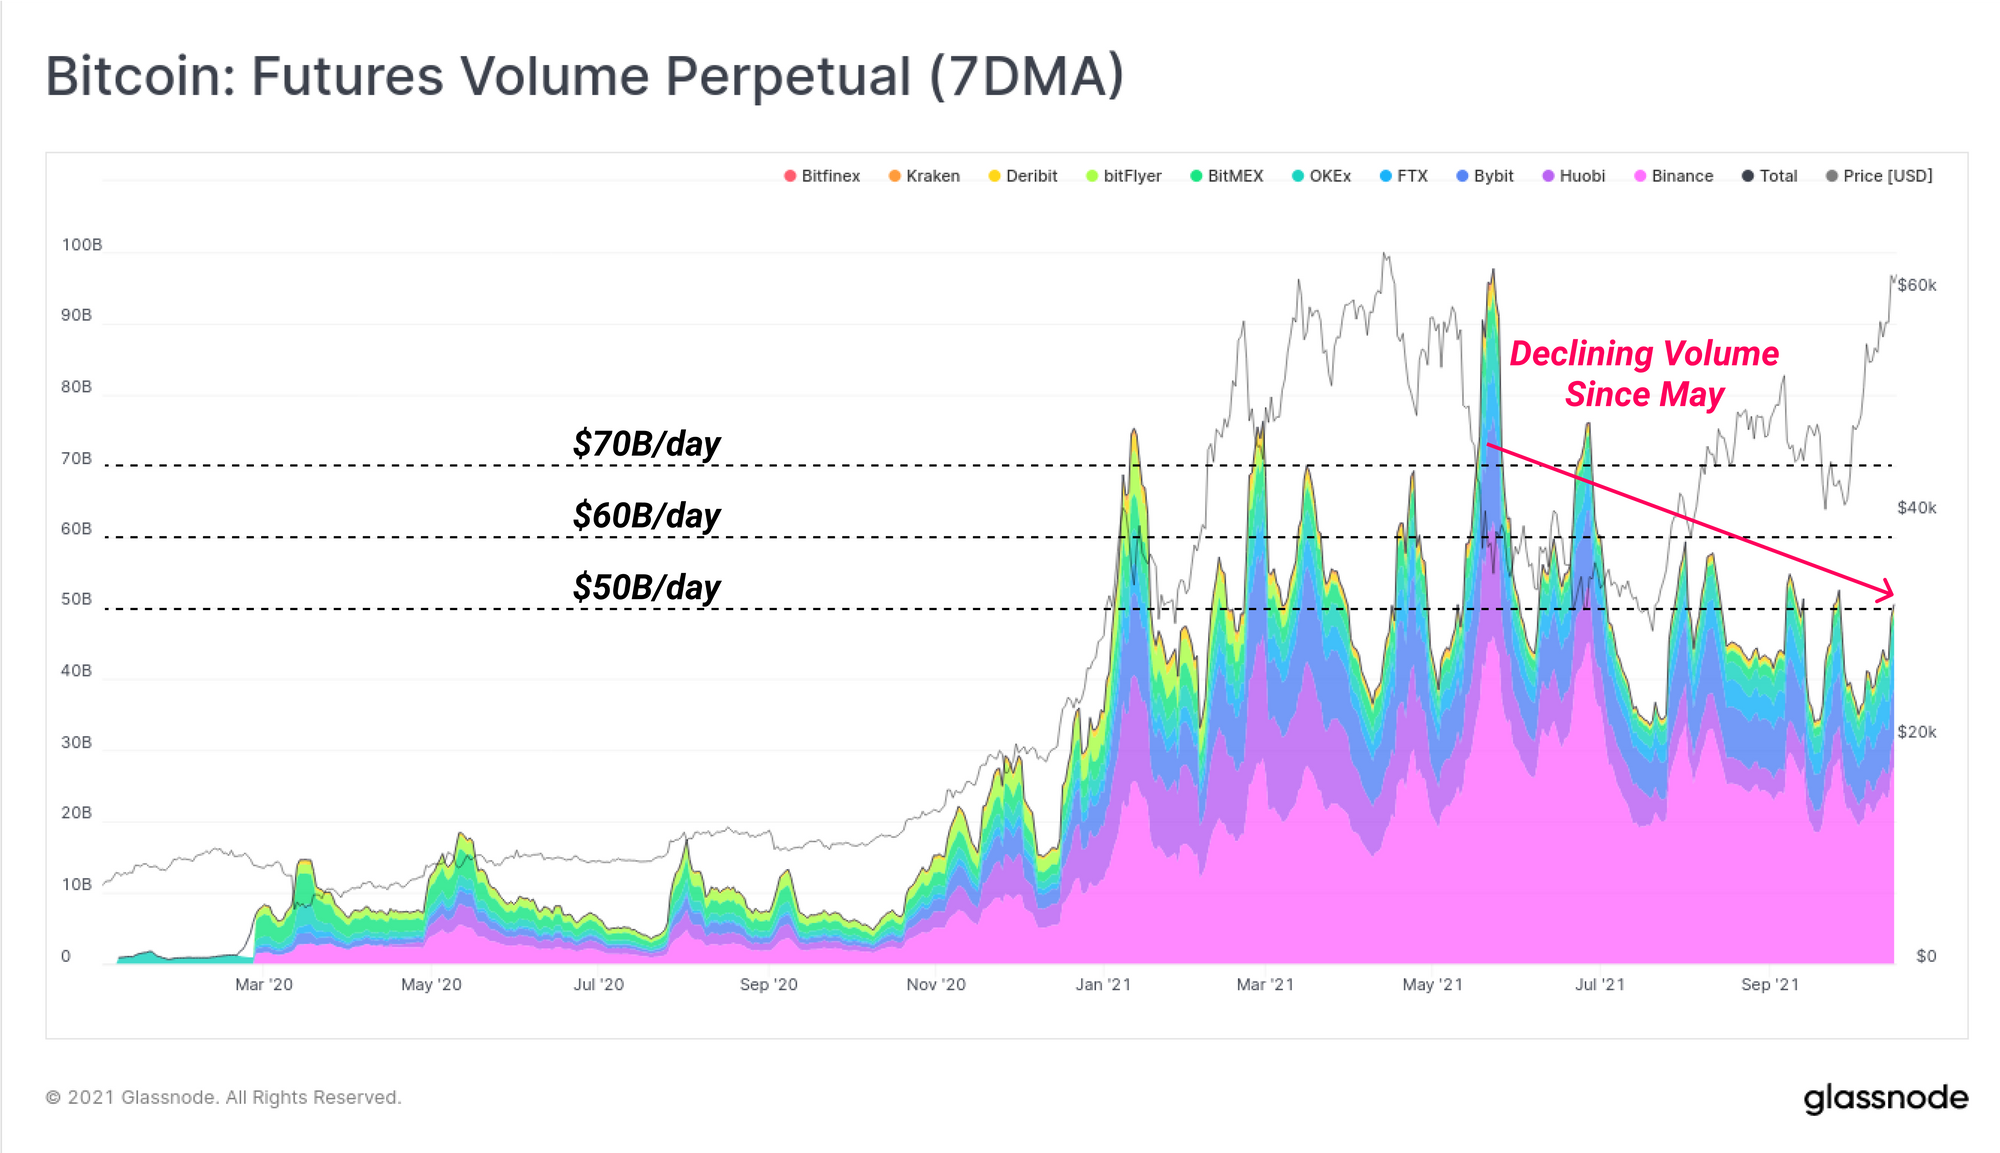
Despite futures open interest approaching ATHs, the volume traded appears to be declining on a macro scale, and has been since the sell-off in May. In a high open interest but low volume environment, it could set the stage for heightened probabilities for a liquidation cascade, as volumes may be insufficient to support the flush out once it gets going.
Whilst the market at large remains relatively healthy, and demand is meeting LTH sell-side, exercising some caution given the elevated leverage across both futures and options markets is likely prudent.
Week On-chain Dashboard
The Week On-chain Newsletter now has a live dashboard for all featured charts here. We have also started production for