Uncertainty Amongst Whales and Old Hands

In the wake of the FTX fallout, we explore the developing trends in on-chain data, which suggest that the confidence and financial position of Whales and Bitcoin old hands have been shaken by the event.

Uncertainty Amongst Whales and Old Hands

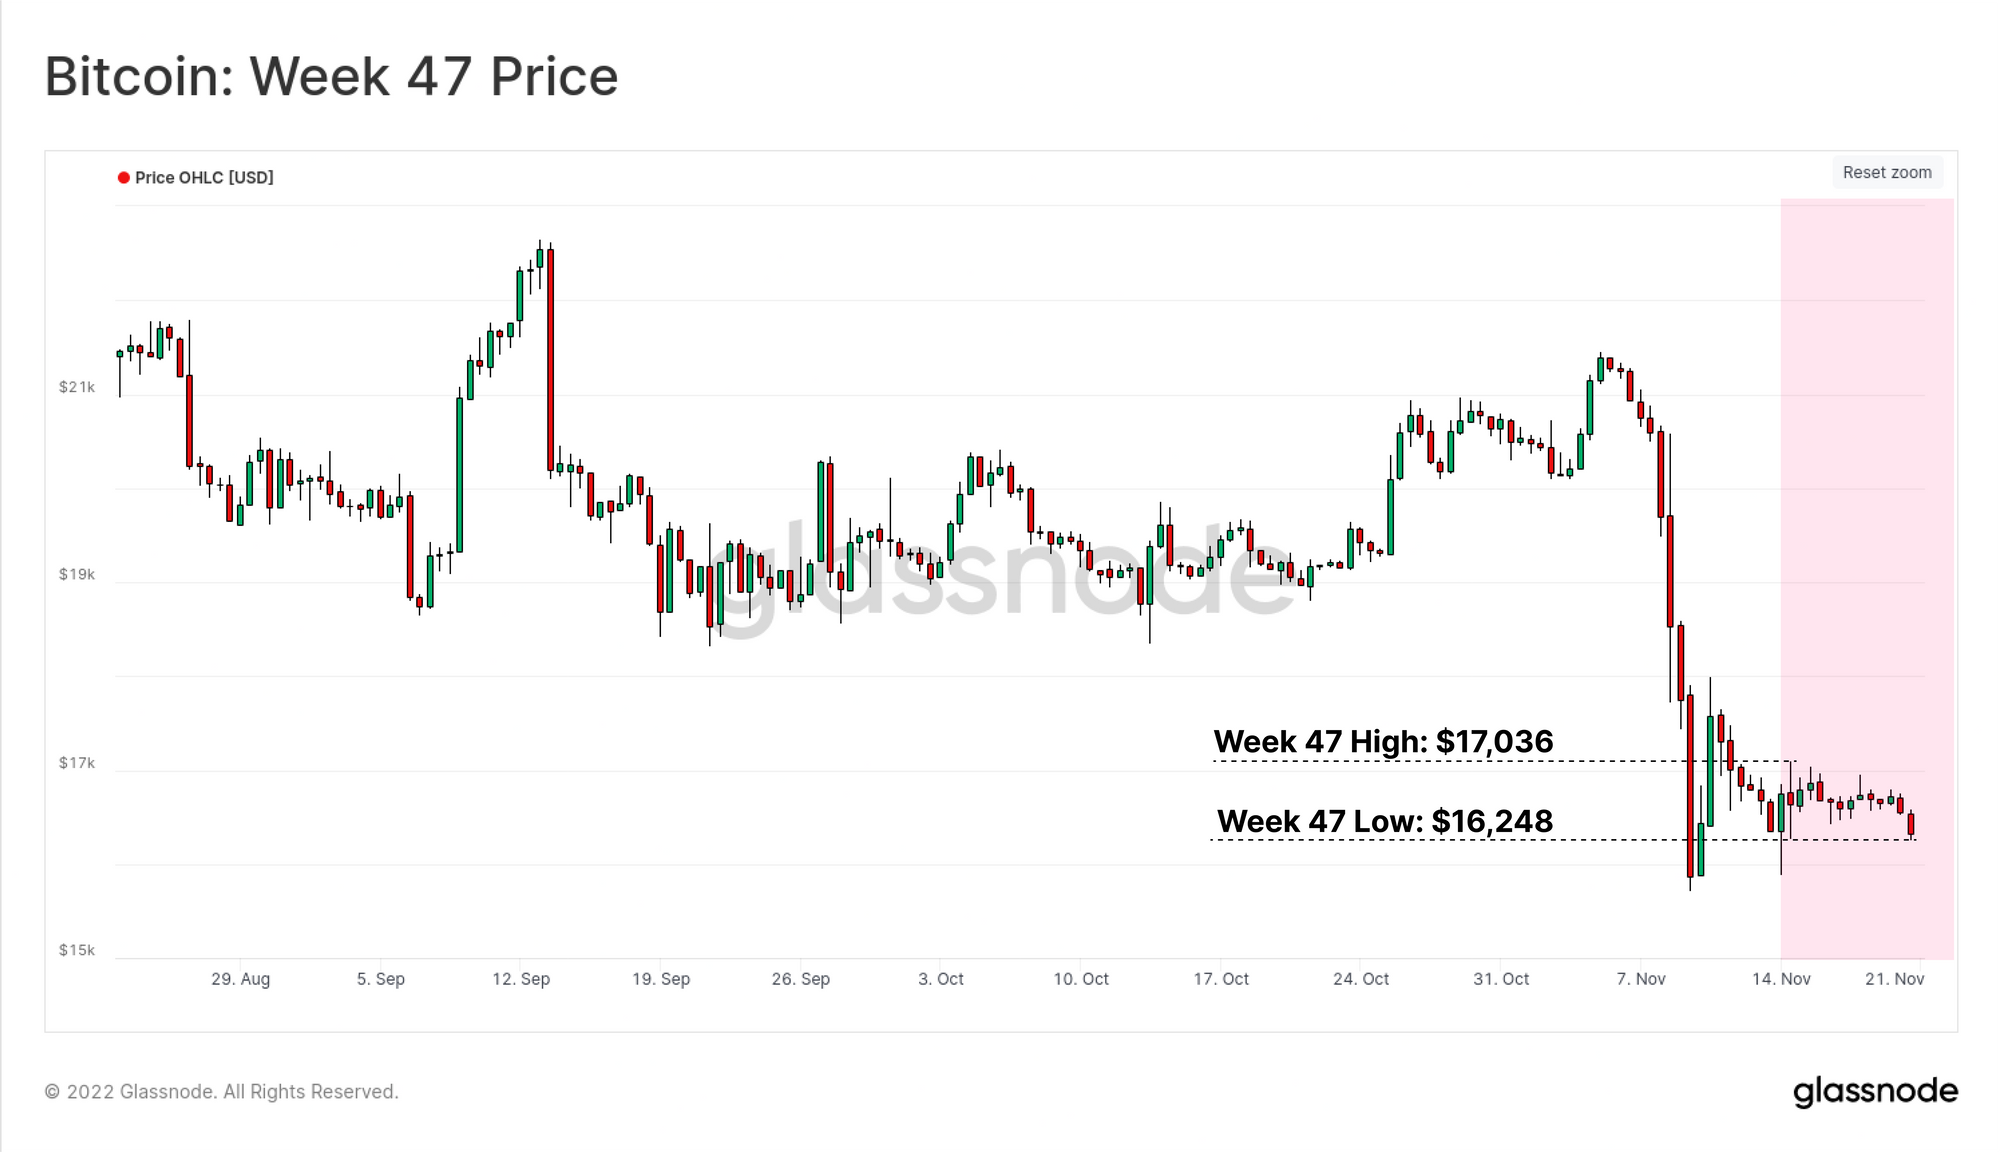
As the dust settles following the FTX fallout, and with a few more weeks of data available, we are able to assess whether recent market weakness has shaken the confidence of Bitcoin holders. The market continues to consolidate this week, however did trade down from the early-week high of $17,036, to close at $16,248, one of the lowest closing prices of the cycle.

In this edition we will zoom into three specific topics, with the goal of assessing how much of a hit Bitcoin investor conviction has taken in the wake of the FTX collapse:

  • Exchange outflows, which have continue to break historical records.
  • Whales who are more than likely underwater on their position in aggregate.
  • Long-term holders, whom are currently spending coins at a historically significant rate.

⚡Cyber Week Deal: 40% Off Advanced Plans⚡

Starting today, you can take advantage of our first-ever end of year sale! Save 40% on a monthly or yearly Glassnode Advanced plan and access data and insights that are helping thousands of crypto traders and investors around the world.

Access 40% off your Advanced Plan

Translations

This Week On-chain is now being translated into Spanish, Italian, Chinese, Japanese, Turkish, French, Portuguese, Farsi, Polish, Arabic, Russian, Vietnamese and Greek.

The Week Onchain Dashboard

The Week Onchain Newsletter has a live dashboard with all featured charts available here. This dashboard and all covered metrics are explored further in our Video Report, which is released on Tuesdays each week. Visit and subscribe to our Youtube Channel, and visit our Video Portal for more video content and metric tutorials.


Coins Flood Out of Exchanges

As we covered in last weeks edition, outflows from exchanges and into investor wallets of almost all sizes have been historical in scale, as BTC holders seek safety in self-custody. As a result, the 30-day net position change of all exchange balances has reached a new all-time-high for outflows this week.

BTC is currently flowing out of exchanges at a rate of -172.7k BTC per month, eclipsing the previous peak set following the June 2022 sell-off.

Live Advanced Chart

Total confirmed transactions have also seen an uptick over the last two weeks, reaching a multi-month high of 246k confirmed transactions per day. Out of this total, around 29.2% were related exchange withdrawal transfers (77.1k withdrawals), and 18.2% were exchange deposits transfers (48.1k deposits).

This burst of exchange related activity pushes the dominance of exchange deposit or withdrawal transactions to 47.4% of the toal, the highest level year-to-date. Historically, higher exchange dominance can be associated with bull markets (sustained trends), and high volatility sell-off events (short-term spikes).

Live Advanced Dashboard

On a 30-day moving average basis, the combined USD denominated inflow and outflow volumes across all exchanges spiked higher, reaching $1.72B/day this week. The chart below presents this monthly average 🔴 relative to the yearly average 🔵 as a gauge for overall momentum of the Bitcoin economy.

Historically, periods where the monthly average of exchange volumes exceeds the yearly has signalled positive market momentum, as more coin volume changes hands. In the current market, the combined exchange inflow and outflow volume would have to reach and sustain levels above $2.15B to signify positive momentum on this front.

Live Advanced Dashboard

Whales Underwater

A trend which can be observed during the later stages of the 2018-19 bear market is an aggregate increase in the Mean Inflow Volume to exchanges. In other words, the average deposit size across all major exchanges increases in USD terms as the market formed a cycle bottom. This is present across all major exchanges including Binance, Bitfinex, Coinbase, Gemini, and Kraken.

A similar trend has been in effect since late May following the collapse of the LUNA-UST project. This indicates that in general, there has been a net increase in larger size deposits over the last 6-months. This indicates that entities such as whales, institutions, and trading firms have had a larger dominance across exchange deposits.

Live Advanced Dashboard

A driving factor of this may be the financial position of Whales (entities > 1k BTC). The yellow trace below shows the average withdrawal price of the Whale cohort since 5-Jul-2017 (launch of Binance), which is trading at $17,825.

With spot prices currently at $16.2k, this is the the first time since March 2020 that this Whale cohort has been at an unrealized loss. In response, Whales have actually been depositing coins to exchanges, with an excess of between 5k and 7k BTC per day in net inflows over the past week.

Live Advanced Dashboard

This magnitude of financial pain is being expressed across the wider market, with one of the largest spikes in Realized Loss in the 2020-22 cycle. A peak daily value of -$1.45B in realized loss was locked in this week, ranking as the fourth largest in history.

A comparably small $83M in realized profits occurred, suggesting that the vast majority of spent volume at present is sourced from investors from the current cycle, and very little coin volume from previous cycles are on the move.

Live Advanced Dashboard

Old Hands Awaken

A pattern of interest we highlighted in our last edition was the uptick in spending by Bitcoin longer-term holders. During bear markets, significant and sustained upticks in old coin spending is often a signal of reduced conviction, fear, and capitulation amongst this more experienced cohort.

The Spent Volume Age Bands (SVAB) metric shows that just over 4% of all spent volume was sourced from coins older than 3-months this week, which is the highest level in 2022. This relative magnitude is coincident with some of the largest in history, often seen during capitulation events and wide scale panic events.

Live Advanced Dashboard

The spent BTC volume older than 6-months has hit also the fifth highest value over the last five years. Over 130.6k BTC aged 6-months or more were spent on 17-Nov alone, with the 7-day average now at 50.1k BTC per day.

This suggests that there is significant uncertainty, which is prompting the changing of hands, and or shuffling of coins by longer-term investors.

Live Advanced Dashboard

In the time since FTX collapsed, a total of 254k BTC older than 6-months have been spent, equivalent to around 1.3% of the circulating supply. On a 30-day change basis, this is the steepest decline in older coin supply since the Jan 2021 bull run, where long-term investors were taking profits in the bull market.

Live Advanced Dashboard

The average age per spent coin can be measured via the Dormancy metric, which has also seen a significant uptick over recent weeks. Two traces are show below, for different variants of Dormancy:

  • 🔵 Dormancy: which has rallied to 44-days, and presents the average age per spent coin across the whole market.
  • 🔴 Entity-Adjusted Dormancy: has similarly rallied, hitting 78-days. This variant reflects filtered data that removes self-spends and internal wallet reshuffling.

When both metrics experience a similar spike higher, it provides confidence that a meaningful portion of the spending taking place is related to coins changing hands, and less so to internal wallet shuffling. Thus it appears that even Bitcoin long-term holders have been spooked by recent events, and a sub-set of them are spending coins and divesting in response.

Live Advanced Dashboard

Finally, we will inspect the behavior of Long-Term Holders, which accounts for the entities that are statistically the least likely to spend in the face of volatility. Their supply has declined by 84,560 BTC post-FTX, which remains one of the most significant declines in the last year. As shown in the chart below, LTH supply declines have exceeded 100k BTC in three back-to-back months through May, June and July this year. This makes the current decline notable, but not the largest, although it is still underway.

Live Professional Chart

Summary and Conclusions

Across many metrics that describe the behavior of Bitcoin longer-term investors, several are signalling that a non-trivial volume of spending, and divestment is underway. As noted last week, a slow-down and retrace of these metrics would signify this may be a short-term event, however with each passing day that these trends persist, it becomes increasingly plausible that a wider scale reduction in confidence is in play.

The Whale cohort are in a mode of net distribution at present, sending between 5k and 7k in excess BTC into exchanges. Meanwhile, the flight of coins off exchanges by almost all cohorts is at an all-time high. The whirlwind impact of the FTX collapse continues to play out, and it remains to be seen just how extensive the shake-up to investor confidence has been.


Translated channels

We are proud to have launched new social channels for:


--

Disclaimer: This report does not provide any investment advice. All data is provided for information purposes only. No investment decision shall be based on the information provided here and you are solely responsible for your own investment decisions.