The Character of Capitulation

As the dust settles after the FTX debacle, a key question is whether the sell-off can be better characterized as a simple continuation of the bearish trend, or instead a trigger of a deeper psychological shift amongst investors.

The Character of Capitulation

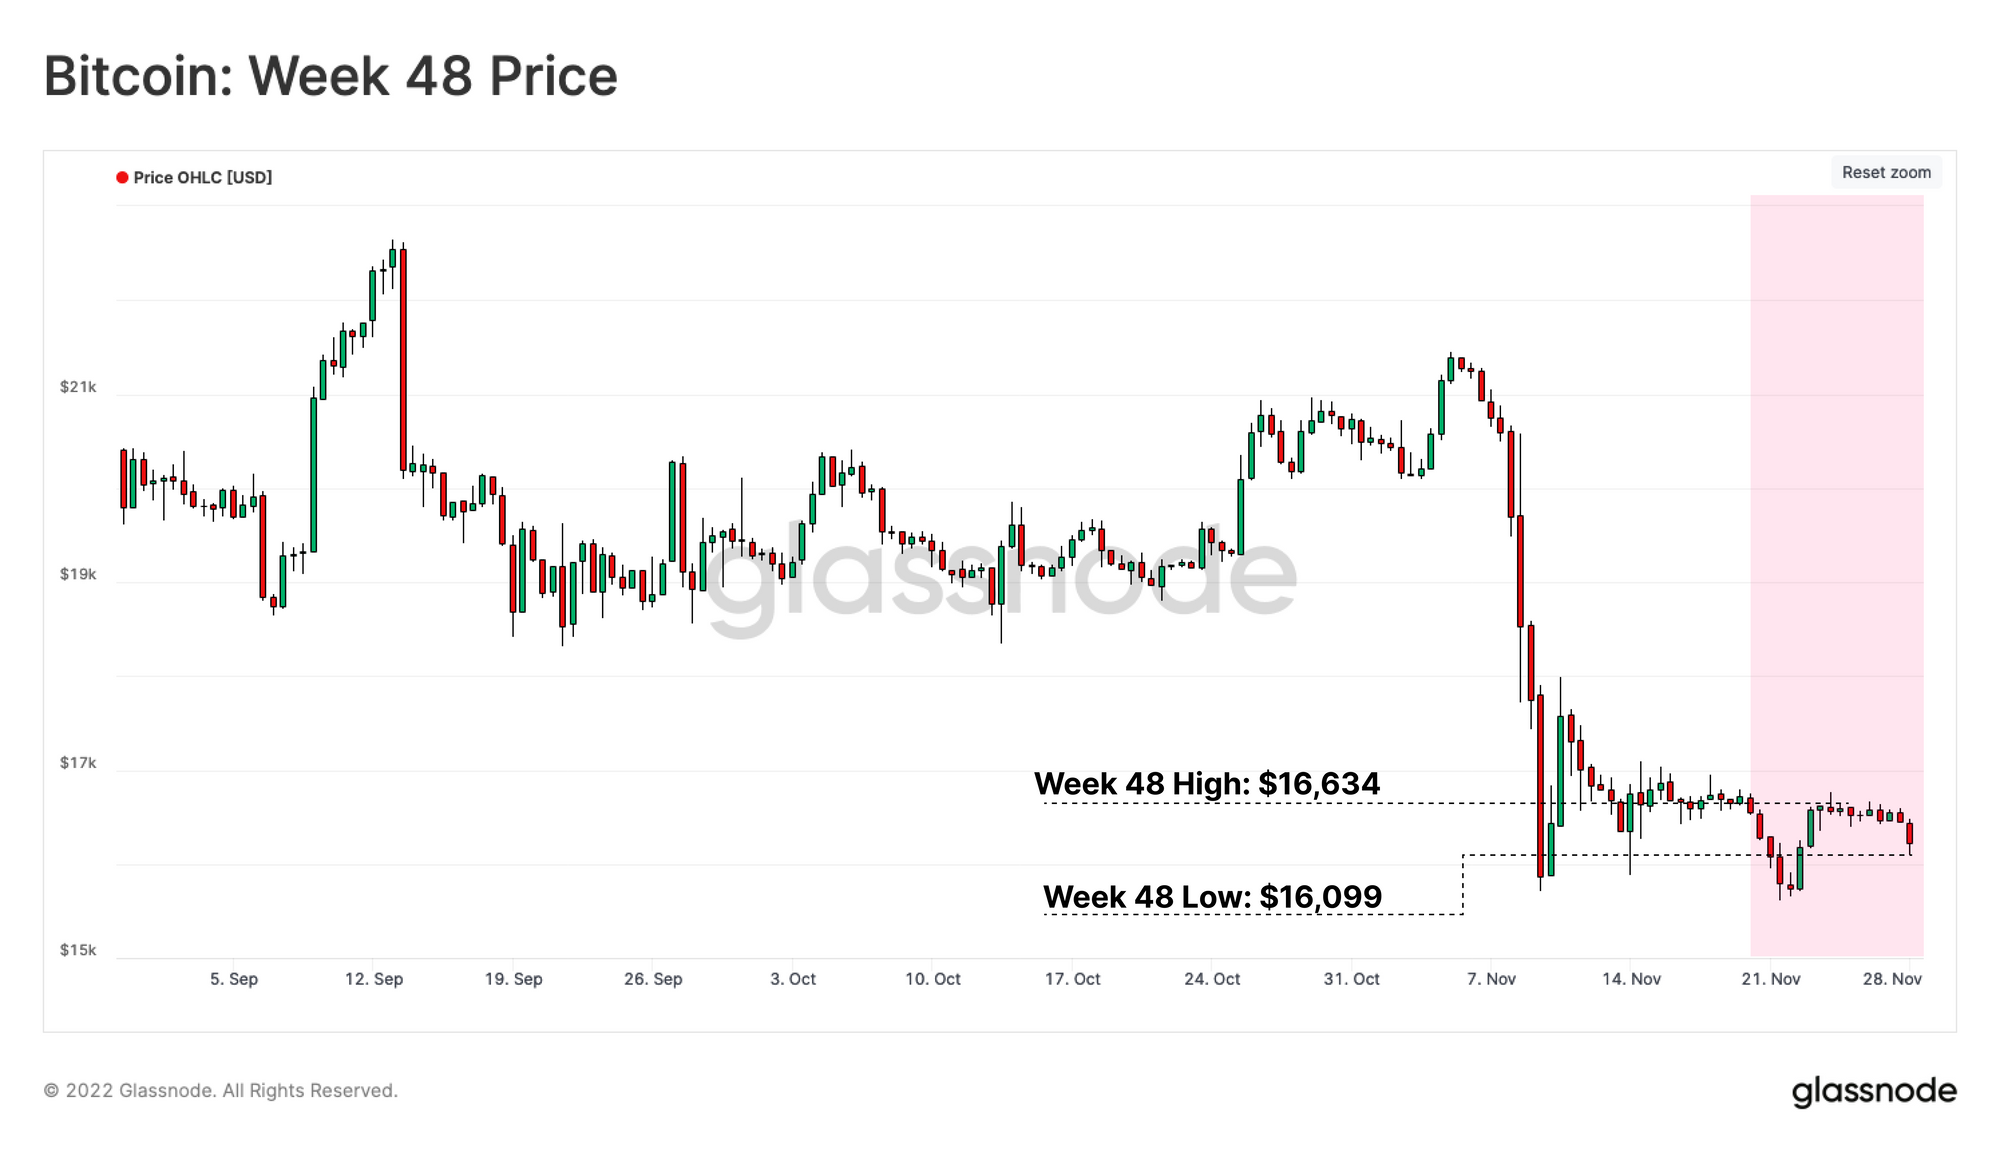
The Bitcoin market has continued to consolidate after a chaotic few weeks, with prices trading within a narrow range, holding just above $16k. As the dust settles following the collapse of FTX, the aggregate response of Bitcoin holders is slowly becoming clearer. A key question is whether the recent sell-off can be better characterized as simply a continuation of the bearish trend, or perhaps a trigger of a deeper psychological shift amongst investors.

In this week's edition, we will explore the scale of both realized and unrealized losses amongst Bitcoin holders, in what is now one of the heaviest capitulation events in history. We shall also analyze the shifting behavioral trends which have occurred since the event, and what this tells us about the bigger picture, and the subsequent effects on investor resolve, and seller exhaustion.

A Behavioral Shift

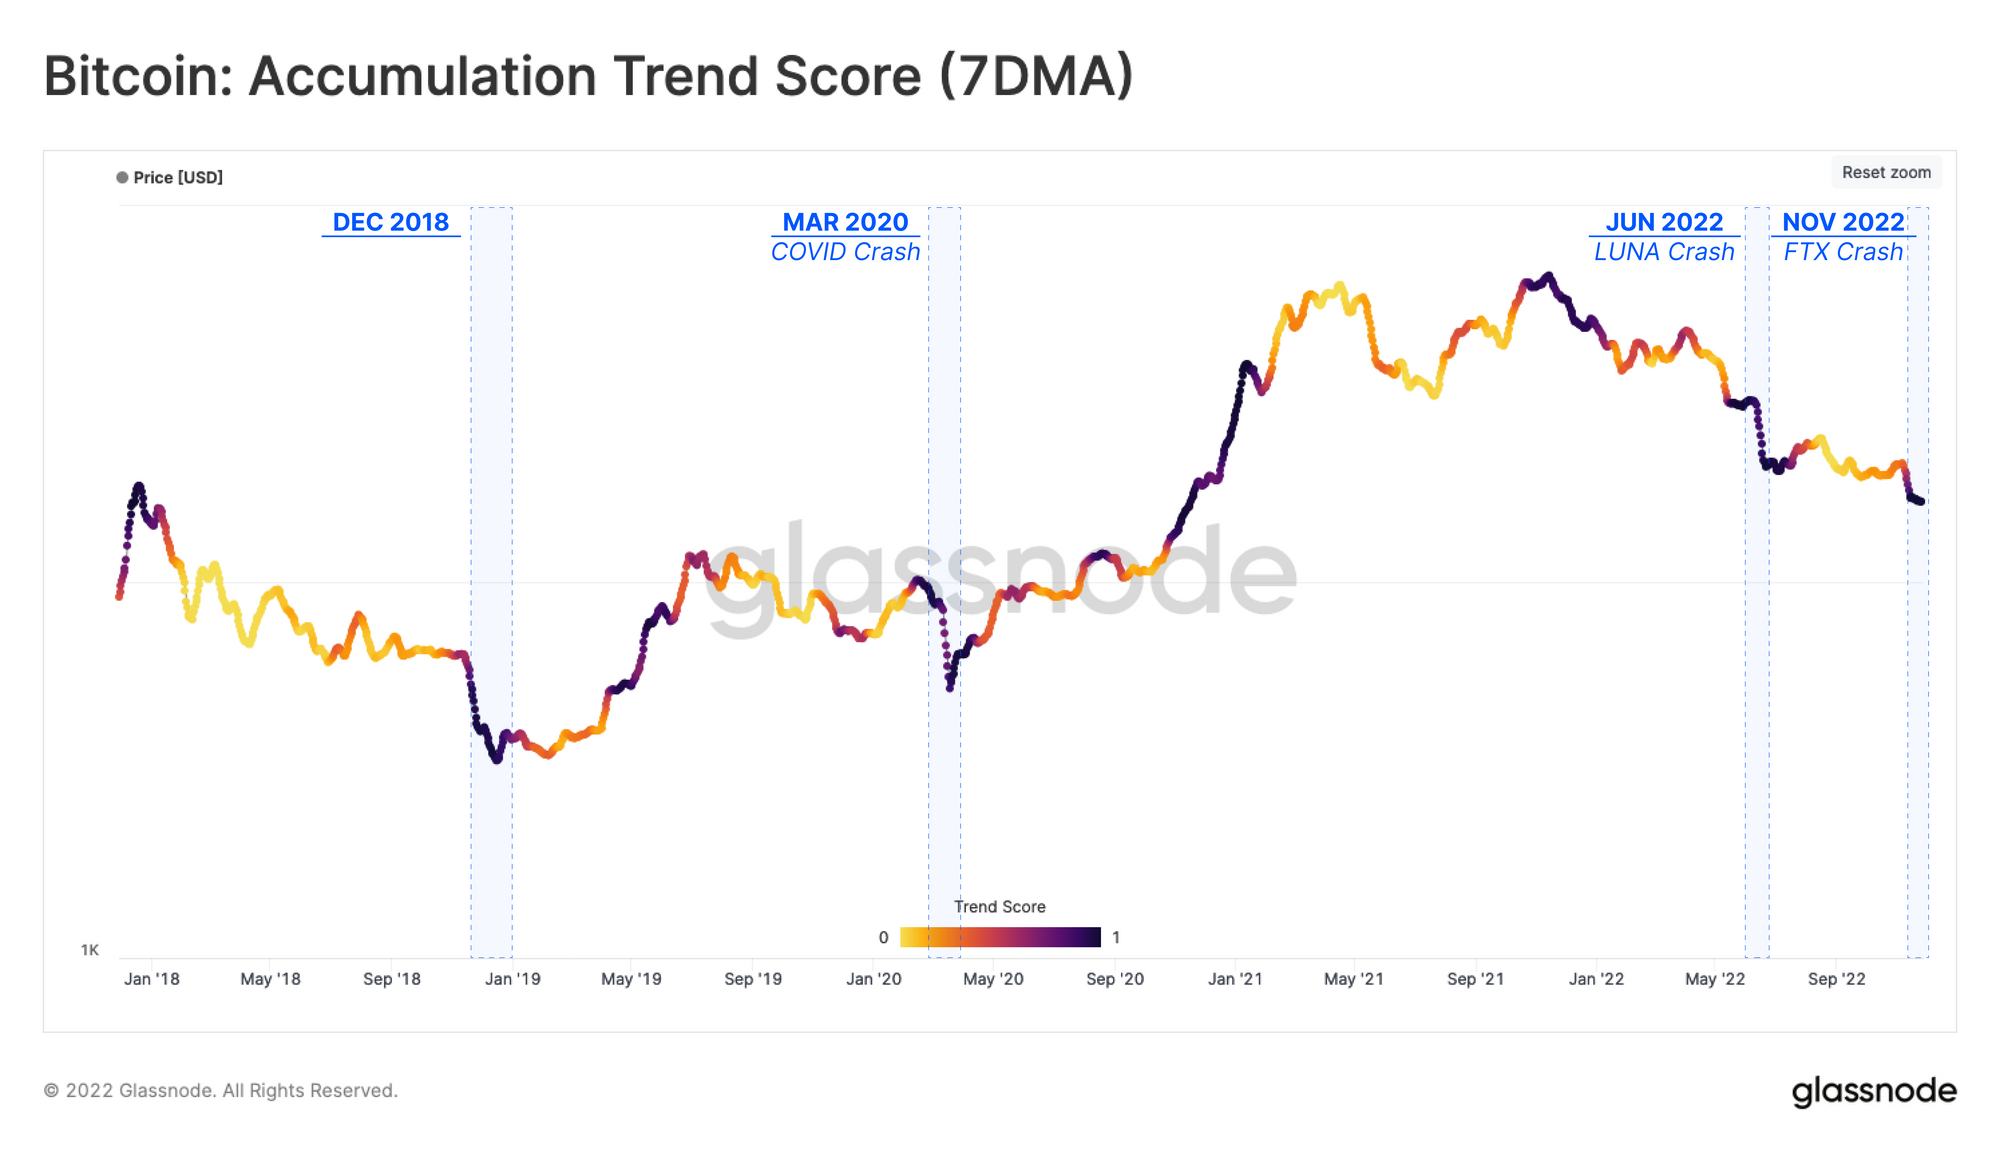
The price of BTC has been trading below the Realized Price ( the cost-basis of the wider market) for over 4.5 months. This has historically correlated with the bottom discovery phase, which can often be visualized and assessed using the Accumulation Trend Score metric.

This tool indicates the relative balance change of entities over the last 30 days, with the scale representing both the size of the balance change and its direction (accumulation to distribution).

  • Values approaching 1 🟣 signify that a large portion of the Bitcoin network has been accumulating coins and meaningfully increasing their balance.
  • Values approaching 0 🟡 signify that a large portion of the Bitcoin network has been distributing coins and meaningfully decreasing their balance.

From a comparative point of view, the recent strong accumulation score following the recent sell-off resembles that of late 2018. This behavioral shift can be seen immediately following many major sell-off events, including:

  • November -December 2018 50% sell-off
  • March 2020 COVID Crash
  • May 2022 LUNA collapse
  • June 2022, when the price first fell below $20k
Live Advanced Chart

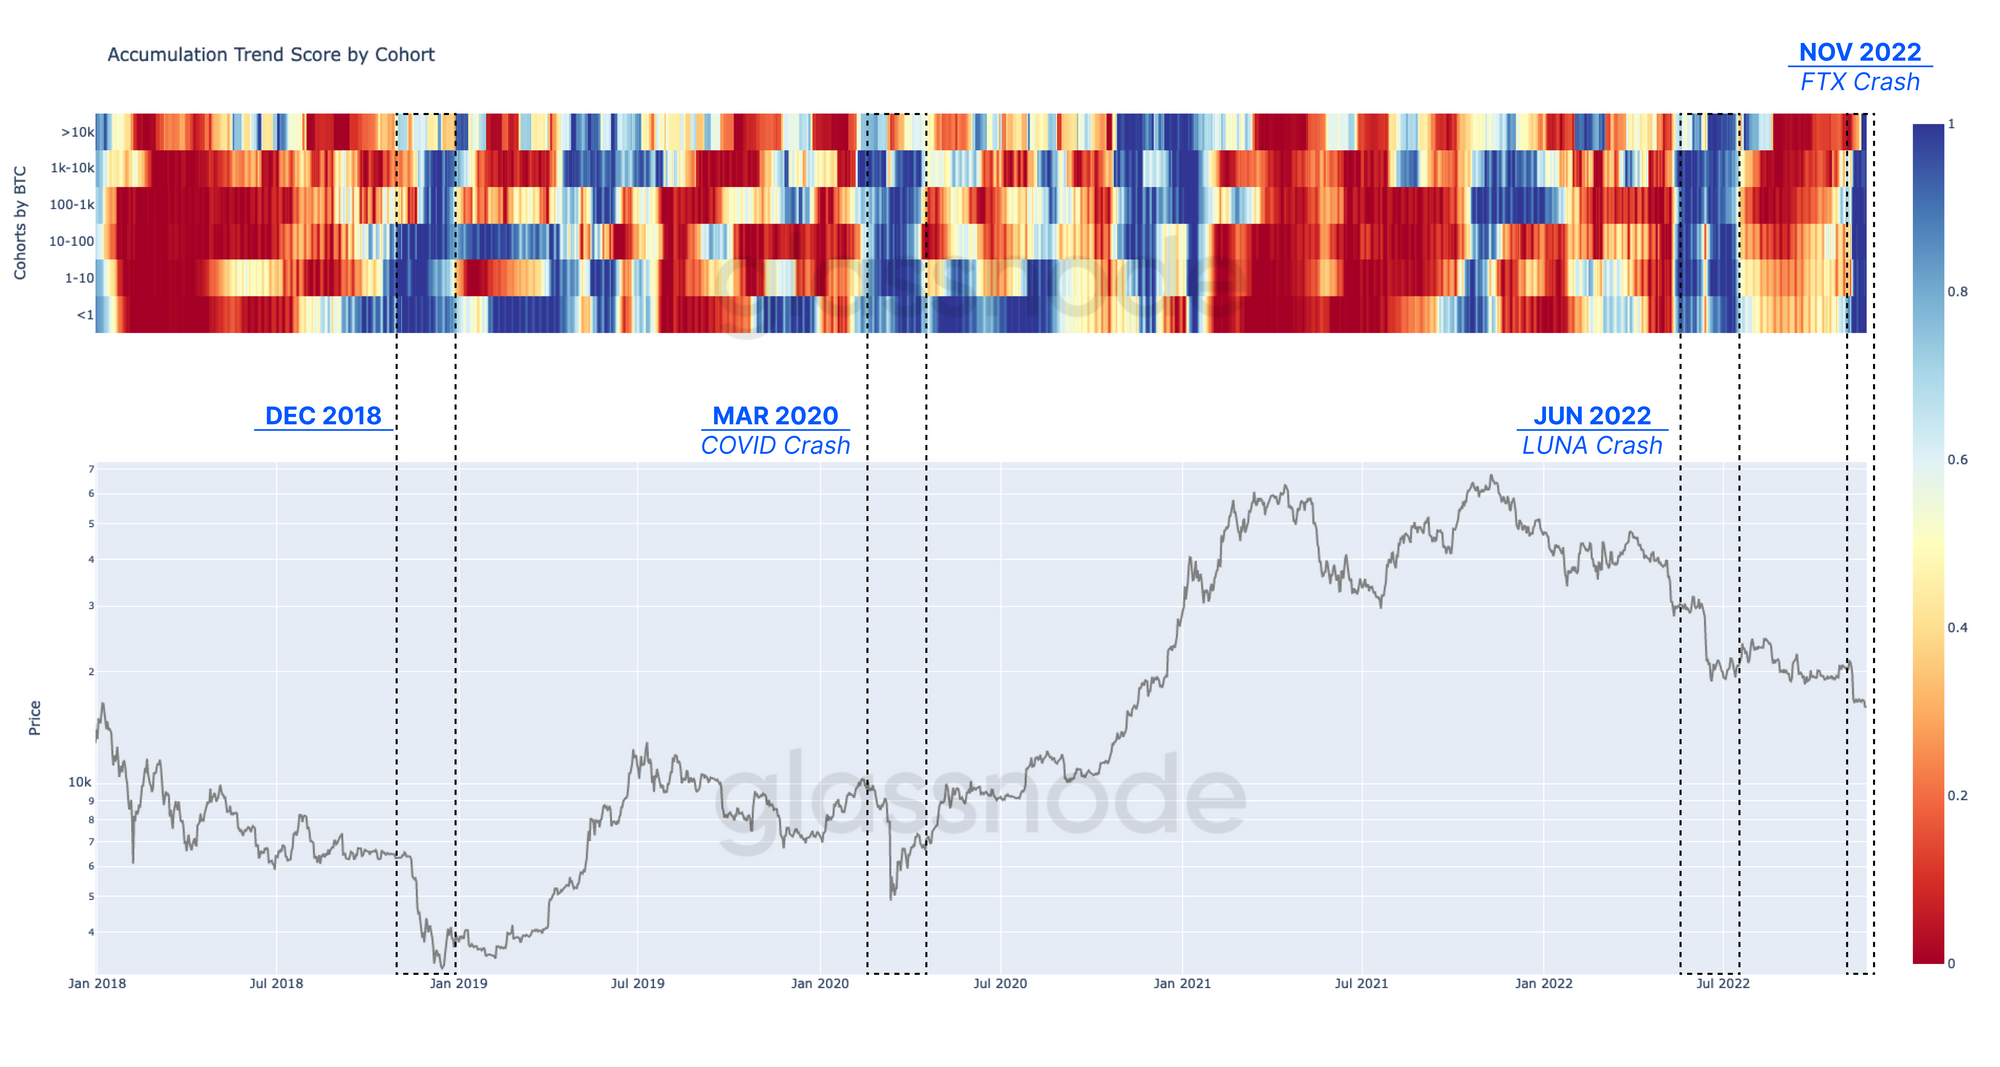
We can break down which specific entities are participating by leveraging the Accumulation 🟦 (and Distribution 🟥) Trend Scores by wallet cohort.

Inspecting the following chart illustrates that almost all cohorts have shifted towards accumulation 🟦 after the recent price contraction. This is a signal of both a perceived opportunity to buy but also a widespread move of coins away from exchanges and towards self-custody (as discussed in WoC 46).

A similar period of widespread accumulation can be observed after all aforementioned sell-off events.

Live Professional Chart

More detailed investigation of various wallet size cohorts can be supplemented with two recently published Glassnode dashboards:

  • Address Cohorts (Advanced): showing the total number of addresses and 30-day change of cohort numbers.
  • Entities Balance Change (Professional): showing the net holdings and 30-day balance change.

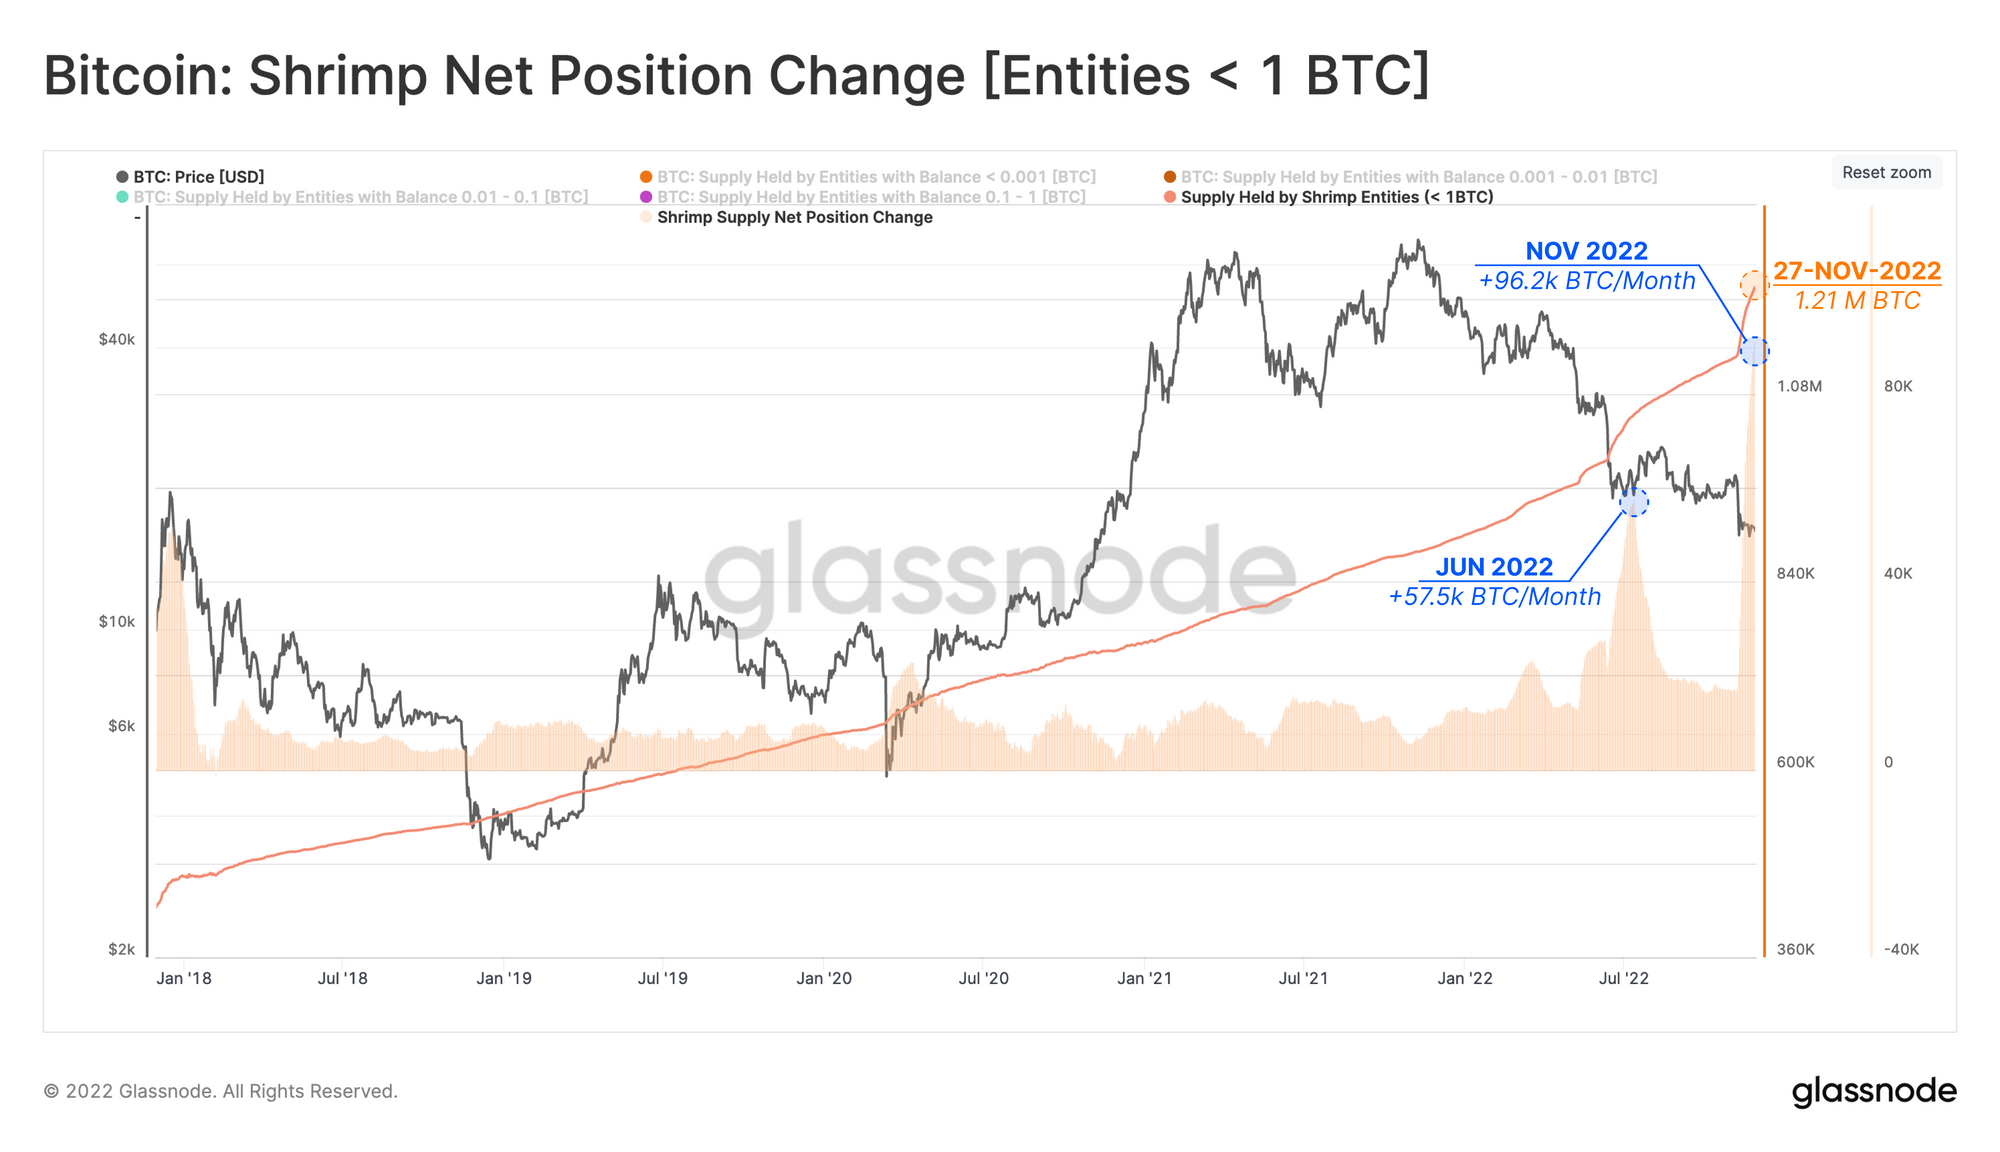
Among all cohorts, the entities holding < 1 BTC (also labelled as Shrimp 🦐) have recorded two distinctive ATH waves of balance increase over the last 5-months. Shrimps have added +96.2k BTC to their holdings since the collapse of FTX, and now hold over 1.21M BTC, equivalent to a non-trivial 6.3% of the circulating supply.

Live Professional Workbench

Translations

This Week On-chain is now being translated into Spanish, Italian, Chinese, Japanese, Turkish, French, Portuguese, Farsi, Polish, Arabic, Russian, Vietnamese and Greek.

The Week Onchain Dashboard

The Week Onchain Newsletter has a live dashboard with all featured charts available here. This dashboard and all covered metrics are explored further in our Video Report, which is released on Tuesdays each week. Visit and subscribe to our Youtube Channel, and visit our Video Portal for more video content and metric tutorials.


New Investors Under Pressure

One consistent event which motivates the transition from a bear back towards a bull market is the dramatic realization of losses, as investors give up and capitulate at scale. November has seen the fourth largest capitulation event on record, recording a 7-day realized loss of -$10.16B. This is 4.0x larger than the peak in Dec 2018, and 2.2x larger than March 2020.

Live Advanced Workbench

This financial stress can also be examined from the perspective of newer investors. By observing the relationship between the cost basis of Short-Term Holders and the Spot Price, the following pattern can be observed throughout Bitcoin cycles.

  • Bull Market 🟦: As price appreciates, the average acquisition price of newly purchased supply is consistently in profit (STH-Cost Basis < Spot Price)
  • Bear Market 🟥: Steady price depreciation results in the new investors' cost basis being above spot prices (STH-Cost Basis > Spot Price)

With the STH-Cost Basis currently at $18.83k, the average recent buyer is underwater by -12%.

Live Professional Workbench

Further analysis of the STH cost-basis during bear markets can therefore produce a compass for tracing the transition phase to bull markets.

  • Pre-Bottom Discovery (A) 🟦: Throughout the early stages of a bear market, the aggregated cost basis of all investors remains well below the spot price, as most investors remain profitable (Spot Price > Realized Price).
  • Bottom Discovery (B) 🟧: after an extended bearish trend, eventually, the market reaches complete capitulation, and the spot price falls below the Realized Price.
  • Floor Discovery (C) 🟥: As the market experiences a significant sell-off, and sellers approach exhaustion, heavy distribution is met with equal accumulation by others. This drives the STH Cost Basis below the Realized Price, signifying recent buyers have a superior entry to the average holder.
Live Professional Workbench

In the aftermath of FTX price action, this final description of market structure has occurred 🟥, signalling a very significant volume of coins have now changed hands, at substantially discounted prices.

We can also quantify the size of the Unrealized Loss relative to the market size. Relative Unrealized Loss measures the aggregated loss still held by the wider market, compared to the total market capitalization.

Tracking the weekly average of this indicator shows that at extreme points of prior bear markets, investors were shouldering a loss in excess of 50% of total market cap at the time. This metric has recently peaked at 56%, which is the highest for this cycle, and comparable to prior bear market floors.

Live Advanced Chart

Peak Under-performance

The Adjusted MVRV Ratio is a tool which discounts the profit held in dormant or lost supply (coins unmoved for > 7yrs). Values above 1 indicate that the ‘Active Market’ is in aggregate profit, whilst values below 1 denote the market is underwater.

This metric is currently returning a value of 0.63 (average unrealized loss of 37%), which is very significant since only 1.57% of trading days in bitcoin history have recorded a lower Adjusted MVRV value. In other words, if we discount profit held across the presumably lost supply, the current market is the most underwater it has been since the near pico-bottom set in Dec 2018 and Jan 2015.

Live Advanced Workbench

Not only is the unrealized loss still held in the market historically large, the realized losses have also been historic in magnitude. Here we use the aSOPR metric, which measures the average spending-to-acquisition price for all coins that moved today. Therefore, values above 1 signal dominant profitability, while values below 1 indicate an aggregate loss.

The chart below compares the weekly average of aSOPR 🔵 against the High🟢 and Low 🔴 bands that reflect a 2-standard deviation move in aSOPR.

The recent market reaction to the FTX sell-off manifested as an aSOPR reading which broke below the low band for the first time since March 2020. The significance of this event is again only comparable with the COVID crash, and the capitulation of the market in December 2018.

Live Advanced Workbench

The chart below shows the 7-day Cumulative Net Realized Profit/Loss, denominated in BTC for comparison between cycles. Remarkably, over the last week, the market realized a net loss equal to -521k BTC, which is again close to the all-time largest recorded in history.

Comparing the current Cumulative Net Realized Loss to the COVID and LUNA Crash, with 44% and 39% price decline respectively, the market has shown a larger degree of strength during the recent capitulation with only 26% correction.

Live Advanced Workbench

Summary and Conclusions

The FTX fallout has triggered one of the largest capitulation events in Bitcoin history, flushing billions of USD value out of underwater investors. The market remains in a degree of stasis, likely needing time to fully digest recent volatility.

However, the characteristics of this capitulation bear several similarities to the darkest points during the 2018 bear market. This sell-off saw significant statistical deviations outside the mean on investor losses. The current unrealized loss held by the actively traded coin supply is effectively at an all-time-low, rivaling only the very pico-bottoms of the 2015 and 2018 bear cycles.

With such a chaotic year to date, the resolve of Bitcoin holders has been firmly tested to a historic degree throughout 2022. So much so there are barely any precedents. Those few analogues that exist in Bitcoin history, albeit small in sample size, turned out in hindsight to be the points of absolute seller exhaustion.


Translated channels

We are proud to have launched new social channels for:


Disclaimer: This report does not provide any investment advice. All data is provided for information purposes only. No investment decision shall be based on the information provided here and you are solely responsible for your own investment decisions.