Exchanges on the Road to SegWit Adoption: on Pioneers, Stragglers and Holdouts
We take the recent release of Taproot as opportunity to investigate ways to measure the adoption of SegWit-related Bitcoin improvements in a meaningful way; simultaneously, we put a spotlight on exchanges and their SegWit adoption.

Scalability is a foundational factor to the success of Bitcoin: the higher the network's transaction rate, the more people can use the network and the lower the fees. It is not surprising then to find the motivation behind many of Bitcoin’s major technical improvements to be improvements to scalability. The effectiveness of such scalability improvements, however, crucially hinges on their adoption by actors in the Bitcoin ecosystem.
In this article, we investigate one of these improvements, SegWit. To this end, we propose a new methodology to accurately measure SegWit adoption of individual entities on the Bitcoin network. We apply this new methodology and carry out a case study shine a light on the state of SegWit adoption by exchanges. Exchanges were chosen because, for single entities, they have disproportionate on-chain footprints: today exchanges are responsible for about 40% of all consumed block space. This makes them high-value targets for analysis as their stance toward SegWit has a significant impact on Bitcoin's scalability. We find that a large majority of exchanges has not managed to fully adopt SegWit yet—including Binance, which is single-handedly responsible for consuming about 15% of Bitcoin block space.
In line with this article, we are releasing the following SegWit- and transaction-related metrics in Glassnode Studio:
SegWit adoption vs. utilization
Background
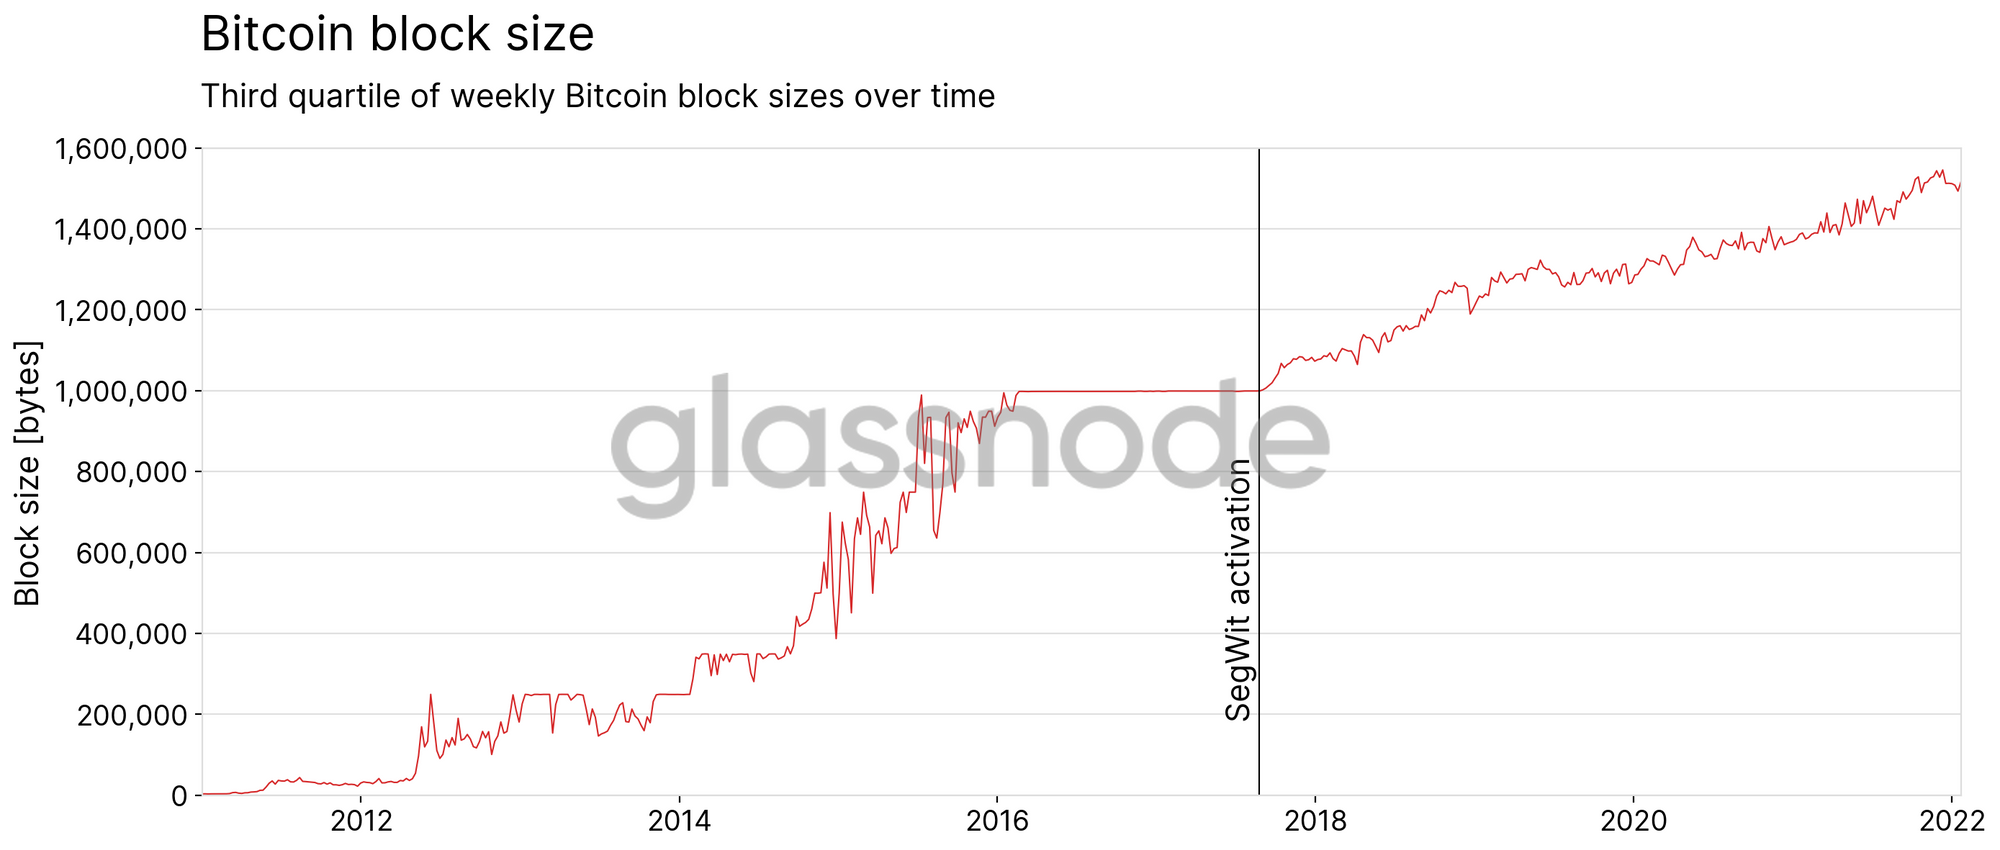
SegWit, short for Segregated Witness, is a Bitcoin protocol extension that was activated on the network in August 2017. The primary rationale for SegWit was to improve the scalability of the then often-congested Bitcoin network (Figure 1 shows how blocks were constantly running into the 1MB block size limit before SegWit was activated). To this end, SegWit addresses two key variables that govern transaction throughput on the Bitcoin network: transaction size and block size. SegWit enables both smaller transactions, allowing to fit more transactions into a fixed amount of block space, as well as overall larger blocks, thereby enabling even more transactions per block.
SegWit adoption
Actual scalability improvements, however, crucially hinge on SegWit adoption: if people do not upgrade their systems and phase out pre-SegWit output types in favor of SegWit's more efficient ones, transaction throughput on the network will not improve significantly. For this reason, the Bitcoin community has been closely monitoring SegWit adoption using on-chain data.
The community-established method of measuring adoption works as follows. If a transaction spends at least one SegWit output, the transaction was provably created by SegWit-ready software, thereby providing an unmistakable adoption signal. SegWit adoption is then expressed as the share of the such SegWit transactions out of the number of total transactions (for example, if during a day there are 200,000 SegWit transactions out of a total of 300,000 transactions, SegWit adoption would be 66%).
SegWit utilization
While the community-based approach of measuring adoption on the transaction-level is valid, it is ill-suited to measure the degree of SegWit usage on the entity- or network-level. Figure 2 illustrates the problem.
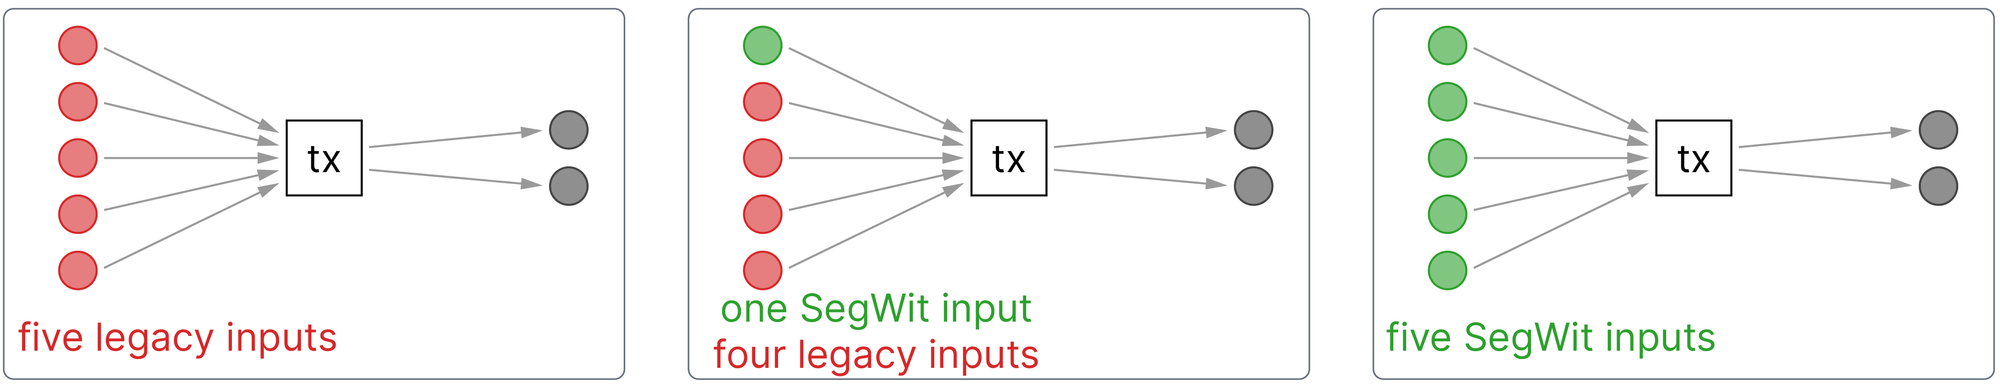
According to the SegWit adoption metric, the transaction shown in the left frame of Figure 2 would be categorized a non-SegWit transaction because it does not spend any SegWit inputs; the transactions in the center and right frames, on the other hand, do spend SegWit inputs, so they would be classified as SegWit transactions.
To wit, when viewed through the lens of SegWit adoption, information about the degree of SegWit utilization inside transactions is lost, and the transactions shown in the center and right frames become indistinguishable. For a theoretical block containing only the three transactions shown in Figure 2, adoption according to the SegWit adoption metric would be 66%, as two out of three transactions use SegWit.
With the SegWit adoption metric, it thus becomes easy to mistake a large share of SegWit transactions on the network for a large share of SegWit usage, when in fact the majority of inputs spent in SegWit transactions might remain of the inefficient legacy type. Hence, to avoid such misinterpretation, the SegWit adoption metric should not be used to measure the degree of SegWit usage.
We believe any meaningful measure of entity- or network-level SegWit usage must take transaction inputs into account. To this end, we propose a new metric called SegWit utilization, which quantifies the degree of SegWit usage in the Bitcoin network by relating the number of spent SegWit outputs to the number of overall spent outputs. For the hypothetical block containing the three transactions from Figure 2, SegWit utilization would be 40%, as six out of fifteen spent outputs use SegWit. This number is significantly lower–and more precise–than the 66% estimate suggested by the SegWit adoption metric.
To get a better idea of the difference between the two metrics for real-world data, consider Figure 3, which contrasts SegWit adoption and SegWit utilization for the Bitcoin network as a whole.
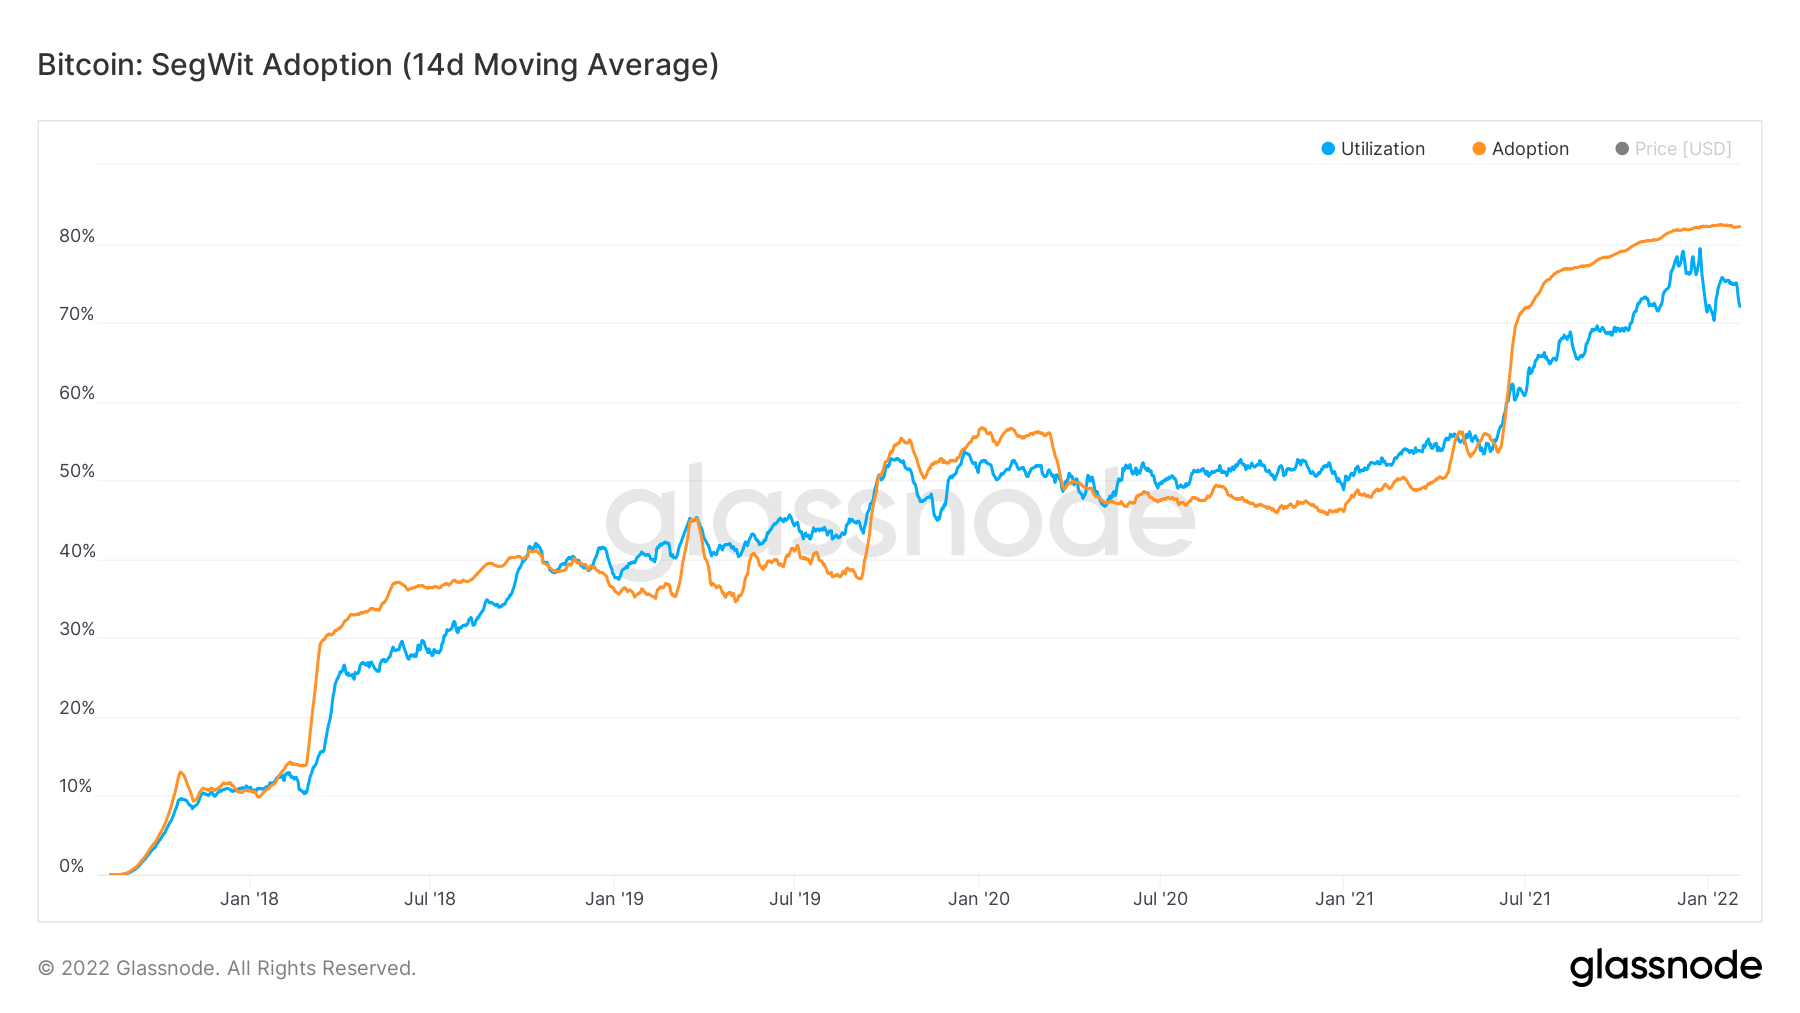
Although both metrics are qualitatively identical, at times different metrics are leading or lagging, and over- or undershoot. The real value of the utilization metric, however, becomes apparent when applying it to single entities. To this end, Figure 4 contrasts SegWit adoption and SegWit utilization for transactions created by the Luno and Binance exchanges.
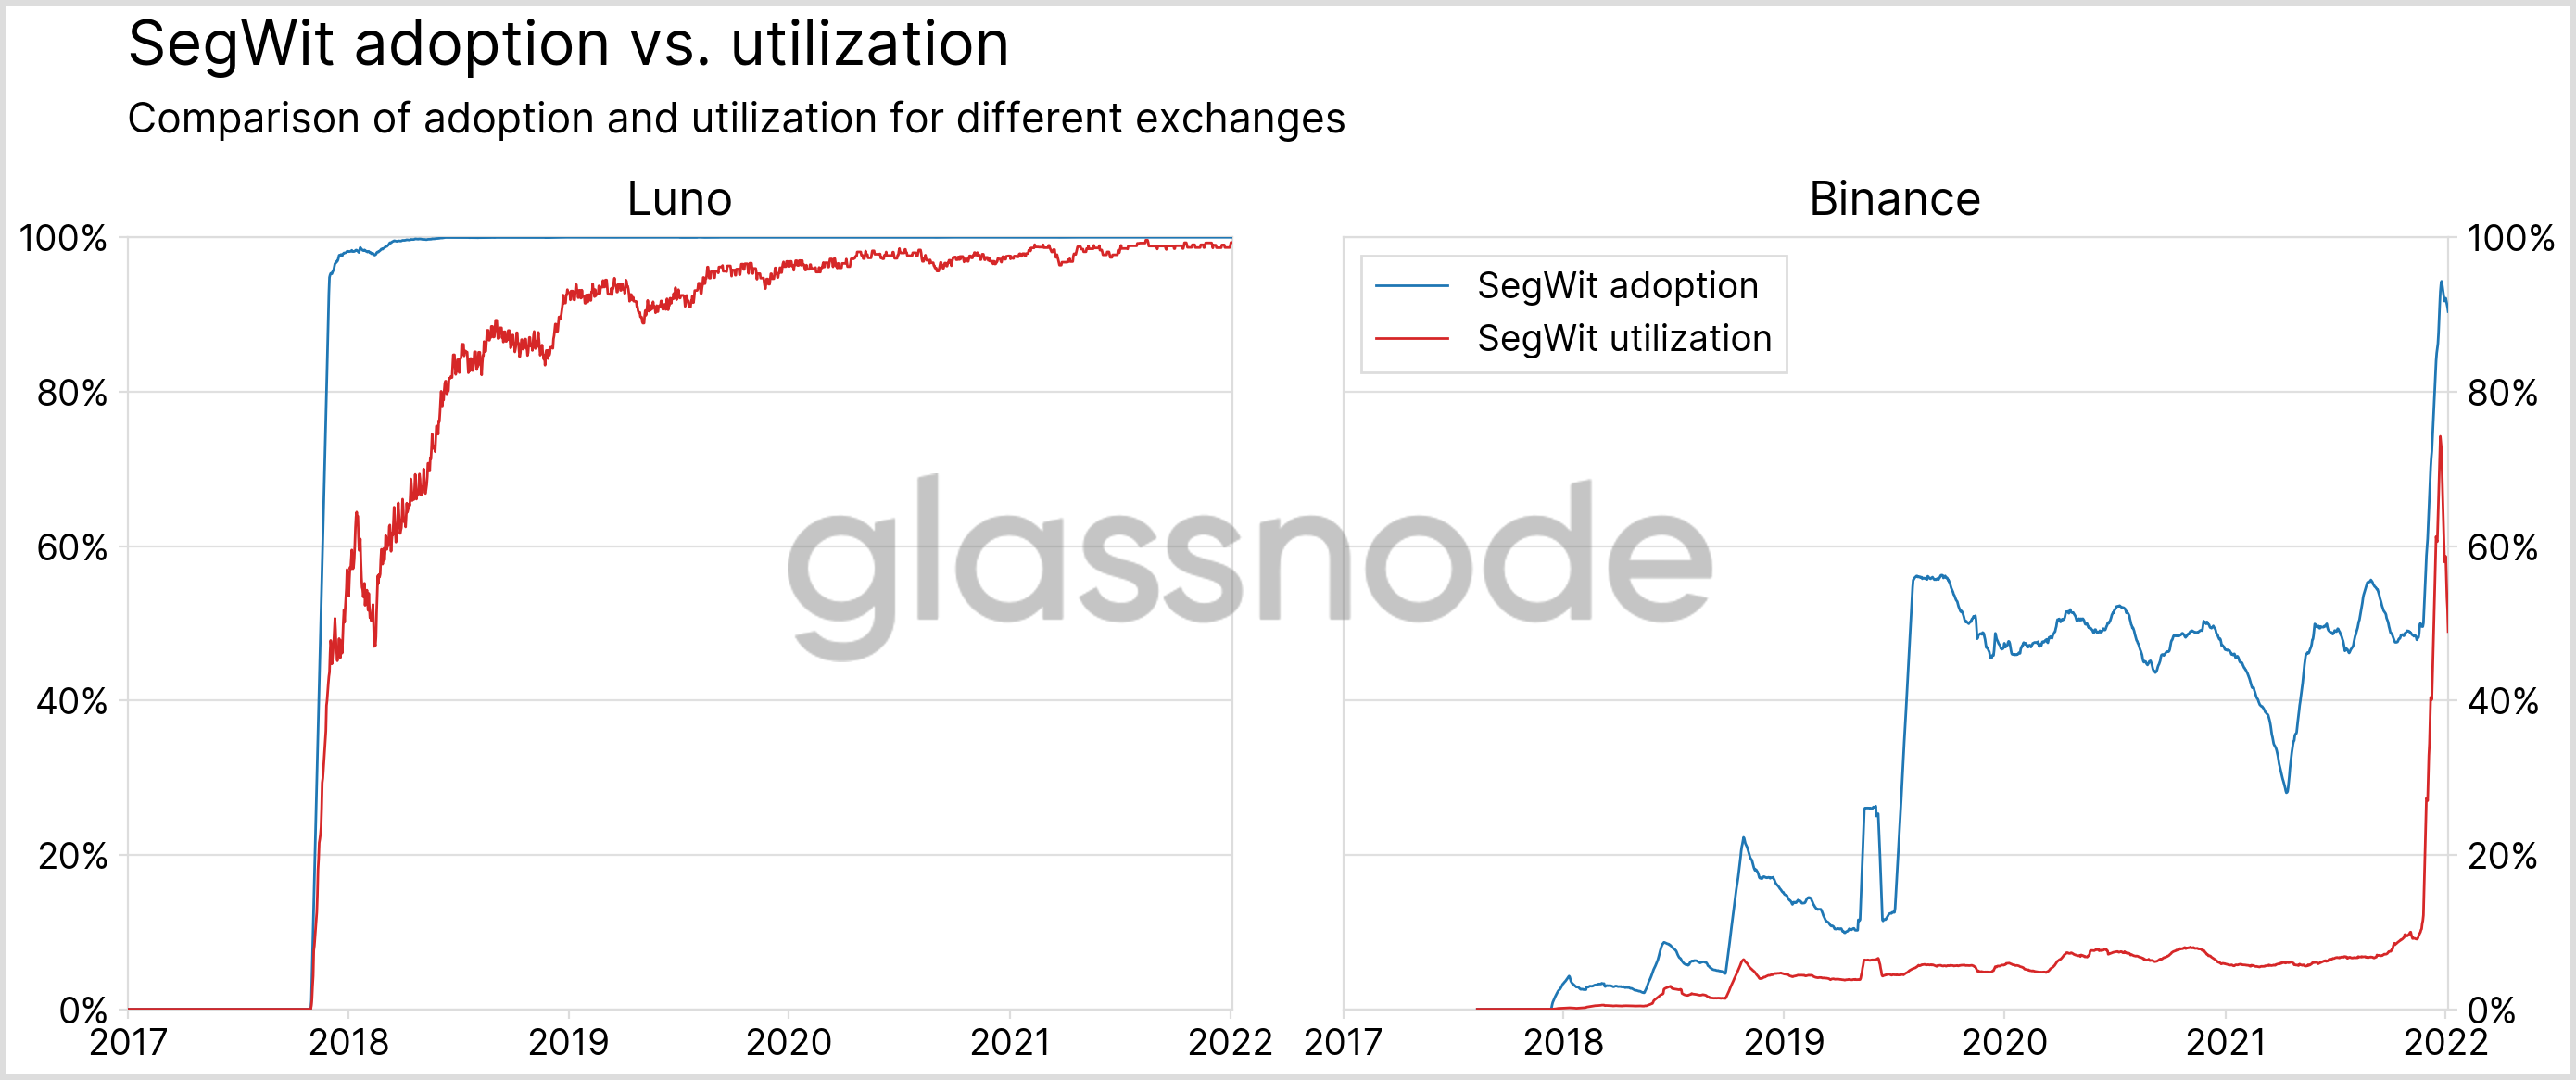
In case of Luno, the SegWit adoption metric presents pretty much a black-and-white picture: zero SegWit usage until late 2017; then, suddenly, full adoption. SegWit utilization, on the other hand, adds some color and reveals that while Luno's SegWit adoption started in late 2017, it actually took some years of gradual improvement to get close to full adoption. For Binance, the advantage of SegWit utilization is even more apparent: while, from 2020-2021, the SegWit adoption metric puts adoption at 50% (overestimating SegWit usage in Binance transactions by a factor of five), the SegWit utilization metric asserts that only about one in ten inputs spent by transactions created by Binance during that time used the efficient SegWit format.
This practical comparison of both metrics using on-chain data evidences that the SegWit adoption metric cannot provide meaningful estimates of SegWit usage on the network level or for single entities; instead, such estimates should be based on the newly introduced SegWit utilization metric. In the following, we first establish exchanges as top consumers of bitcoin block space, and then apply the SegWeg utlization metric to gain insights into the state of SegWit adoption of exchanges.
SegWit and Exchanges
A quantitative meditation on block space consumption by exchanges
Relying on Glassnode's cutting-edge clustering to reliably identify exchange addresses, the block space consumed by exchanges during a given day is determined as follows:
- First, of all transactions occurring on a given day, those representing deposits to, and withdrawals from exchanges are identified, as well as transactions corresponding to exchange-internal transfers (e.g., moving supply between cold and hot wallets).
- To account for the involvement of multiple exchanges in a single transaction (e.g., a user might use one transaction to deposit Bitcoin to multiple exchanges), the sizes of the previously identified transactions are weighted appropriately and attributed to the corresponding exchanges.
- Finally, to arrive at the share of block space used by each exchange, the exchanges' contributions are divided by total of the used block space on that day.
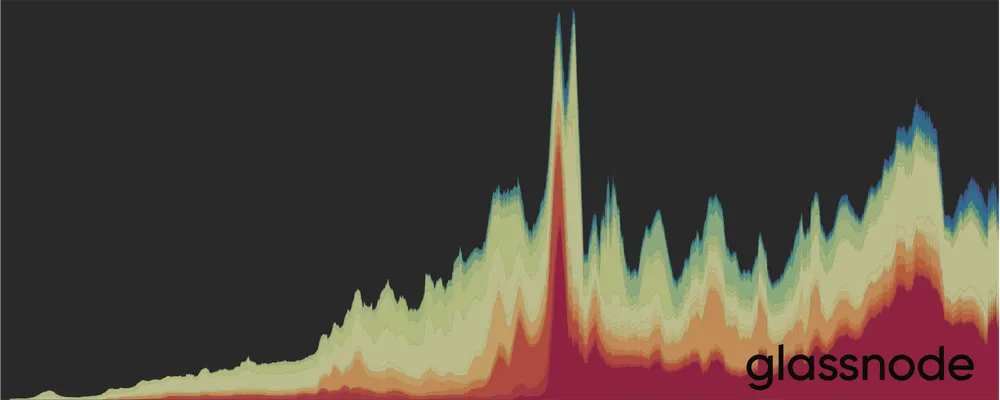
Applying this methodology to historical on-chain data yields the evolution of block space utilization by different exchanges over time, which is shown in Figure 5.
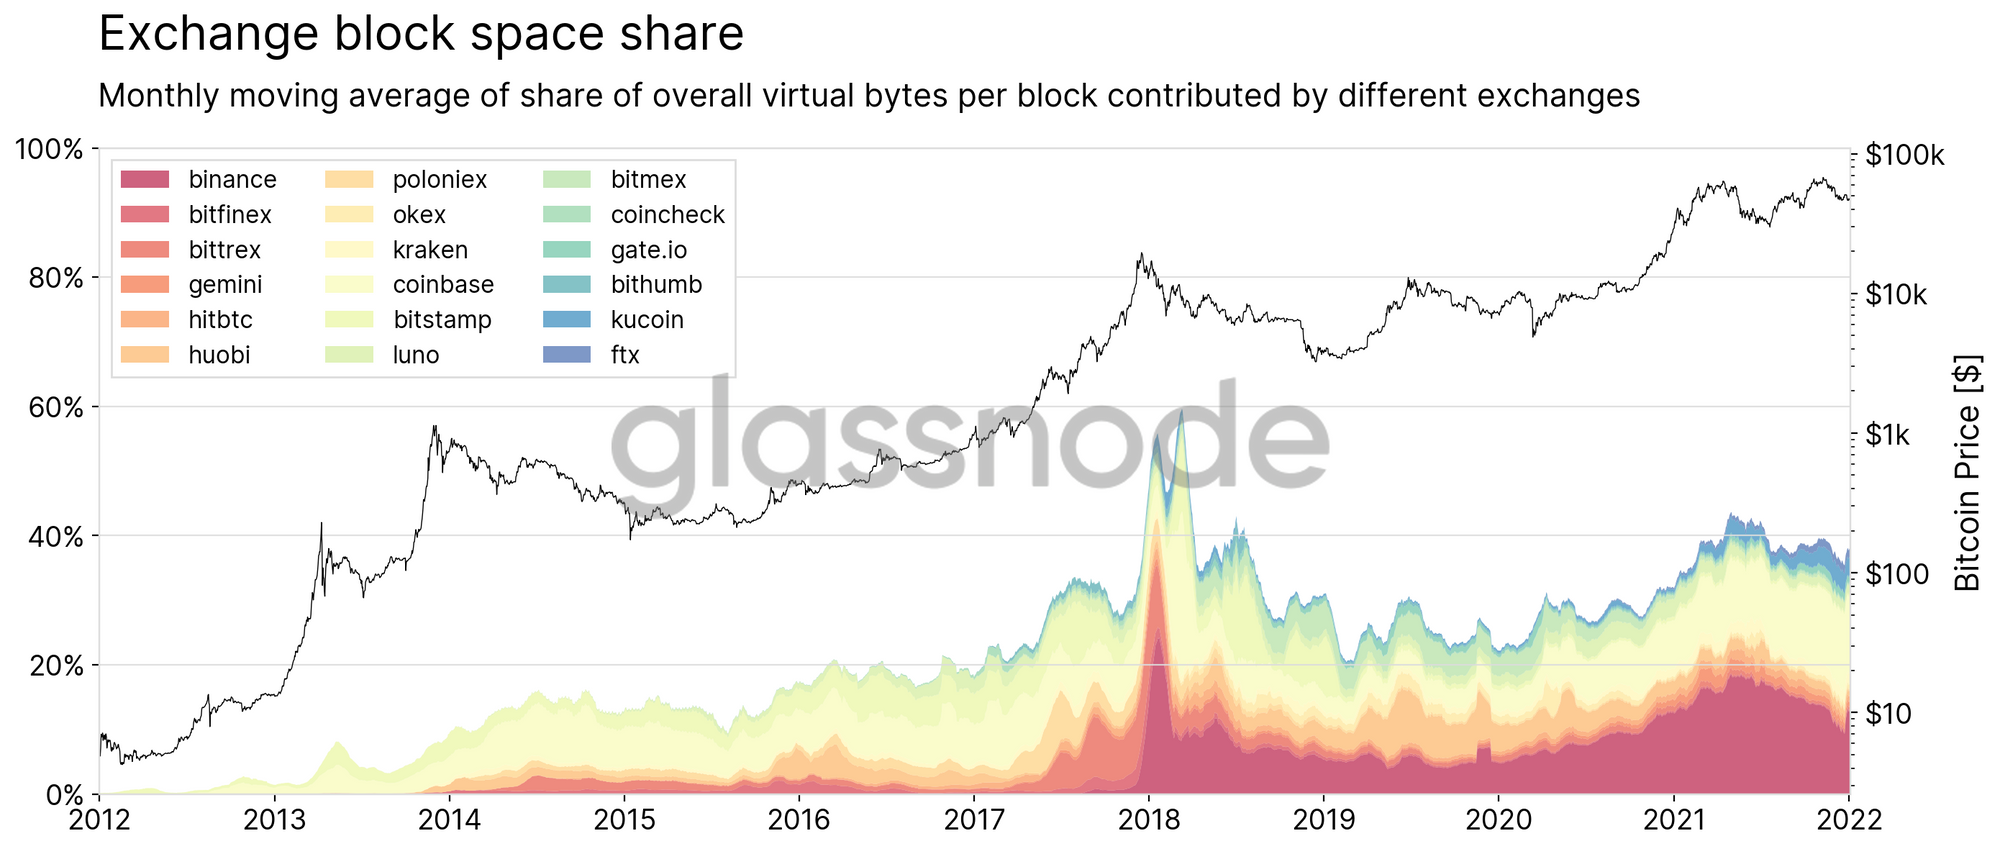
The data enables tree major insights:
- The share of block space used by exchanges exhibits a general upward trend, corroborating the narrative of Bitcoin's pivot toward financial asset.
- During abnormal price events (like the end-of-2017 melt up or the early-2021 bull market), exchanges break and exceed this long-term trend.
- The majority of block space is consumed by a small number of exchanges.
To highlight the last point, Figure 6 ranks exchanges based on their average daily block space utilization over the last year. Binance and Coinbase clearly stand out as top block-space consumers in this Paretoesque distribution. During the last month, Binance and Coinbase alone were responsible for 25% of consumed block space, while all remaining exchanges combined accounted for only 16%.
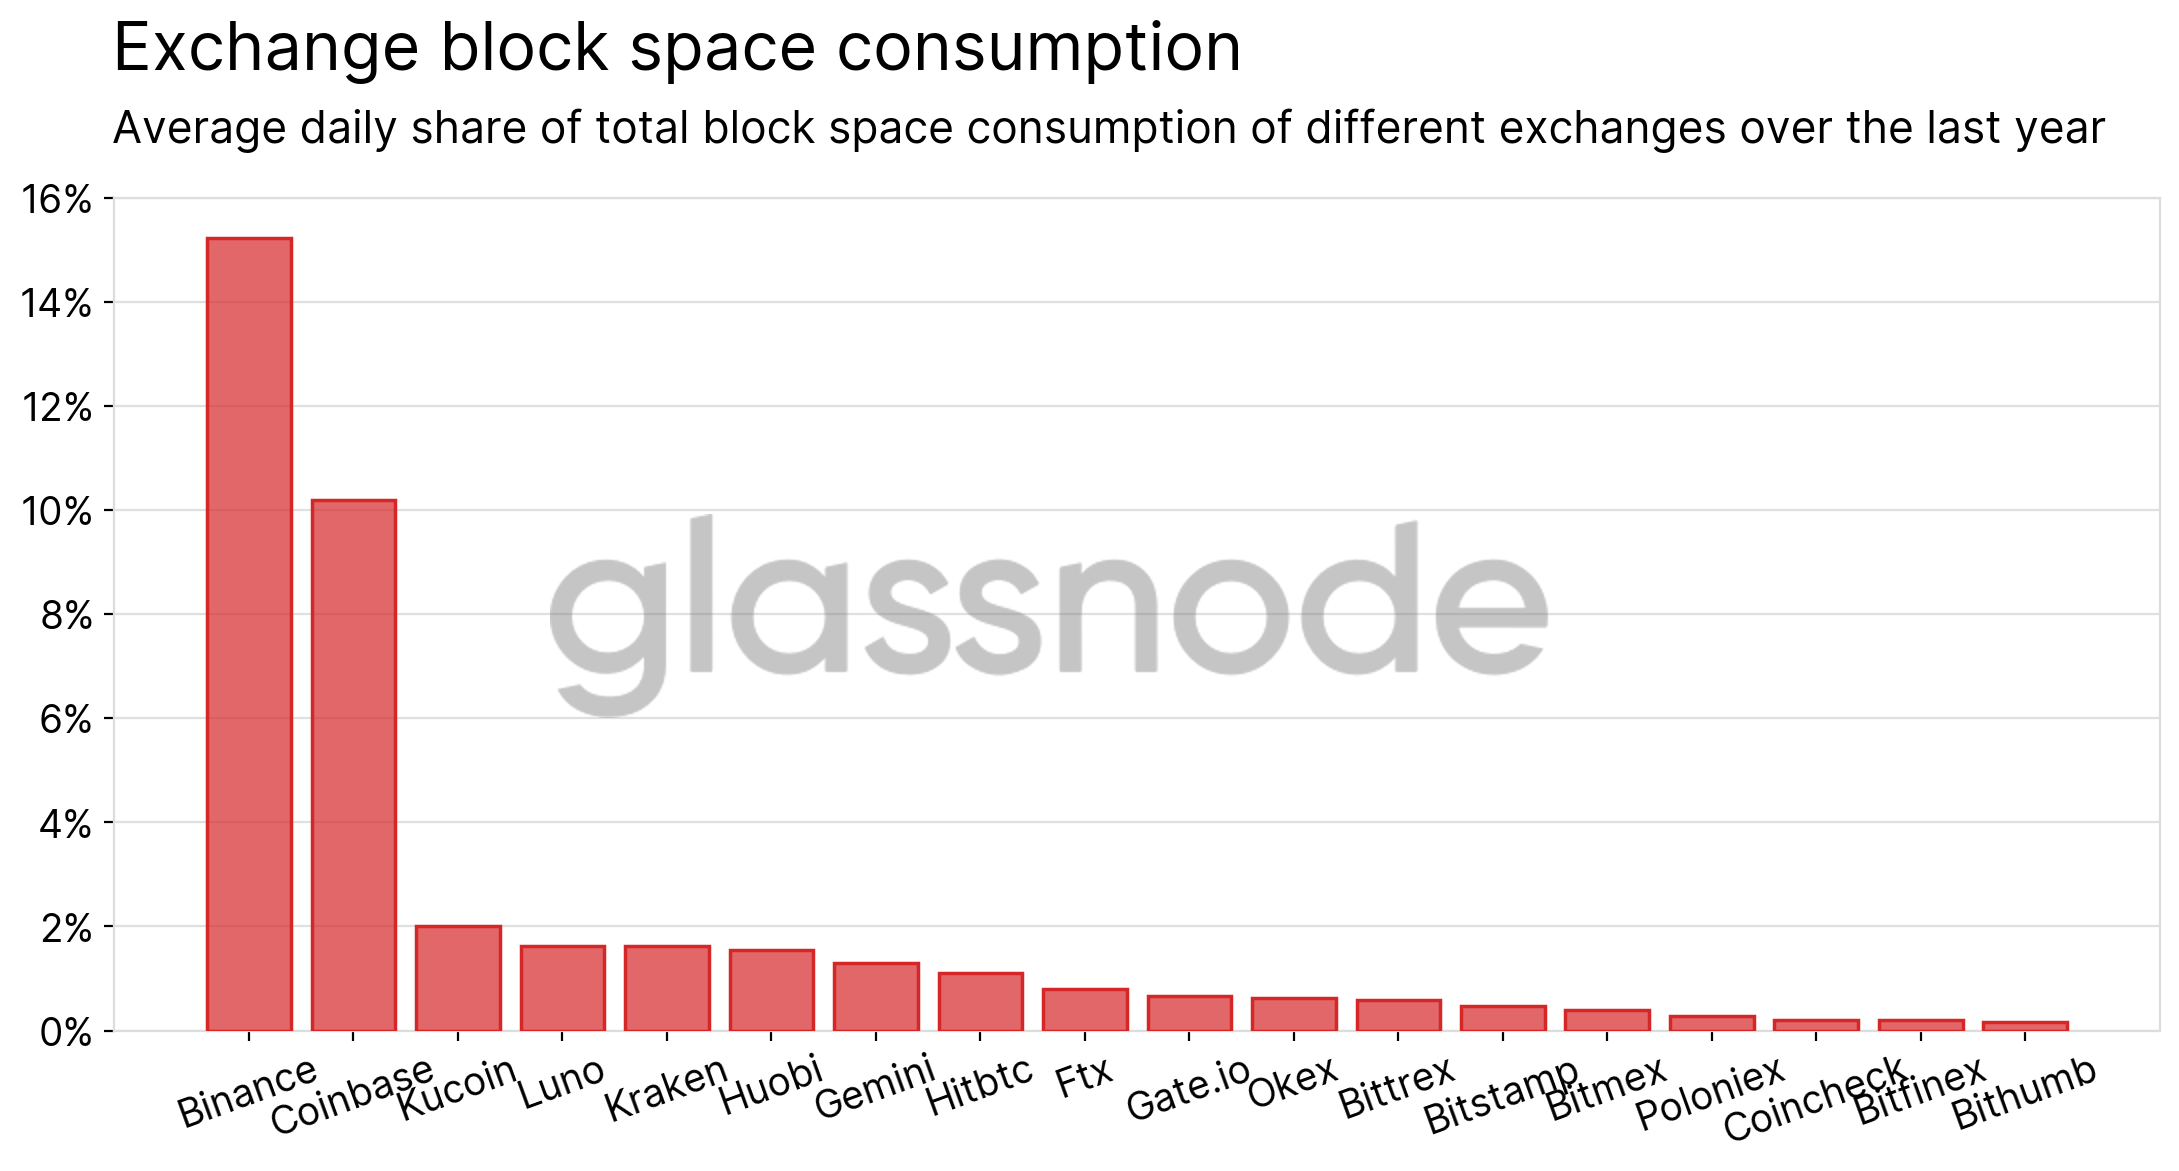
With a total contribution of about 40%, exchanges emerge as prime consumers of Bitcoin block space, making them high-value targets for block-space efficiency analyses.
Pioneers, Stragglers and Holdouts
To get an idea of the current state of actual SegWit adoption across the exchange landscape, the SegWit utilization metric was applied to transactions created during the last month by different exchanges. Figure 7 shows the outcome of this analysis, ranking exchanges by adoption, and sorting them into three categories: Pioneers, showing more than 90% adoption; Stragglers, exhibiting adoption rates between 20-90%; and Holdouts, with adoption rates below 20% that clearly signal their lack of interest in improving transaction throughput on the Bitcoin network.
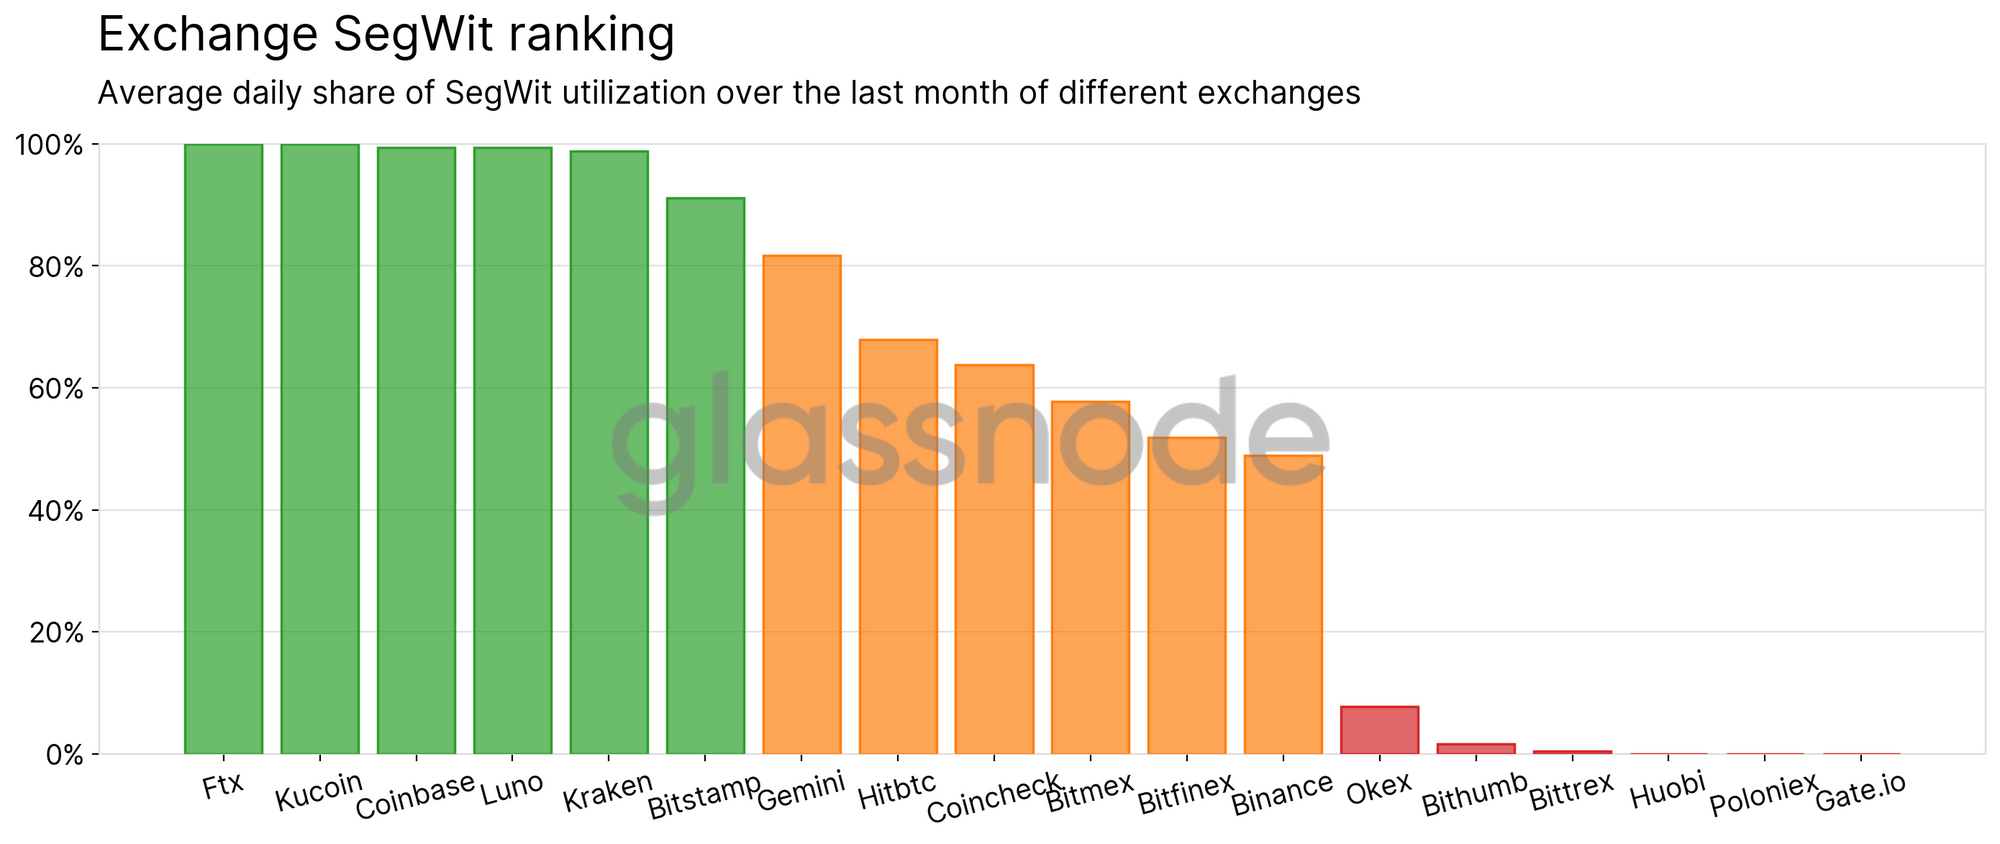
Figure 7 shows that out of the 18 investigated exchanges, only six fall into the Pioneer category, and can be considered to have fully adopted SegWit. It is worth pointing out that Coinbase, which has been previously identified as the second-largest block space consumer among exchanges, is falling into this category; if that weren't the case, the amount of block space consumed by Coinbase would certainly be higher than it already is.
Of the remaining 12 exchanges, six fall into the Straggler category, meaning these exchanges still struggle with SegWit adoption four and a half years after its activation. To better quantify the state of adoption progress and what to expect from exchanges in this category in the future, Figure 8 highlights the evolution of SegWit adoption for these exchanges over time.
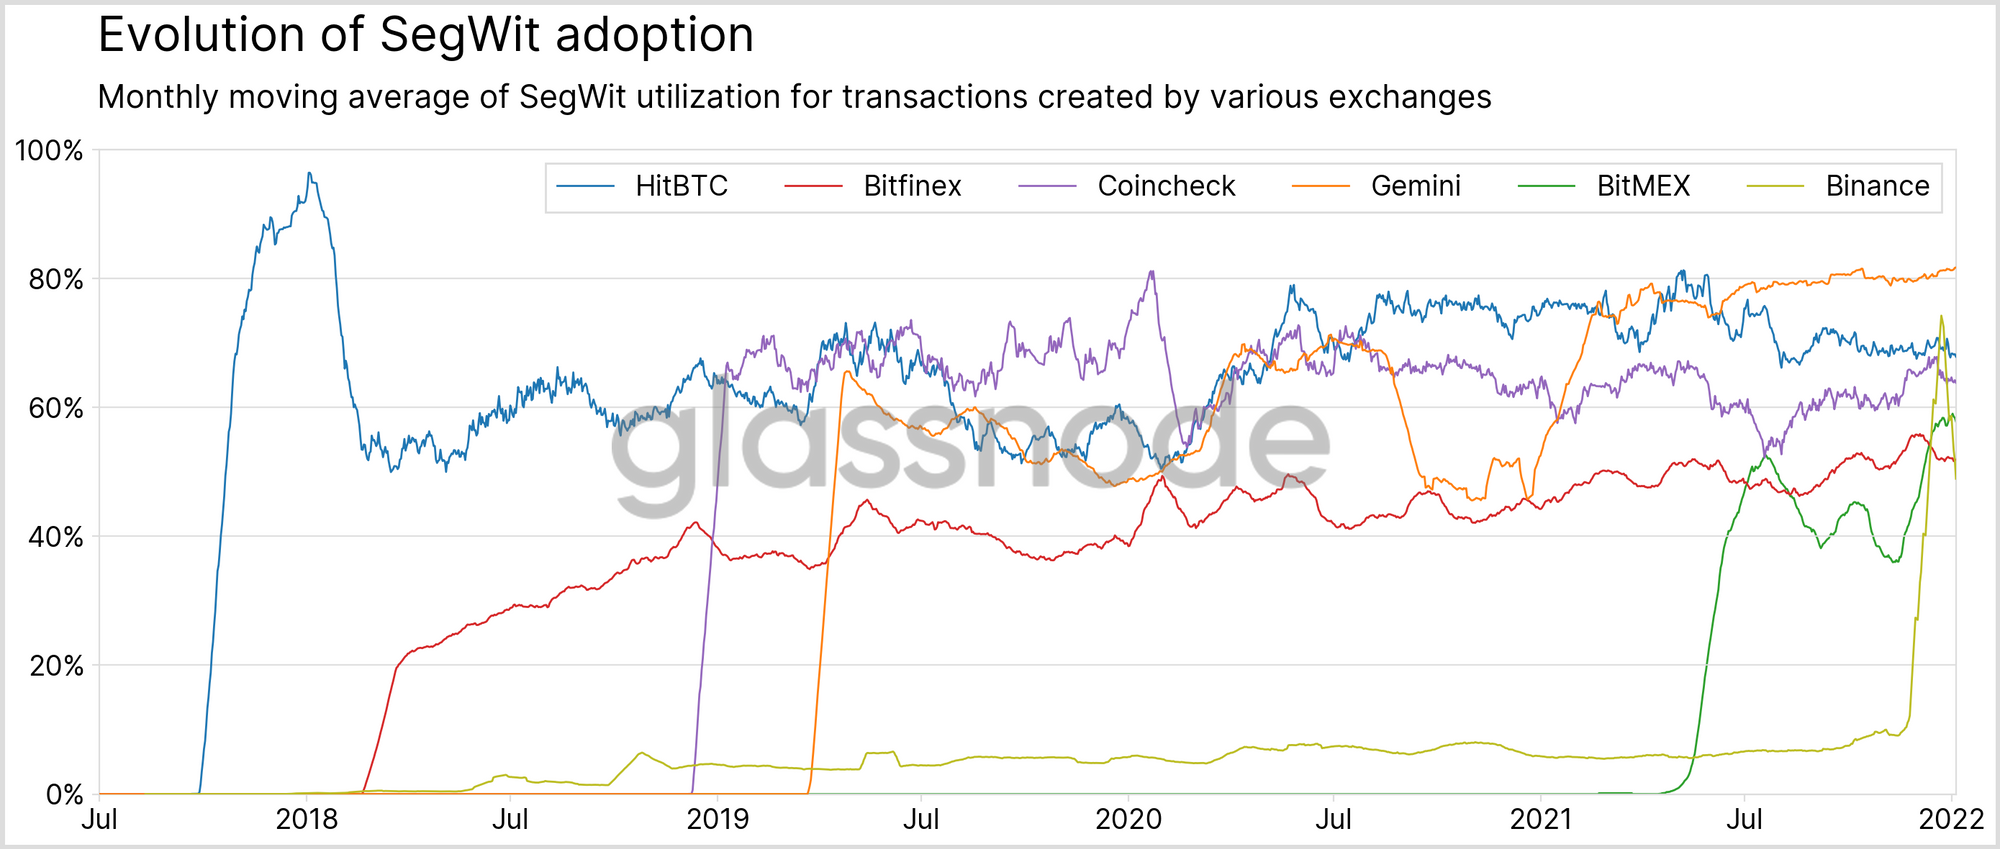
For three of the six exchanges, the data paint a sobering picture: over the last year, adoption of HitBTC, Coincheck, and Bitfinex remained more or less flat at medium adoption levels. Gemini, on the other hand, successfully increased its adoption from 50% to above 80% over the last year. BitMEX, too, although apparently late to the game, has been making a lot of progress over the last year. Perhaps most importantly, Binance, the top block space consumer, seems to finally have made an earnest effort to push SegWit adoption near the end of 2021.
The remaining six exchanges fall into the final category, the Holdouts. With an adoption rate of 7%, OKEx is the only exchange that qualifies as having made at least some nominal attempt to adopt SegWit. The same can not be said about any of the remaining exchanges, who are clearly signaling a lack of interest to upgrade their infrastructure to the benefit of the wider Bitcoin network.
Conclusion
- Today, exchanges are the top consumers of Bitcoin block space. Transactions involving the sending or receiving of funds to and from exchanges, as well as exchanges' internal transactions, occupy roughly 40% of Bitcoin block space.
- Of all exchanges, Binance and Coinbase are the biggest block space consumers by far. Transactions to and from Binance are responsible for about 15% of all block space; those involving Coinbase for around 10%
- The SegWit adoption metric is ill-suited to measure the degree of SegWit adoption of individual entities or the entire network; a better metric for this purpose, SegWit utilization, was introduced
- Using the newly created SegWit adoption metric, we were able to create a snapshot of the true state of SegWit adoption across exchanges: of 18 investigated exchanges, six have fully adoption SegWit; another six are still struggling with adoption; and the final six have made little to no efforts towards adopting SegWit.
- Binance, the top Bitcoin block space consumer, has had trivial SegWit adoption rates of only 10% up until the end of 2021. Although recently, adoption has surged to about 50%, this number seems inadequate, especially when considering that Binance alone consumes around 15% of all Bitcoin block space.
- Coinbase, on the other hand, responsible for 10% of used block space, has already fully adopted SegWit.

- Follow us and reach out on Twitter
- Join our Telegram channel
- Visit Glassnode Forum for long-form discussions and analysis.
- For on–chain metrics and activity graphs, visit Glassnode Studio
- For automated alerts on core on–chain metrics and activity on exchanges, visit our Glassnode Alerts Twitter