Product Update: November 2022


November was a chaotic month for the industry, with the shock waves of FTX still echoing through the space. However, out of this event has launched a new initiative by exchanges for Proof-of-Reserves to enhance transparency.
We are proud to announce our new Proof-of-Reserves metric suite and dashboard, free for all users to help improve transparency across the Digital Asset landscape. A summary of the metrics, content, and product releases for the month are as follows:
- Week-on-Chain Newsletters (4x) covering the implosion of FTX and the subsequent fallout.
- New Metrics in Studio (4x) covering a new suite of Proof-of-Reserve metrics as well as Exchange Netflows by Size.
- Dashboards (6x) including the new Proof-of-Reserve dashboard alongside Entity/Adress activity, Spending Behaviors, HODL Wave Dynamics and an updated Lightning Network dashboard.
- Workbench Constructions (33x) including a multitude of metrics ranging from Exchanges, Lifespan, Miners, Entities and both Market and Economic indicators.
- New Market Pulse Reports (2x) profiling the reaction of Long-Term Holders to the FTX implosion as well as a report analyzing the relationship between financial stress and Stablecoin purchasing power.
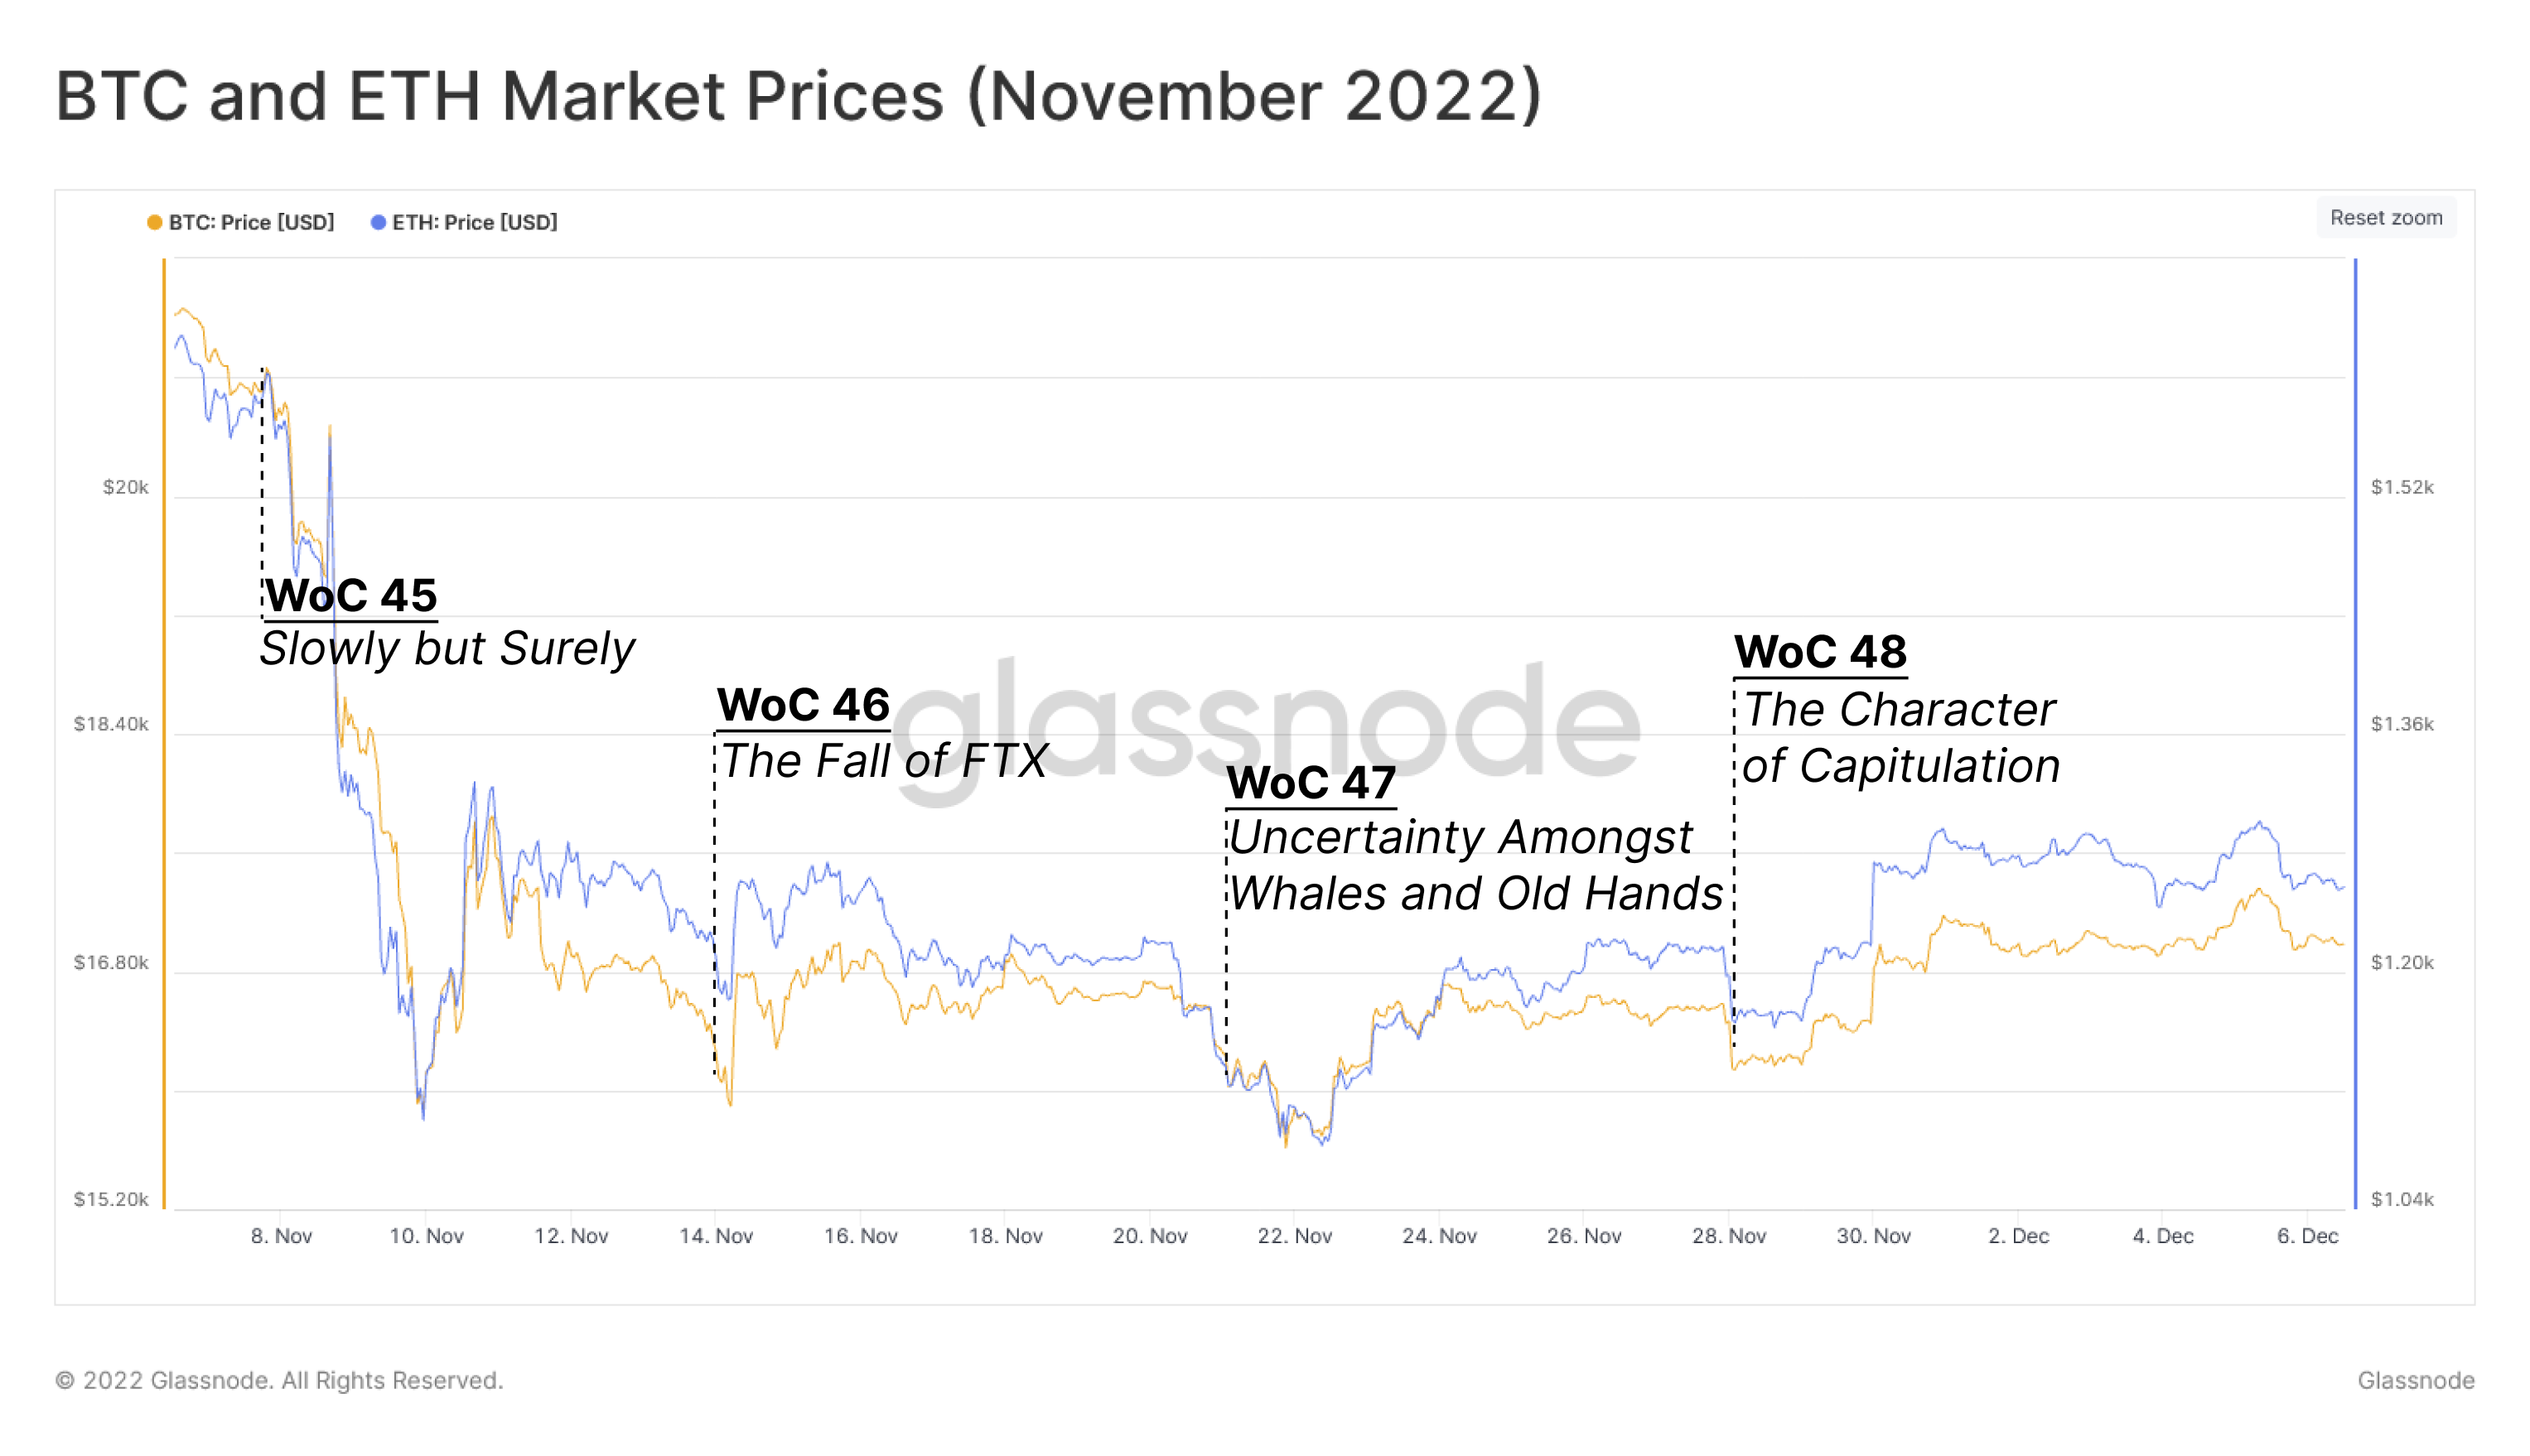
November was a month to remember, as the entirety of the Digital Asset landscape was shaken by the collapse of FTX (WoC 46). This culminated in a collateral unwind of historic magnitude, pushing price action to a new cycle low of $15,661.
Uncertainty loomed large amongst Old hands and Whales alike (WoC 47) as prices fell to levels last seen during the 2018 bull market. Thus motivated a subsection of HODLers into significant unrealized loss. However, it became evident that the brunt of the Long-Term Holder pain was realized by LTHs of the current cycle, locking in losses greater than -60%.
The FTX implosion can be considered one of the largest capitulation events in history (WoC 48). Few analogues match the absolute scale of capital loss experienced within the last 6 months, with the current unrealized loss held by the actively traded coin supply is effectively at an all-time-low. This rivals only the very pico-bottoms of the 2015 and 2018 bear cycles.
The Week On-chain Newsletters Released
- WoC #45: Slowly but Surely (Report, Video)
- WoC #46: The Fall of FTX (Report, Video)
- WoC #47: Uncertainty Amongst Whales and Old Hands (Report, Video)
- WoC #48: The Character of Capitulation (Report, Video)
At Glassnode, we believe data driven insights answer many of our biggest questions across digital asset markets. Thus, we have released a suite of 5x Dashboards which help contextualize, and answer core questions alongside the new Proof-of-Reserves dashboard, free for all users.
- Proof of Reserves - Increasing transparency of exchange balances.
- Entity Balance Change - Net position change by wallet cohorts.
- Address Cohorts - Address counts and monthly change by wallet cohorts.
- HODL Wave Dynamics - Modelling the HODLing behavior over time.
- Spending Dynamics - The spending counterpart to HODL Wave Dynamics.
- Lightning Network - Fundmanetal metrics exploring Bitcoins leading second layer.
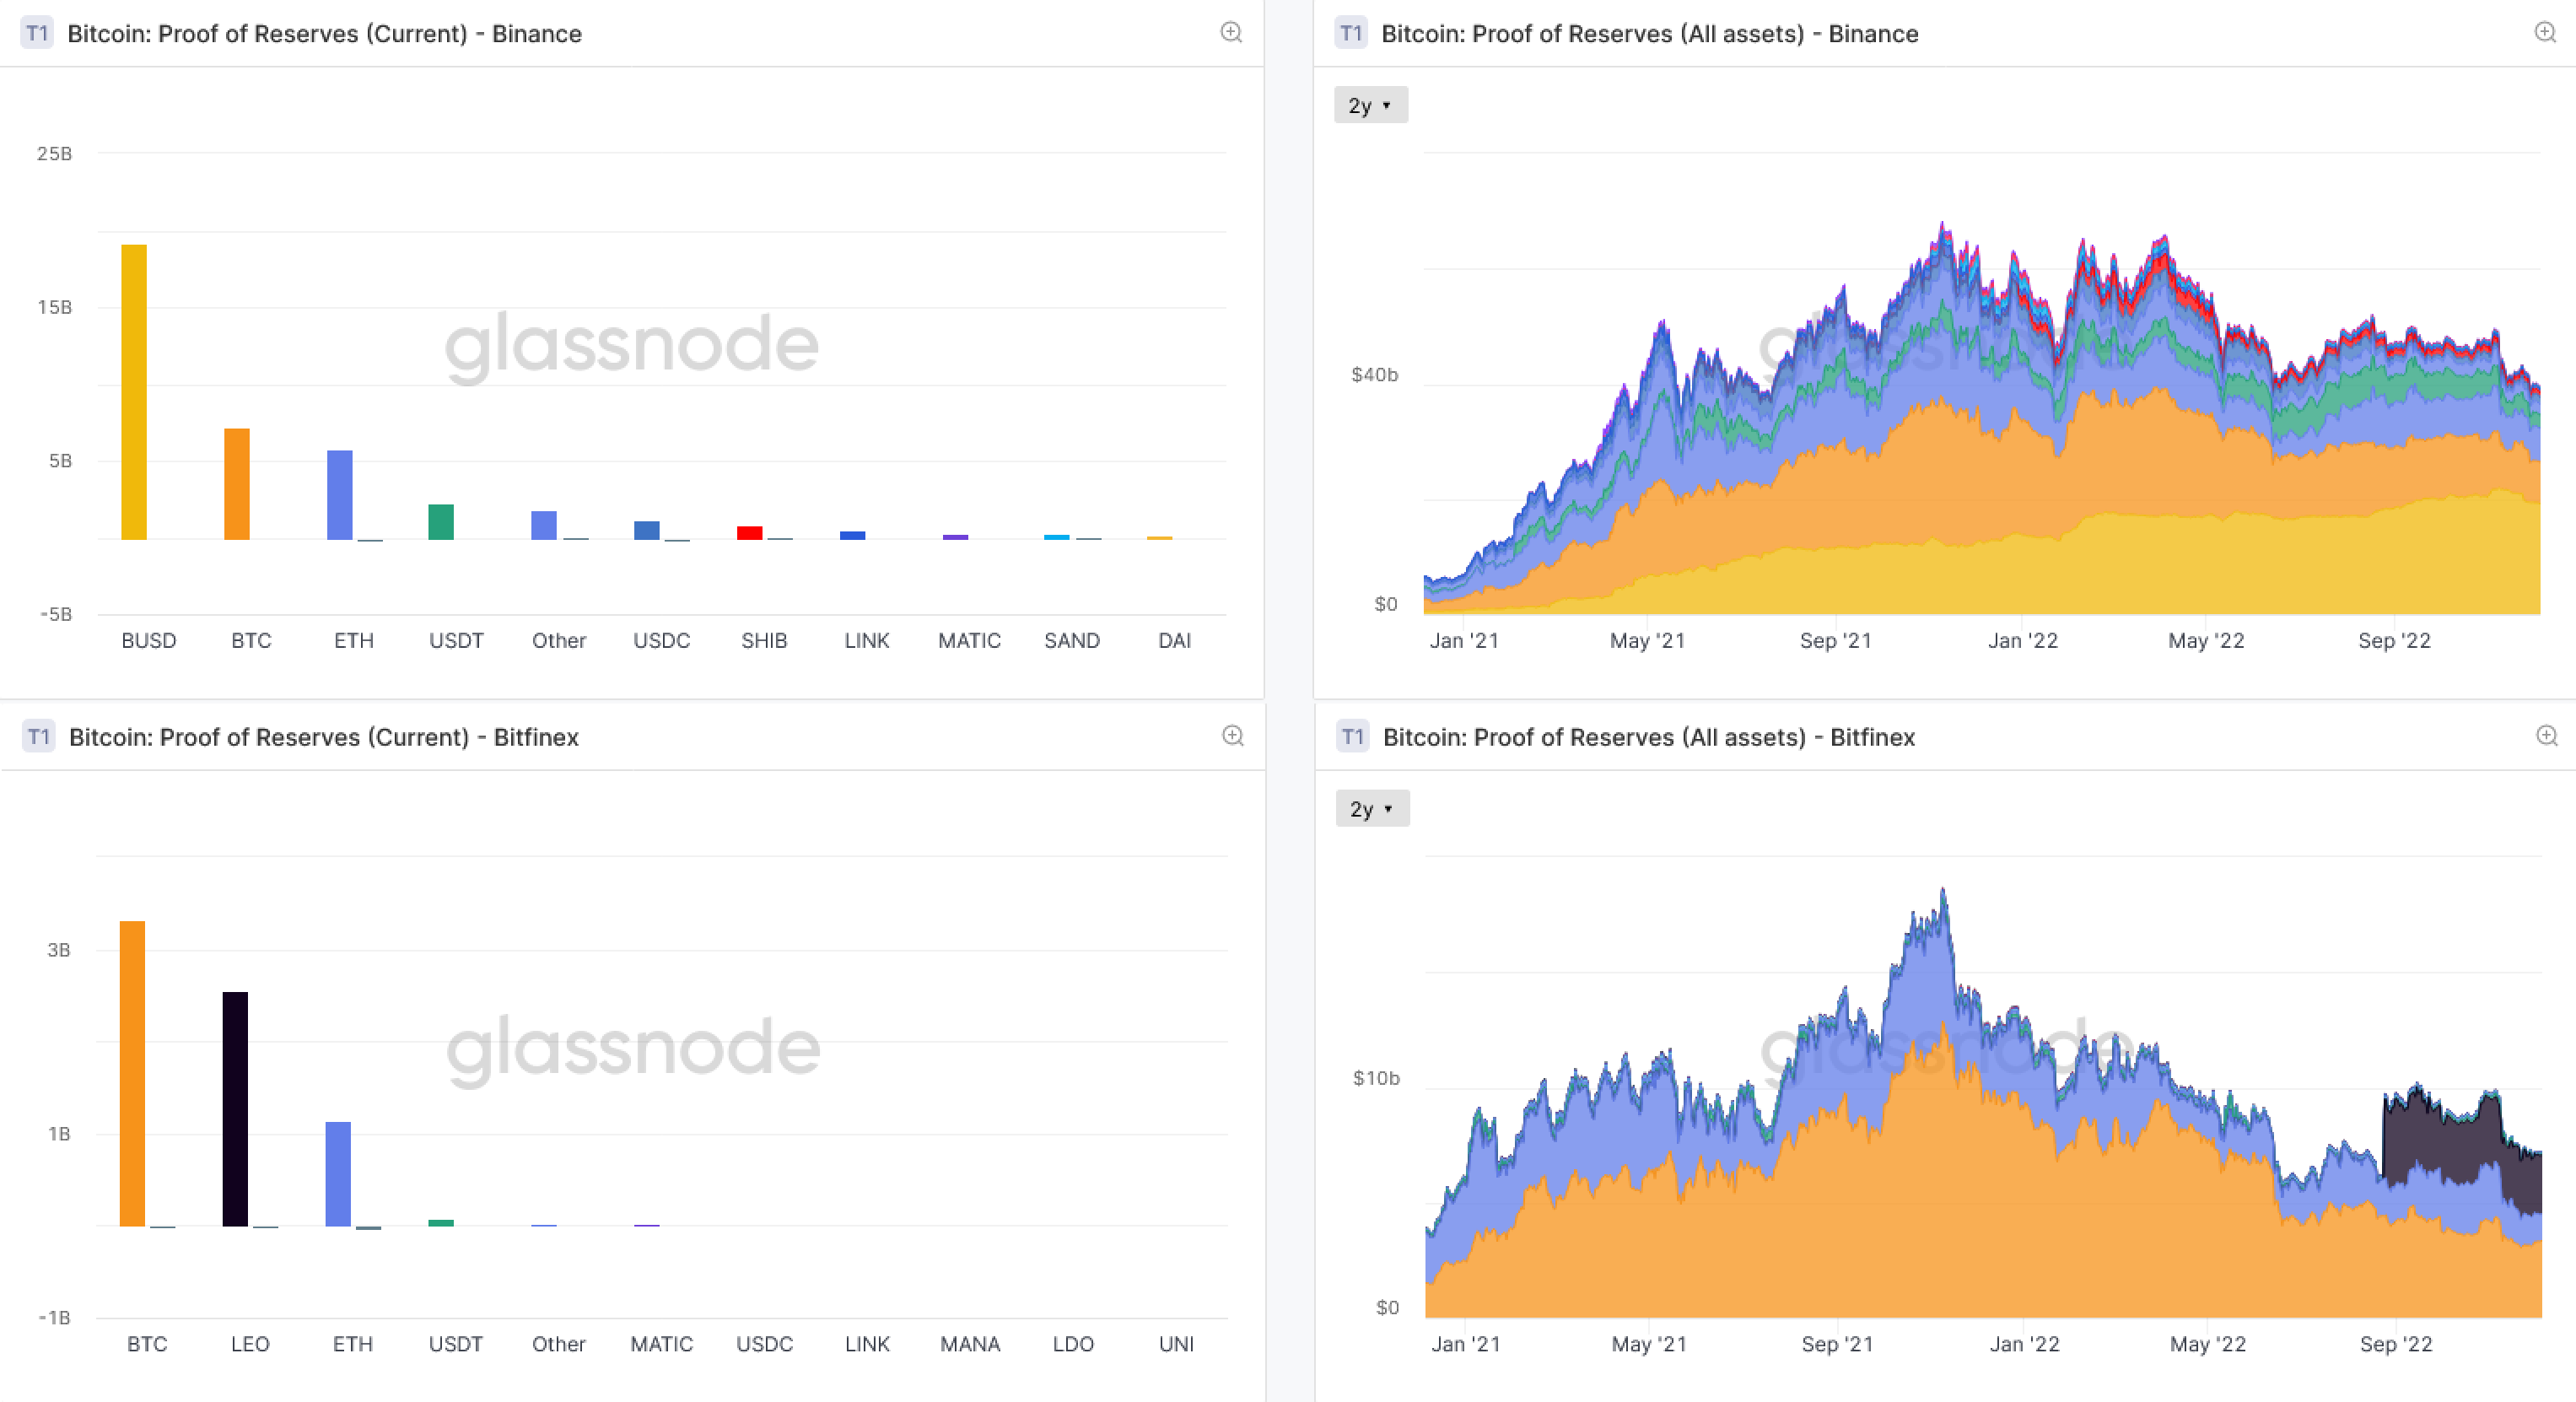
New Suite of Proof of Reserve Metrics:
In the wake of systemic insolvency across multiple major Exchanges and Lending firms, we have released a suite of Proof-of-Reserve metrics focused on enhancing transparency across the industry.
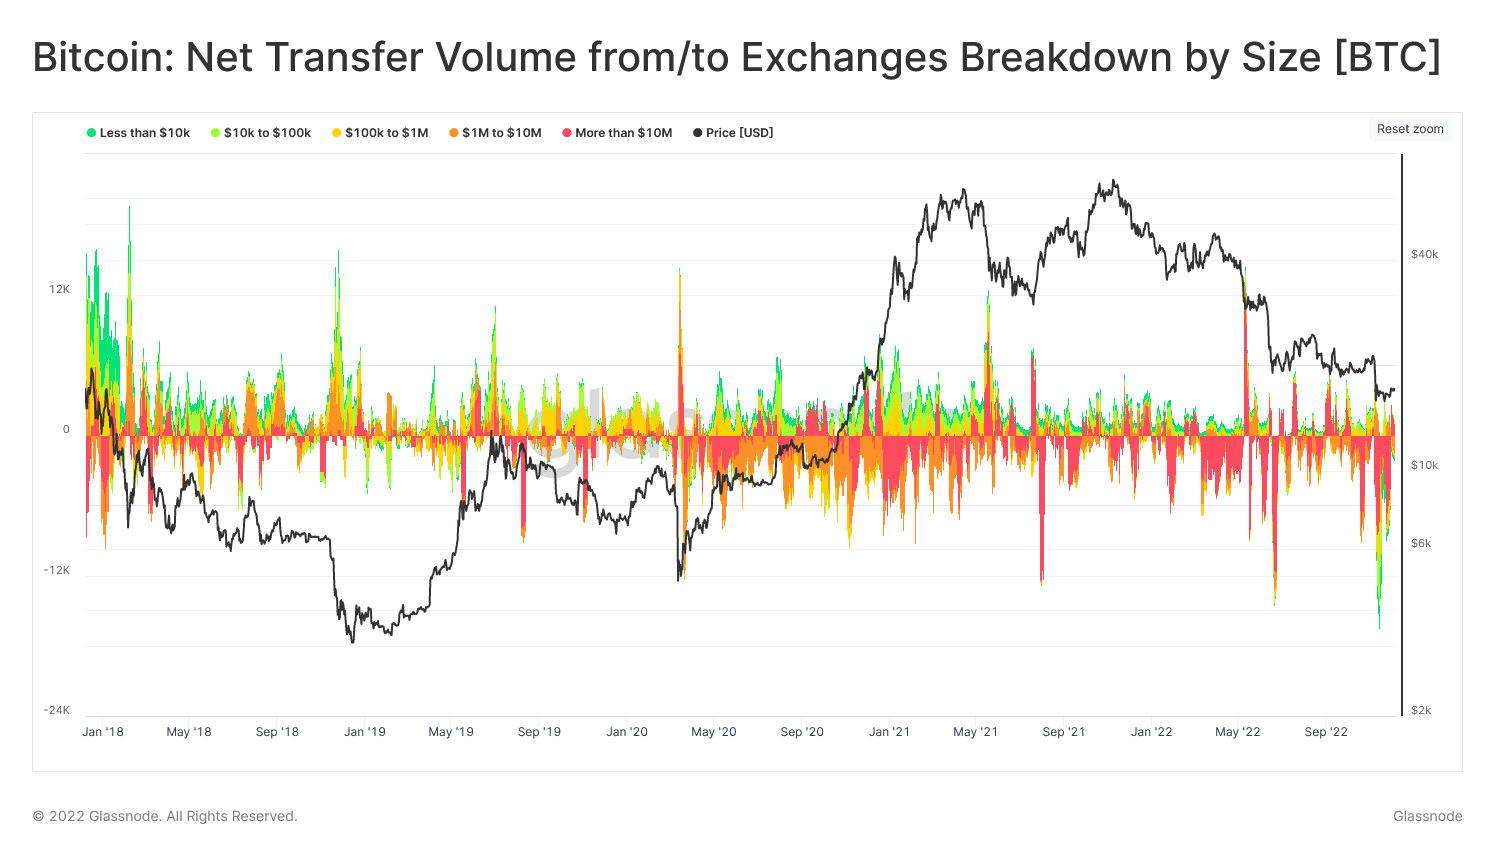
Exchanges:
This metric breaks down the exchange net flow by transaction size, ranging from <$10k to over $10M transaction sizes. This can be used in conjunction with Exchange metrics, and wallet cohort metrics for a more full picture of entity behaviors.
The Market Pulse is a report series by the Glassnode team, available exclusively for Advanced and Professional members on Glassnode Forum. Market Pulse Reports provide unique insight into how we, as power-users, maximize value within the Glassnode suite. We explore both the creative, technical, and educational elements of on-chain and market concepts, accompanied by bespoke step-by-step Workbench demonstrations and guides.
Market Pulses Released
- Assessing the Reaction of the Long-Term Holder Cohort in Response to the FTX Implosion (Forum post)
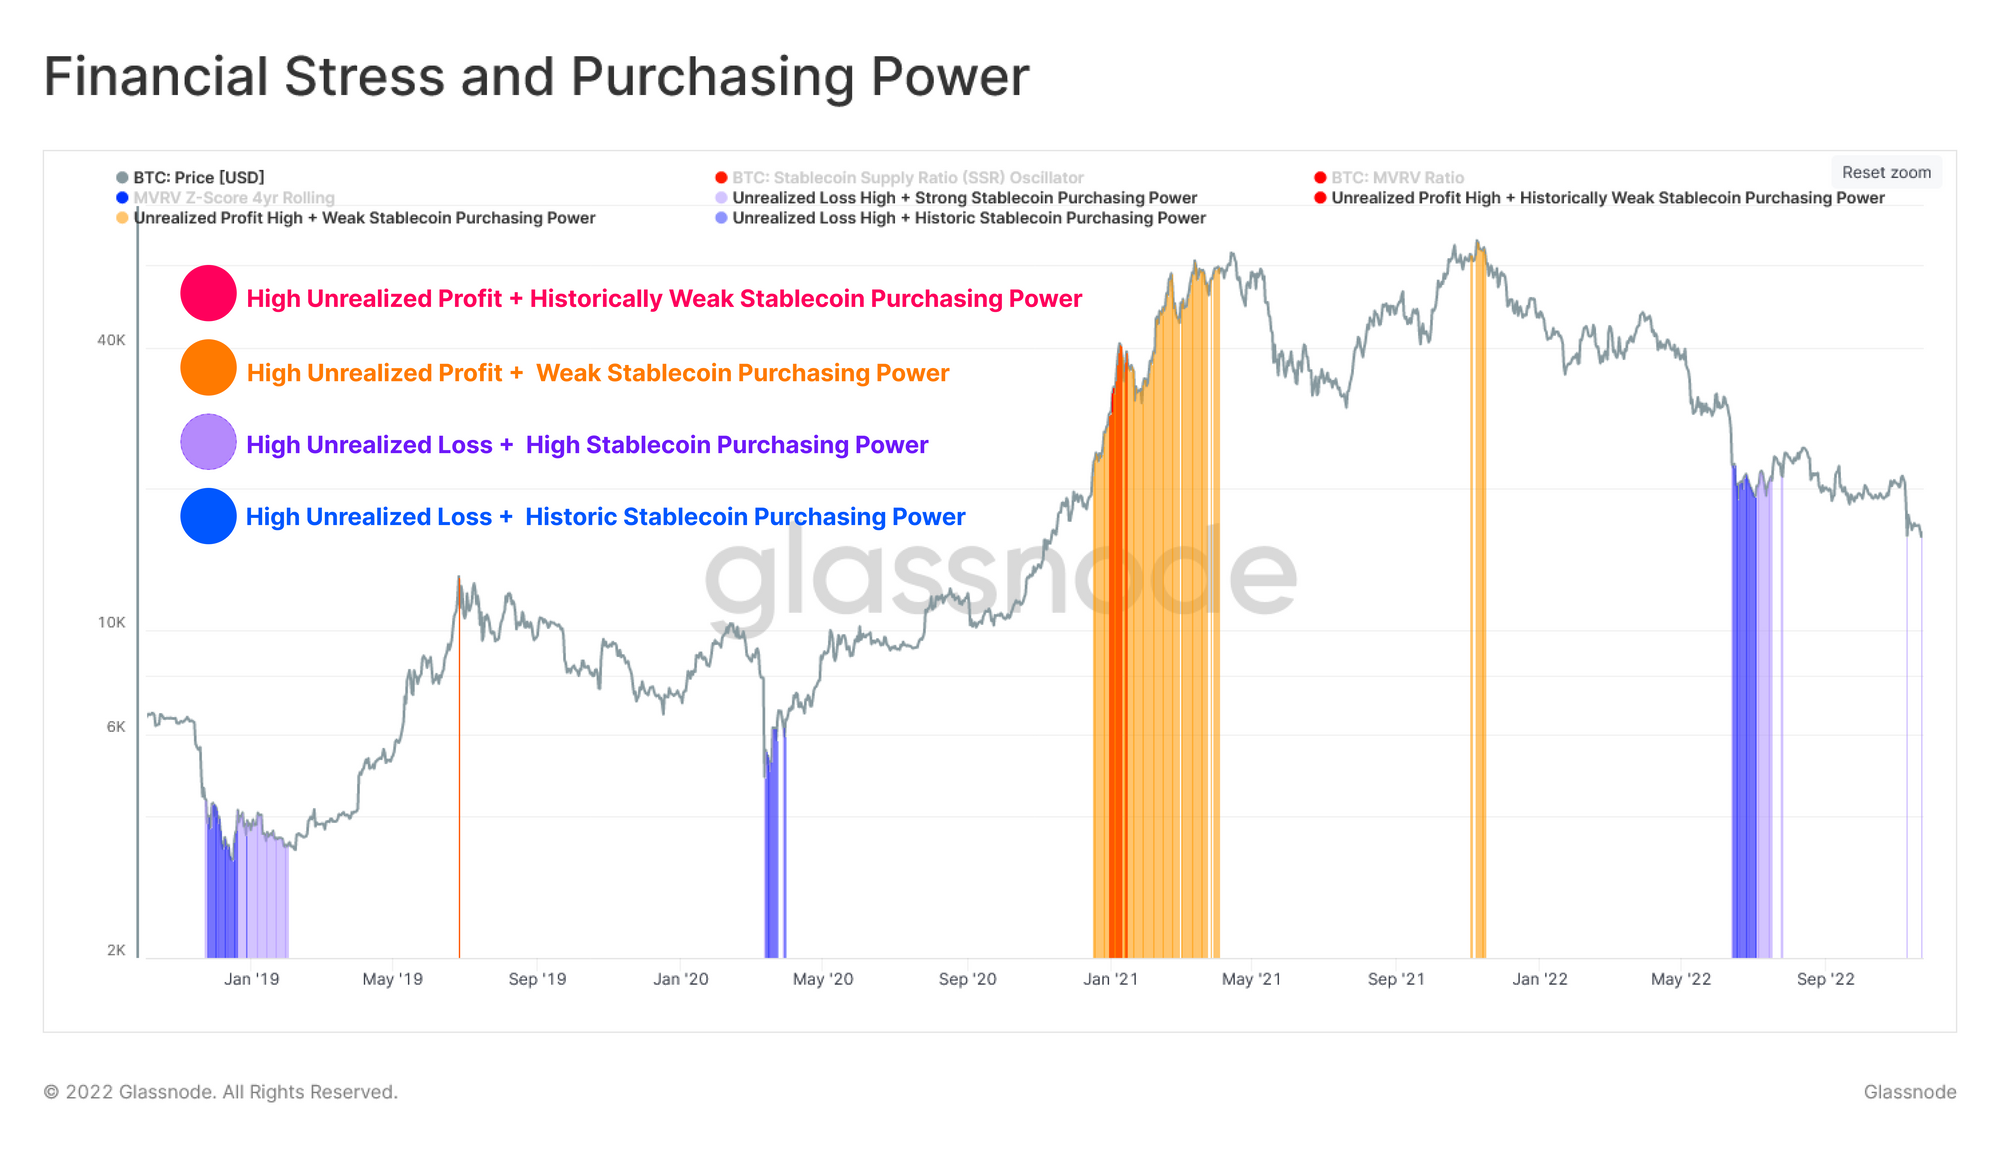
- Financial Stress and Stablecoin Purchasing Power (Forum post)
The chart below attempts to identify high probability topping and bottoming formations by exploring the relationship between financial stress and purchasing power. We conditionalize for Stablecoin expansion alongside elevated levels of unrealized loss to identify to locate a potential bottoming formation, this suggests Stablecoin demand is increasing despite participants experiencing severe profitability stress. This logic is reversed for topping formations.
Workbench is our premier tool for crafting bespoke metrics and visualizations, to elevate your Bitcoin, Ethereum, and crypto market analysis. This month we released new Workbench Constructions for:
Lifespan:
- Bitcoin: Young Supply Last Active < 6m
- Bitcoin: Old Supply Last Active > 6m
- Bitcoin: Old Supply Net Position Change
- Bitcoin: Percent Young vs Old Supply
- Bitcoin: Spent Old Coin Volume
- Bitcoin: Spent Young Coin Volume
- Bitcoin: Old vs Young Spent Coin Volume
- Bitcoin: Ancient Supply Last Active 5yr+
- Bitcoin: Ancient Supply Spent Volume 5yr+
Exchanges:
- Bitcoin: Exchange Average Withdrawal Price (by Year)
- Bitcoin: Exchange Average Withdrawal Price (by Exchange)
- Bitcoin: Whales and Exchanges
- Bitcoin: Exchange Mean Inflow Volume (by Exchange)
- Bitcoin: Coinbase Balance and Net Position Change
- Bitcoin: Binance Balance and Net Position Change
- Bitcoin: Bitfinex Balance and Net Position Change
- Bitcoin: FTX Balance and Net Position Change
- Bitcoin: Kraken Balance and Net Position Change
- Bitcoin: Gemini Balance and Net Position Change
- Bitcoin: OKEx Balance and Net Position Change
- Bitcoin: Bittrex Balance and Net Position Change
Entities:
- Shrimp Net Position Change
- Crab Net Position Change
- Fish to Shark Net Position Change
- Fish Net Position Change
- Shark Net Position Change
- Whale to/from Exchanges Net Position Change
Market Indicators:
Economic Indicators:
- Transaction Count Momentum
- Transaction Count Momentum (Entity-Adjusted)
- Transfer Volume Momentum (Change-Adjusted)
- Transfer Volume Momentum (Entity-Adjusted)
Miners:
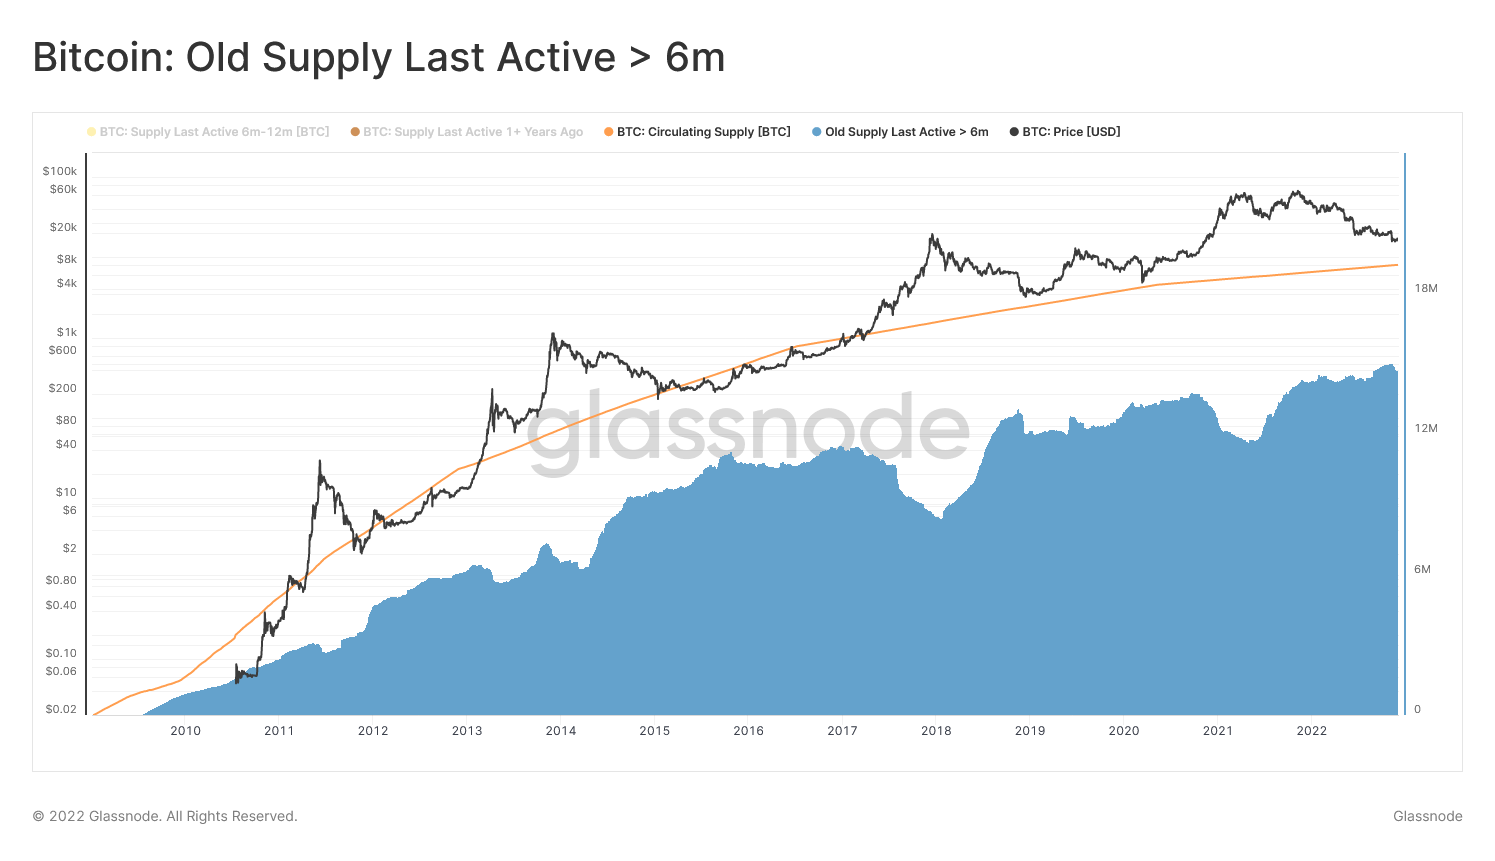
Construction of the Month: Old Supply Last Active > 6m
This chart presents the BTC supply which is Older than 6m 🟦
Based on our research, coins which have not transacted for at least 5-6 months are considerably less likely to be spent on any given day. This cohort of coins are often referred to as Old Coins, or Long-Term Holders (for our entity-adjusted Professional variants).
This broad cohort of coins tend to swell and contract in line with market cycles:
- Old Coins typically swell in volume ↗️ during bearish market trends, reflecting a net transfer of coin wealth from newer investors and speculators, back towards patient longer-term investors (HODLers). It signifies a decreasing volume of active supply, and is often associated with declining on-chain economic activity.
- Old Coins typically contract in volume ↘️ during bullish market trends, as profits are taken, and coin wealth transfers from longer-term investors, back towards newer market participants and speculators. It signifies a growing volume of active supply, and is often associated with elevated on-chain economic activity.

- Follow us and reach out on Twitter
- Join our Telegram channel
- Visit Glassnode Forum for long-form discussions and analysis.
- For on-chain metrics and activity graphs, visit Glassnode Studio
- For automated alerts on core on-chain metrics and activity on exchanges, visit our Glassnode Alerts Twitter