Slowly but Surely

Bitcoin faces strong resistance as it approaches several key on-chain cost basis. With very early signs pointing to a a positive shift in demand, and a convergence of market acquisition prices, the Bitcoin holder-base is slowly but surely becoming saturated by those with the strongest resolve.

Slowly but Surely

Following a fourth consecutive US rate hike of 75bps, a small pull back has occurred in the Dollar Index allowing global equities a brief period of respite. However, the stress present in the bond market remains persistent with further inversions across the front end of the yield curve, most notably in the 3month T-Bill in respect to the 10yr risk-free rate.

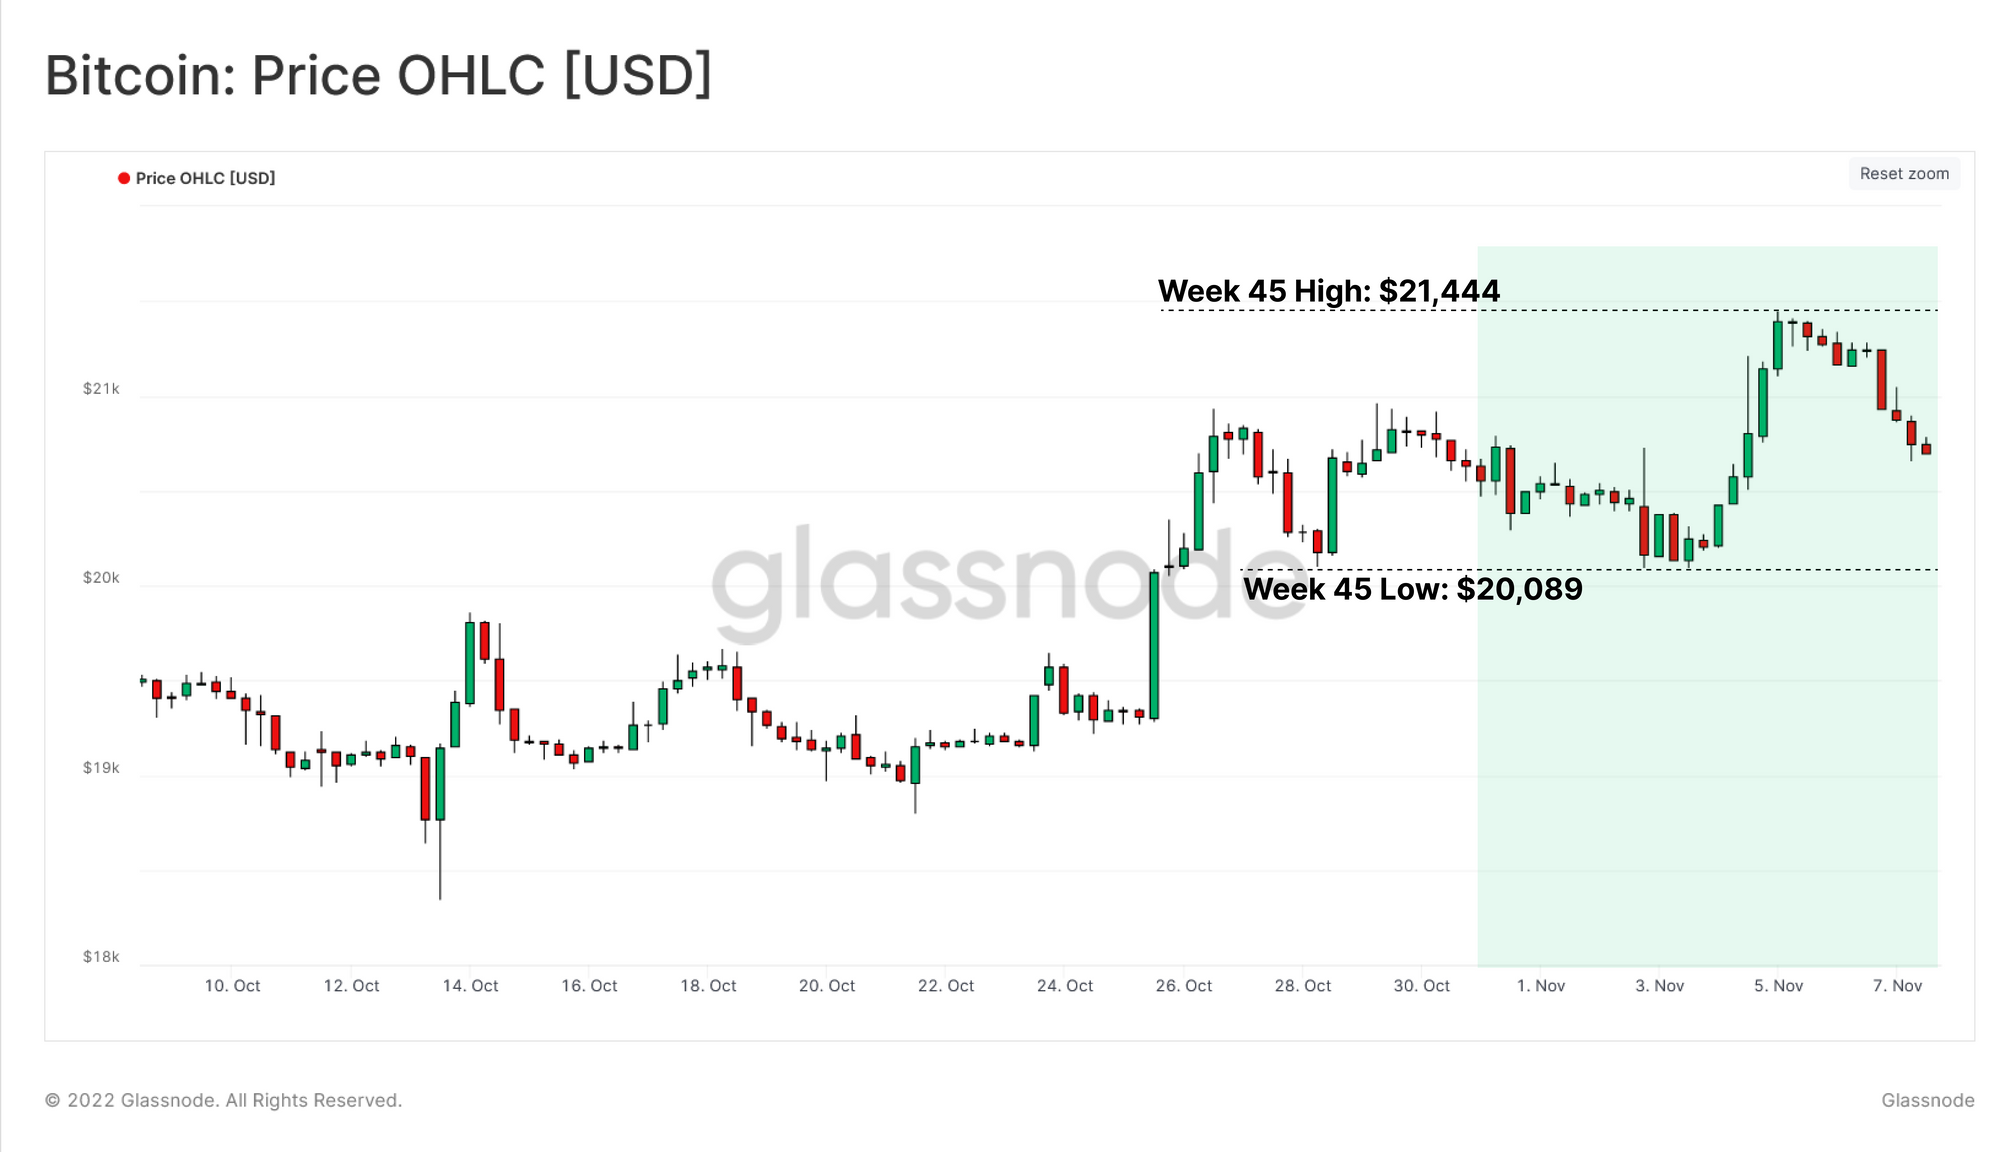
In response, Bitcoin prices have experienced a relatively small upwards surge, applying upwards pressure on key on-chain cost-basis' in its first bid for recovery. This price action is supported by muted HODLer behavior and the first glimmers of demand re-entering the system, as the asset class attempts to begin the long climb out of the depths of the bear market.

Translations

This Week On-chain is now being translated into Spanish, Italian, Chinese, Japanese, Turkish, French, Portuguese, Farsi, Polish, Arabic, Russian, Vietnamese and Greek.

The Week Onchain Dashboard

The Week Onchain Newsletter has a live dashboard with all featured charts available here. This dashboard and all covered metrics are explored further in our Video Report, which is released on Tuesdays each week. Visit and subscribe to our Youtube Channel, and visit our Video Portal for more video content and metric tutorials.

HODLers Remain Firm

We shall will our analysis with an assessment of the HODLer cohort, by inspecting their spending behaviors via the HODLer Net Position Change metric. This tracks the 30 day change in HODLed or Lost coin supply, which are the most dormant on-chain.

A dichotomy in HODLer behavior can be observed on either side of the May 2021 sell off.

  • 🔴 Prior to this inflection point, HODLers can be seen aggressively distributing coins, realizing profits into the cycle topping formation. Distribution peaked at a rate of -150k BTC / Month, expending a total of -450k BTC in the process.
  • 🟢 Following a breakdown in price action, the spending footprint of HODLers transitioned into an accumulation regime, amassing coins at a rate of+40k BTC / Month. This regime has culminated in a cumulative inflow of +500k BTC over an 8 month period.

This process has fully replenished the reserve of coins distributed this cycle, and pushed the HODLed and Lost coins metric to a new ATH.

Live Professional Workbench

The opposite supply region to HODLed coins can be considered ‘Hot coins’, which are actively participating in day-to-day trade of the Bitcoin economy.

The supply younger than 6 months old which is available on the market has remained around historic lows since May 2022 and continues to decline, further reiterating the extreme level of HODLing present in the current market.

Live Advanced Workbench

Next, we assess the Realized Cap HODL Waves, which allow for the inspection of USD denominated wealth held by specific age cohorts. Isolating for coins younger than 3-months old can be used to approximate the wealth of the speculative investor class.

Currently, the USD wealth held by young coins is at an all time low, representing only 10% of the network Realized Cap. By virtue of a binary system, this means that wealth that is older than 3-months has reached an ATH in both relative, and absolute terms of the network Realized Cap. This suggests the HODLer cohort are the most dominant they have ever been, signalling a resounding refusal to spend and sell, despite the persistent challenges in global capital markets.

Live Advanced Chart

Subsequently, we can employ the Realized HODL Ratio to compare this balance of wealth held between between young and mature coins in a macro scale oscillator. This can be considered under the following framework:

  • An uptrend in RHODL Ratio suggests growing dominance of USD wealth held by newer speculative buyers, and is typical of bull markets, and Bitcoin market tops.
  • A downtrend in RHODL Ratio indicates growing dominance of USD wealth held in older coins, suggesting increased HODLing, and long-term accumulation behavior.
  • A flat, range bound RHODL Ratio indicates that the rate of change between old and young dominance is at an equilibrium. This a transitional period is often observed around market inflection points such as distributive markets tops, and accumulation bottoms.

After remaining within a downwards trending regime since the November ATH, the angle of RHODL descent is beginning to soften, suggesting the balance between young and old coin wealth is finding an equilibrium. This pattern is occurring at similar levels and duration to that observed in the 2018-19 market low.

Live Advanced Chart

💡 New Dashboards Released

We have released a new HODL Wave Dynamics dashboard which explores the Bitcoin supply as it matures through various age cohorts.

Our suite of Bitcoin dashboards are being redesigned to help Glassnode members solve problems, and answer key questions in the market. Our new dashboards include contextualized sets of Studio metrics, custom workbench constructions, and analyst notes for key topics in the Bitcoin space.


We can leverage the Adjusted Reserve Risk metric (a new variant by the original author @hansthered) which is a cyclical oscillator that quantifies the balance between the aggregate incentive to sell, and the actualized expenditure of long dormant coins.

  • Uptrends in Adjusted Reserve Risk suggest the incentive to sell is increasing, and the realization of profits is becoming the primary mechanic in the market.
  • Downtrends in Adjusted Reserve Risk indicate the perceived opportunity of HODLing is increasing, thus HODLing is becoming the dominant mechanic in the market.

The formation of an accumulation bottom can be described by the Adjusted Reserve Risk metric under the following substructure:

  • 🟥 Phase 1: The incentive to sell collapses alongside post-blow-off-top price action, indicating an abrupt end to the traders market. Over time, gradual accumulation and HODLing becomes the dominant mechanic.
  • 🟧 Phase 2: The market perceived opportunity cost of spending coins approaches a maximum, as HODLing behavior reaches peak intensity, and the worst of the bear market passes by.
  • 🟩 Phase 3: The incentive to sell begins to show first signs of recovery, as new demand enters, profits are taken, and bottom formation takes place.

Presently, the Adjusted Reserve Risk appears to have entered Phase 3, aligned with the peak in HODLing behavior observed above, and signalling a potential transition towards a regime of increasing incentives to sell. In other words, those who have held coins for long periods of time are likely to become the dominant source of sell-side pressure on the road ahead (a signal of potential seller exhaustion from the 2021-22 cycle).

Live Advanced Workbench

A Burst of Interest

A small, but noticeably consistent change is taking place in the Bitcoin transaction space, as a sustained impulse higher in total coins transferred hits our nodes Mempool. This observable change in character provides initial signs of a potentially constructive shift in demand.

This trend remains in its infancy but is one to monitor.

Live Advanced Chart

Analyzing the transfer volume settled by the Bitcoin network on any given day, there has been a substantial decline from the $13B/day peak during the Jan to May 2021 rounded top, to a cycle low of just under $3B/day today, representing a -77% decline.

However, we are beginning to see a initial signs of stabilization, and perhaps an uptick in daily volume settled from the September lows, now oscillating between $3B and $4B/day.

Live Professional Chart / Advanced Variation

As highlighted above, the presence of young coins, often synonymous with retail investors, has waned since the May 2021 sell off. This is also evident by the decline in small sized transfer value settled each day.

Transactions from $0 to $10k have seen a stark decline from $430B/day in Jan 2021, to $220B/day at the moment, a decline of -49%. Nonetheless, we can see early signs of stabilization taking place in transfer volume contribution from these smaller sized entities, whom tend to respond quickly and early to the emergence of an upside rally.

This feature which was also present in the 2018 bottoming formation period.

Live Professional Chart

In contrast, we are seeing an opposite structure forming in transactions worth $1M+ with total volume from large participants continuing to decline. This again bares similarities to the 2018 bottom, where transaction volumes by larger entities were actually quite slow off the mark, waiting until the bullish trend was properly established before stabilization in transfer volume occurred.

Live Professional Chart

We can confirm this observation via the Relative Activity of Small and Large Entities metric. This metric takes into account the observable positive skewness in USD denominated Bitcoin transaction volumes. Here, we have constructed an oscillator that comparing the ratio between the 7-day MA, and the 365-day MA of median (small entities, 🔵), and mean (large entities, 🔴) transaction volumes.

Once more, we can highlight the similarity in structure between the activity of small and large entities during the 2018 bottom. Following the final capitulation in price action, the activity of small entities increased and effectively front-ran the 2019 and 2020 bullish impulses, suggesting an influx of small sized transactions, and thus an initial sign of returning demand.

Live Professional Chart / Advanced Variation

The aforementioned thesis can be further explored by analyzing the Median RVT Ratio. This metric compares the balance between the network valuation, denoted by the Realized Cap, and the presence of retail participation levels represented by the Median Transfer Volume. This can be considered the number of “middle of the pack” transactions that are equivalent to the current network valuation.

  • Increases in the Median RVT Ratio suggest an ongoing expulsion of retail presence until equilibrium is reached.
  • Decreases in the Median RVT Ratio generally indicates an increasing presence of retail participation.
  • A stable Median RVT Ratio occurs when both retail participation and network valuation are constant, indicating an equilibrium of network usage. This has historically been associated with macro scale transitional periods.

Following the sell-off punctuated by the LUNA-UST collapse, the presence of retail sized investors has been in equilibrium with the Realized Cap, suggesting a detox of speculative, low-conviction investors has occurred. The component of duration however does appear to be missing from the current regime when contrasted with the 2019 precedence.

Live Professional Workbench

Product Updates

October was an exciting month at Glassnode, as we announced our acquisition of Accointing.com, and continued to release suites of new metrics, workbench constructions, dashboards, and more. See our latest Product Update for October for a full overview.

October Product Update

Cost Basis Overhead

With very early signs of demand showing up across the network, it is prudent to assess market levels of interest that may lie ahead, particularly where longer-term investors may be engaged as sellers. As such, we can assess the on-chain cost basis for Long-Term Holders, Short-Term Holders, and the wider market.

  • Both the Short-Term Holder Cost Basis 🔴 and Realized Price 🟠 are trading at approximately the same level of $21.1k, which the market is currently contesting with.
  • The Long-Term Holder Cost Basis 🔵 remains higher up, trading at $23.5k and would be an area of interest for those investors who have weathered recent volatility, but remain unsure about stability in the the future.

A notable decline in the Short-Term Holder cost basis can be observed in recent weeks, due primarily to the significant volume of coin redistribution that was discussed in the WoC 44. This acts to drive the average Short-Term Holder acquisition price closer to the market value, and signifies an increasingly advantageous position for recent market entrants.

The second key observation is the clustering of these three on-chain cost basis in such a close proximity. This indicates a cost basis convergence for the average Bitcoin investor, irrespective of holding time, which makes the investor cohort somewhat more homogeneous (a reset of investor psychology so to speak).

Live Professional Workbench

Summary and Conclusions

The price insensitive HODLer cohort remain steadfast, as coins continue to flow into the HODLers aggregated treasuries, pushing their holdings to new ATHs. The wealth held by the HODLer class has also reached ATHs, potentially indicating a peak in HODLer strength as the incentive to realize profits begins to grow.

As HODLers attempt to sustain a floor price, it is the Short-Term Holders who must step in and inject organic capital into the system to aid in the stabilization of key levels. This is evidenced by both the structural change to Mempool activity as well as the surge of activity from small entities, as the demand for transactional verification and network usage slowly, but surely grows.

Despite unprecedented conditions across global markets. the structural price action of Bitcoin remains similar to prior cycles as price marches towards both the market wide cost-basis, as well as the Short-Term Holder cost-basis. Reaction to these key levels will be imperative to monitor in the coming weeks, as a confirmed flip of these resistance levels suggests the first glimmers of recovery across the long, arduous road ahead.

Translated channels

We are proud to have launched new social channels for:


--

Disclaimer: This report does not provide any investment advice. All data is provided for information purposes only. No investment decision shall be based on the information provided here and you are solely responsible for your own investment decisions.