Product Update: October 2022


October was an extremely exciting month for Glassnode, as we proudly announce our acquisition of portfolio tracking and tax platform Accointing.com. This is the next step in our mission to equip investors with the best tools, data, and unparalleled insights for navigating the industry, and making data-driven decisions in digital asset markets.
Our mission is to build crypto's leading market and portfolio intelligence platform that empowers investors to compound and protect their assets.
— glassnode (@glassnode) October 26, 2022
Today, we are proud to announce we have acquired @accointing – a key milestone towards this goal.
Learn more https://t.co/Rm2Tq9k3PU pic.twitter.com/p87Fbgbjdy
For full details, please see our announcement blog post.
It has also been a busy month shipping new Analysis reports, Workbench Constructions and Dashboards. A summary of the metrics, content, and product releases for the month are as follows:
- Week-on-Chain Newsletters (4x) covering new Hash Rate ATHs, increasing volatility in digital markets and the case for a Bull or Bear thesis.
- New Metrics in Studio (9x) covering a new suite of Realized Volatility metrics.
- Dashboards (9x) including 2x Tutorials on Lifespan and Realized Value and 7x New Bitcoin Dashboards.
- Workbench Constructions (26x)
- New Market Pulse Reports (2x)
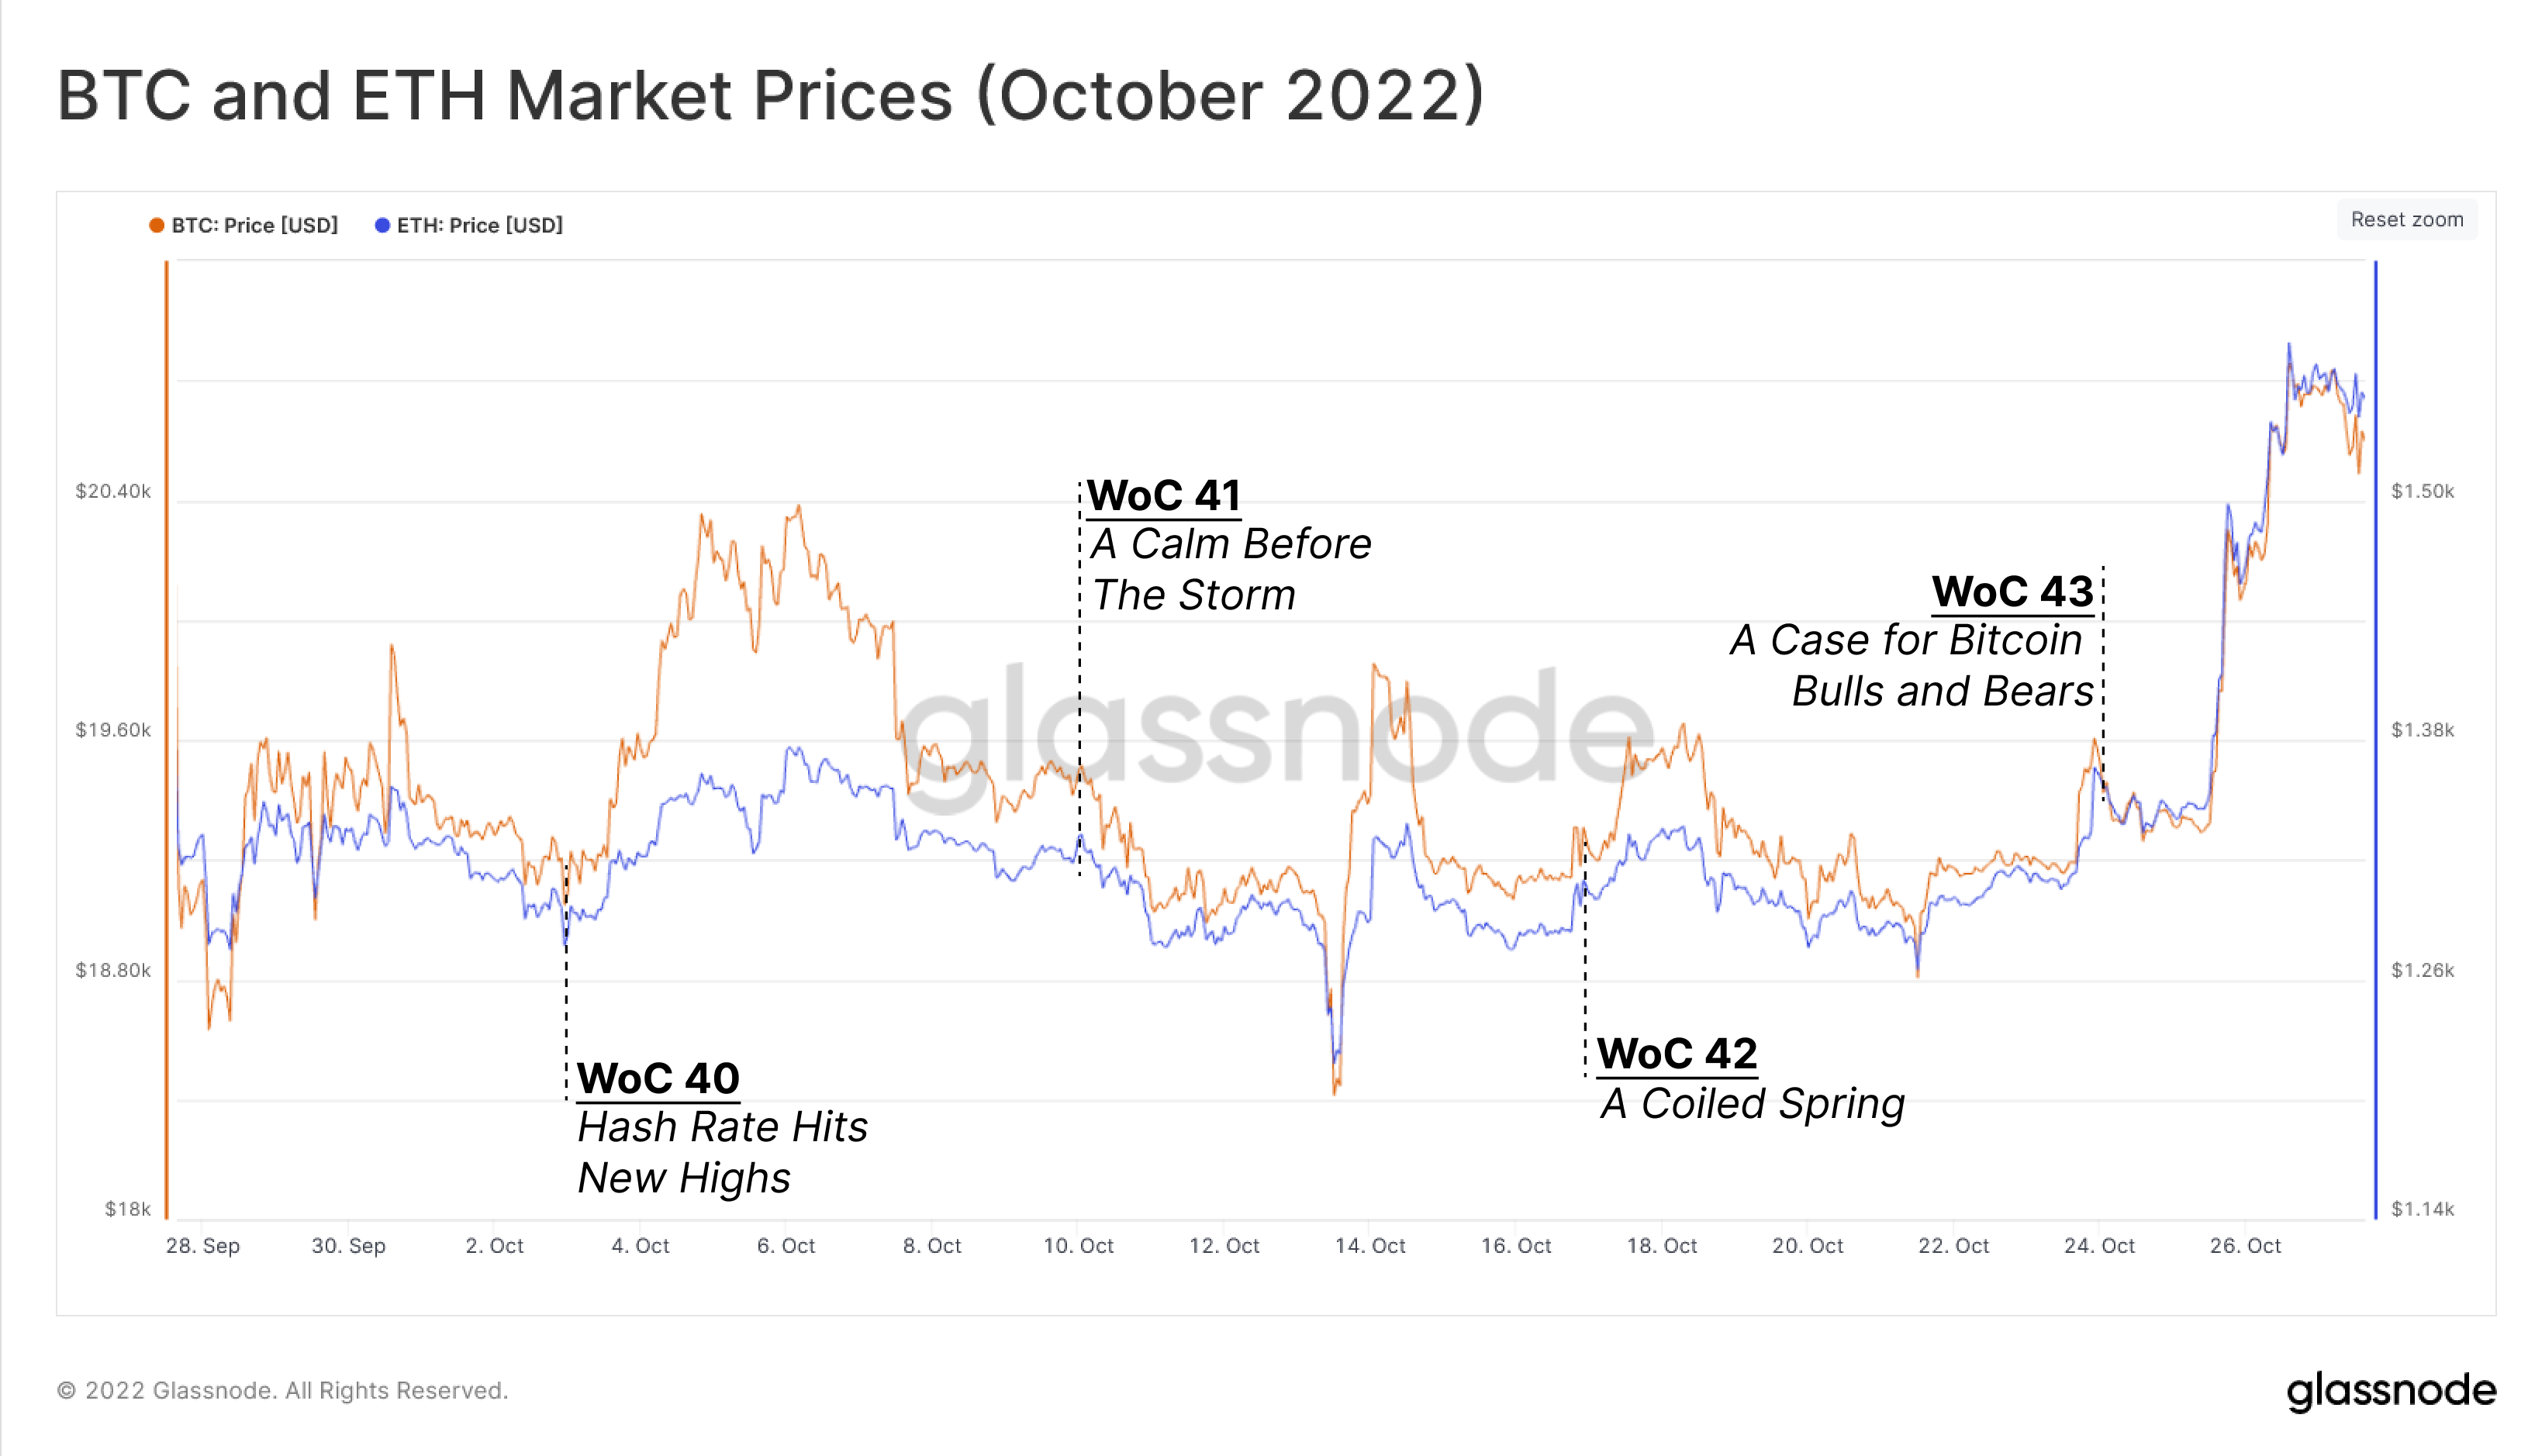
October, for the vast majority, was a historically quiet month for market price action, with Bitcoin trading range bound between $18.5 and $20.0k. However, periods of silence rarely last in digital asset markets, volatility is brewing (WoC 41), and is signalled by both participant on-chain profitability, as well in the derivative sphere. Futures Open Interest made new ATHs in BTC denominated terms (WoC 42), and culminated in break-out above the psychological $20k resistance late in the month.
Miners remain under immense stress with profitability continuing to wane to cycle lows whilst Hashrate hits new ATHs (WoC 40) further propelling the fringe miner into acute stress. With volatility imminent and direction indiscriminate, we presented both the Bull and the Bear case (WoC 42), as the market squeezes into a decision point.
The Week On-chain Newsletters Released
- WoC #40: Hashrate Hits New Highs (Report, Video)
- WoC #41: A Calm Before the Storm (Report, Video)
- WoC #42: A Coiled Spring (Report, Video)
- WoC #43: A Case for Bitcoin Bulls and Bears (Report, Video)
At Glassnode, we believe data driven insights answer many of our biggest questions across digital asset markets. Thus, we have released a suite of 7x Dashboards which help contextualise, and answer core questions. In addition, we released 2x Tutorials Dashboards which seek to provide an introductory education in the field of On-chain analytics.
Dashboards Released and Updated
- Miners Core
- Miner Capitulation Risk
- Monitoring HODler Cycles
- Supply and Scarcity
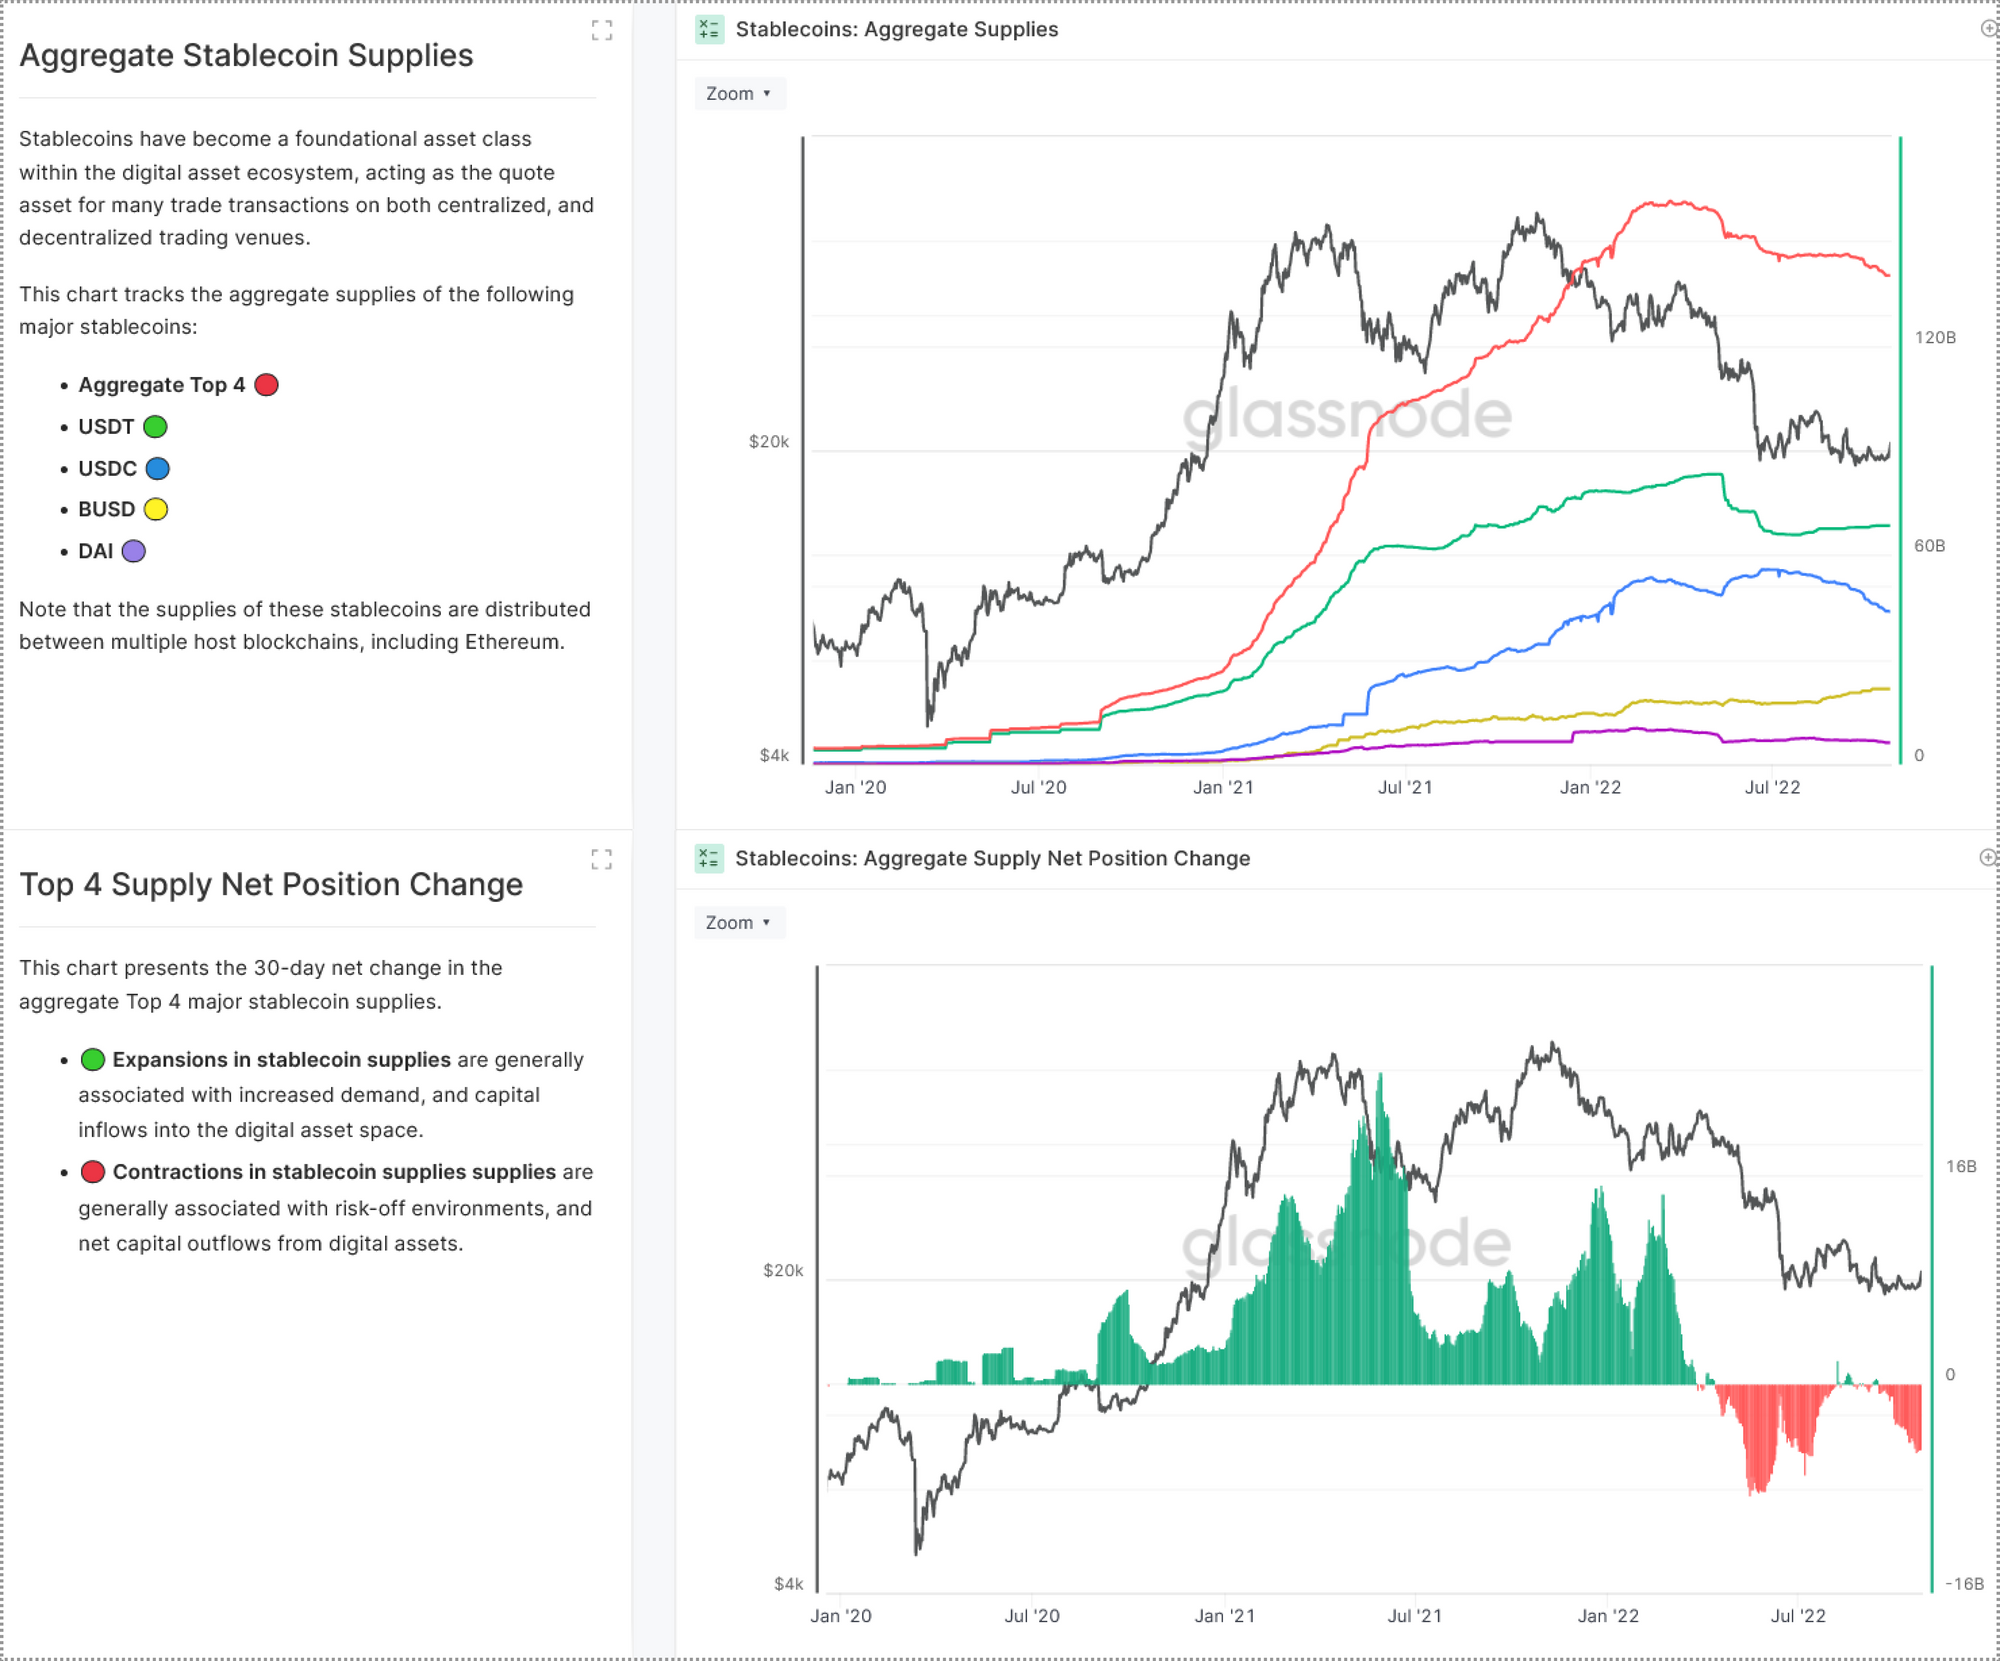
- Stablecoin Supplies
- Stablecoin On-Chain Activity
- Stablecoins and Exchanges
Tutorials Released
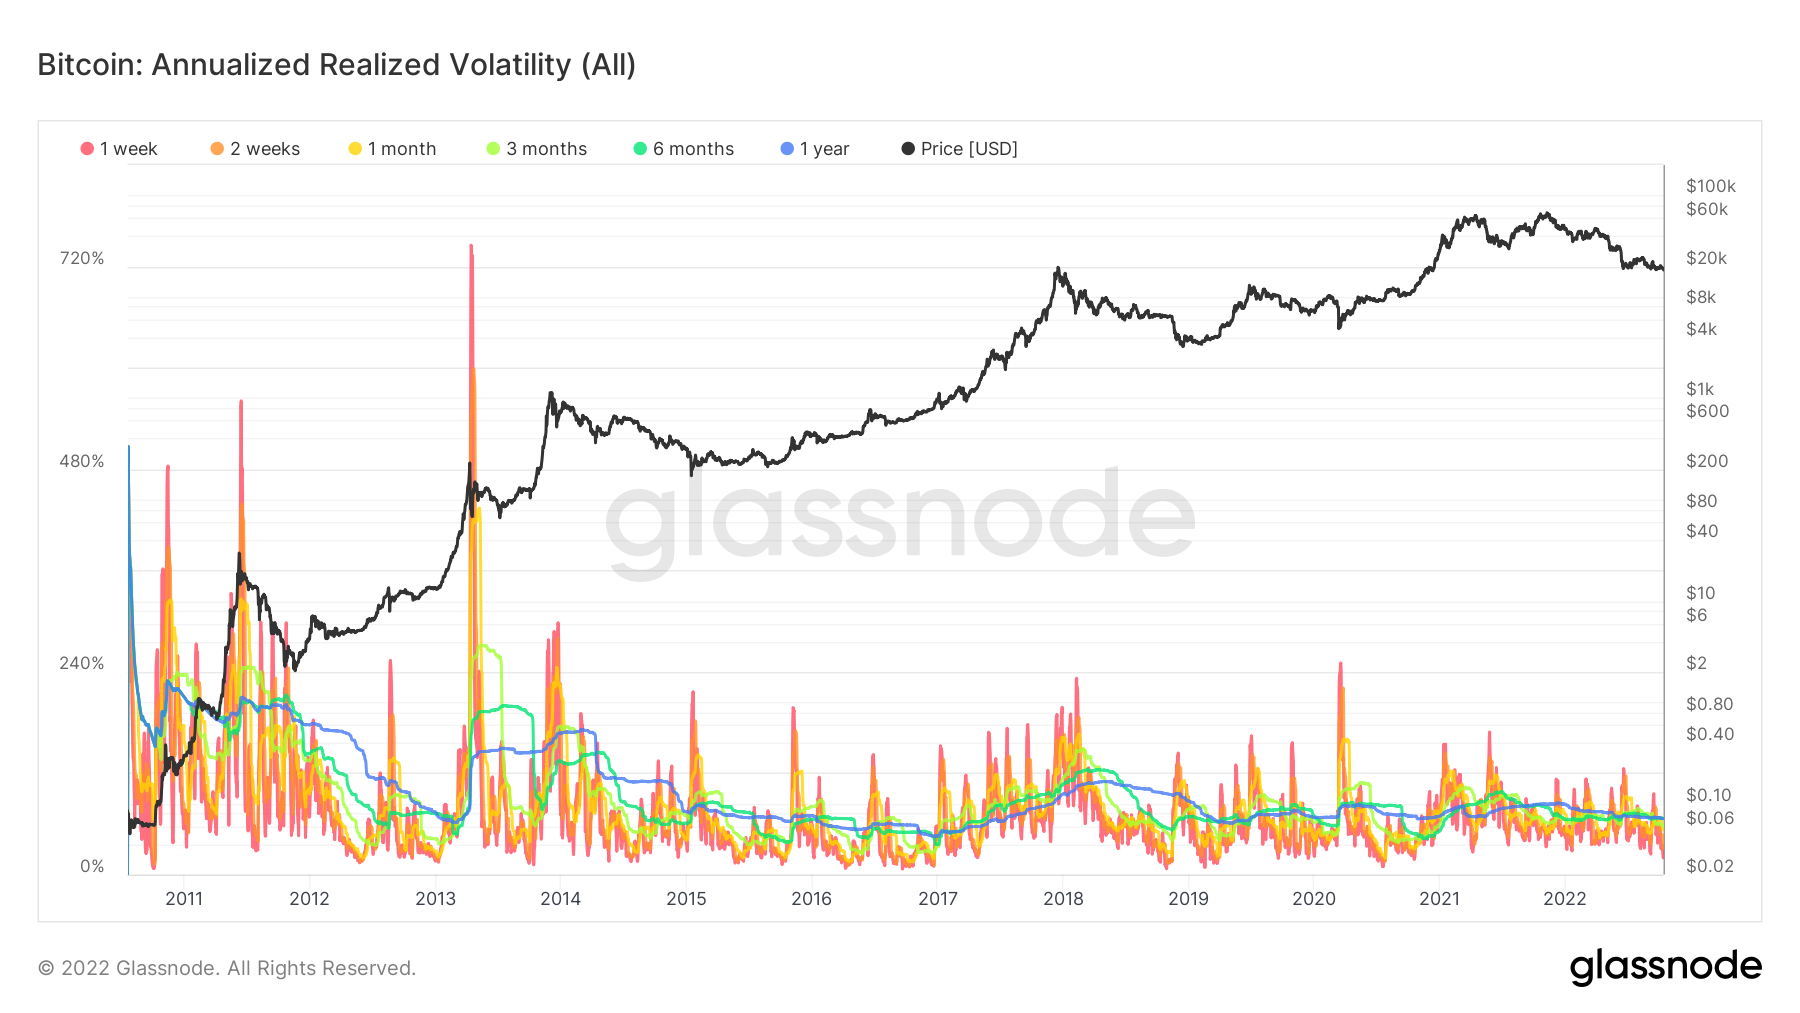
New Suite of Bitcoin: Annualized Realized Volatility Metrics
This month, we have released a new suite of Realized Volatility metrics. Realized volatility can be considered as the standard deviation of returns from the mean return of a market. High values in realized volatility indicate a phase of high risk in that market.
- Annualized Realized Volatility (1 Week)
- Annualized Realized Volatility (2 Weeks)
- Annualized Realized Volatility (1 Month)
- Annualized Realized Volatility (3 Months)
- Annualized Realized Volatility (6 Months)
- Annualized Realized Volatility (1 Year)
- Annualized Realized Volatility (All)
The Market Pulse is a new report series by the Glassnode team, available exclusively for Advanced and Professional members on Glassnode Forum. Market Pulse Reports provide unique insight into how we, as power-users, maximise value within the Glassnode suite. We explore both the creative, technical, and educational elements of on-chain and market concepts, accompanied by bespoke step-by-step Workbench demonstrations and guides.
Market Pulses Released
- Understanding the Health of the Network (Forum post)
- Vapour-liquid Equilibrium and Bitcoin Cycles (Forum Post)
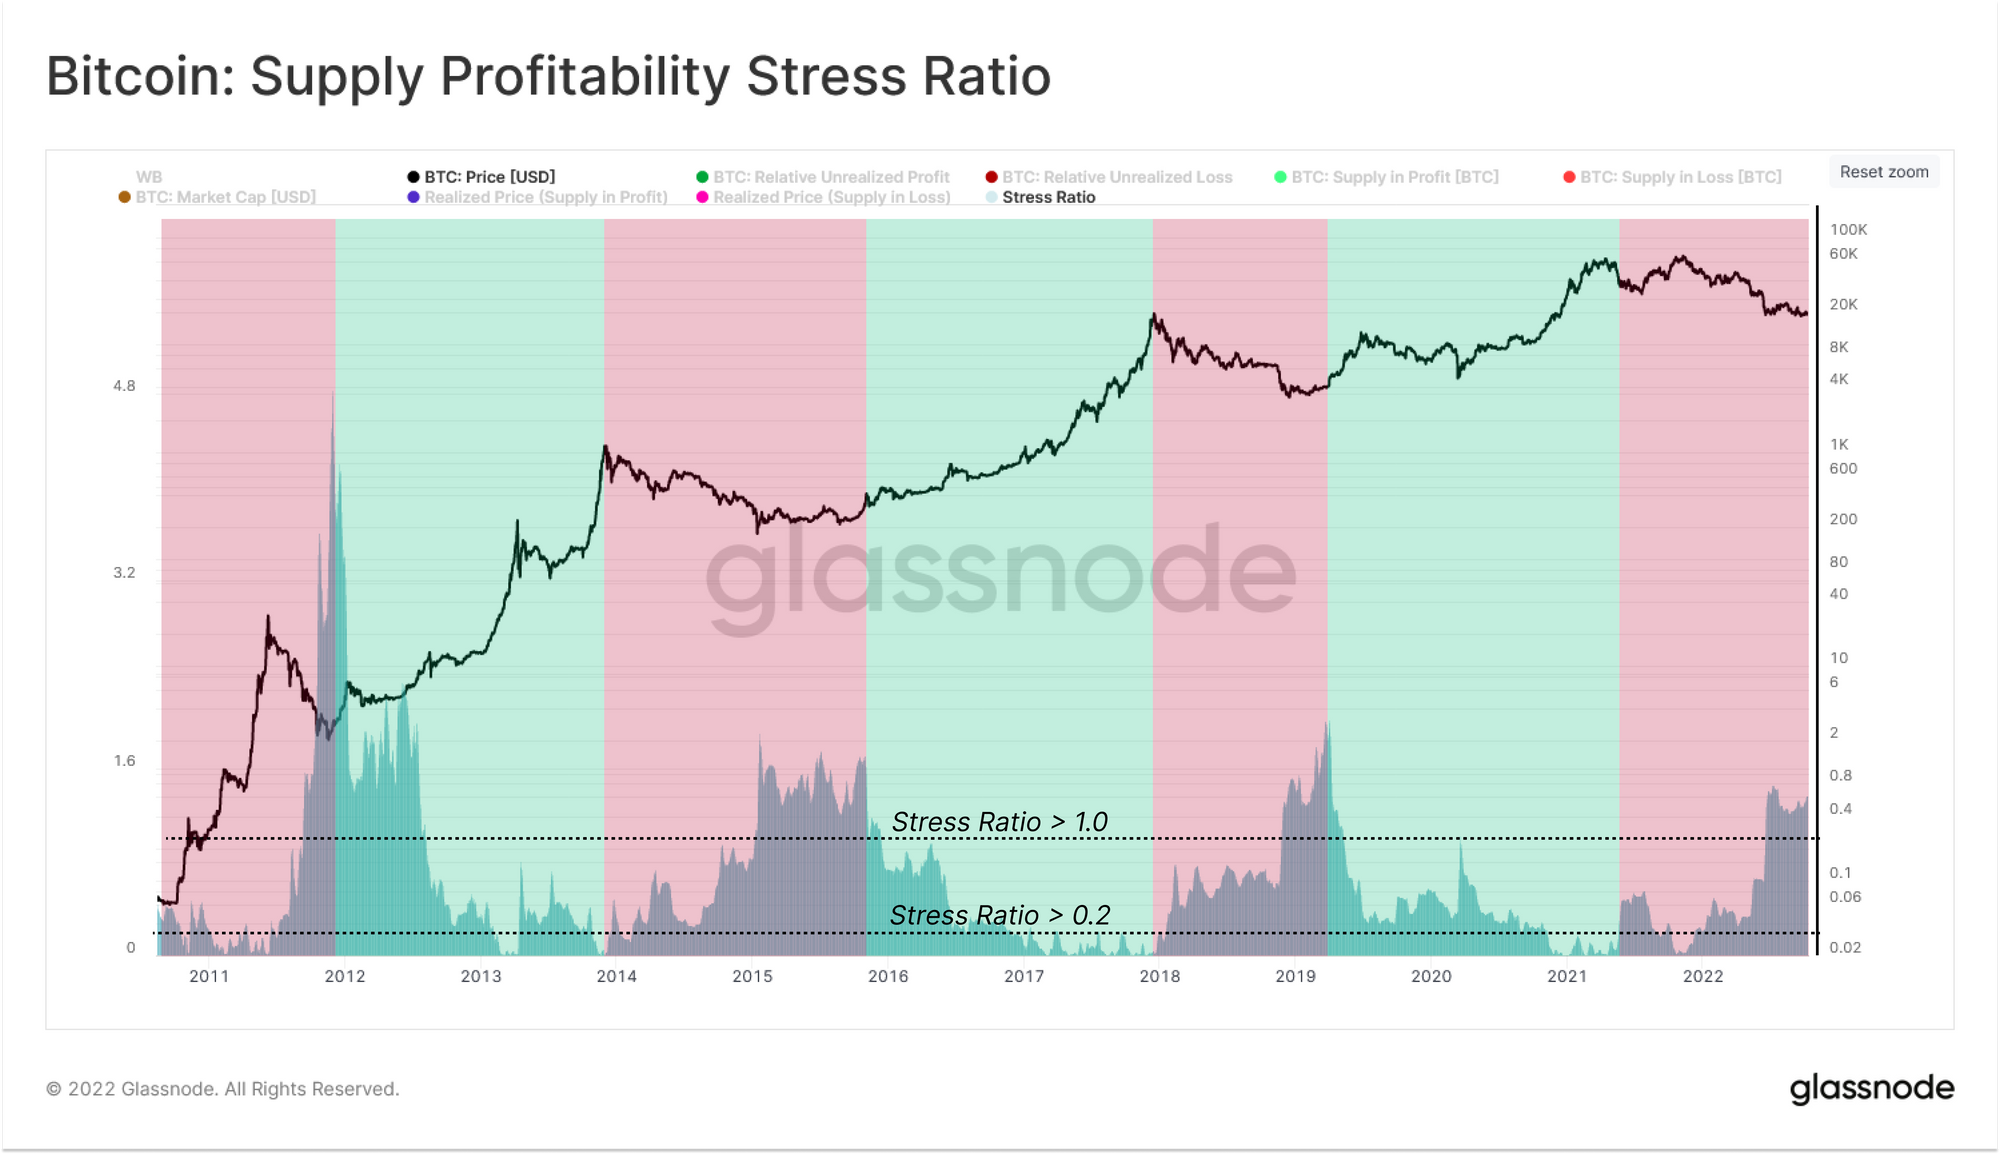
The chart below the Bitcoin: Supply Profitability Stress Ratio, developed by leveraging Thermodynamic principles to identify analogies between the Lever Rule and Supply Profitability Stress. This metric measures the stress inflicted by the relative magnitude of Supply in Loss, identifying regimes of shrinking and expanding profitability. This post was released publicly on the Glassnode Forum and is now available as a live Workbench Construction.
Workbench is our premier tool for crafting bespoke metrics and visualizations, to elevate your Bitcoin, Ethereum, and crypto market analysis. This month we released new Workbench Constructions for:
Stablecoins
- Stablecoins: Active Addresses
- Stablecoins: Non-Zero Balances
- Stablecoins: Transfer Counts
- Stablecoins: Transfer Volume
- Stablecoins: Exchange Balances
- Stablecoins: Exchange Net Flow Volume
- Stablecoins: Exchanges Inflow Volume
- Stablecoins: Exchanges Outflow Volume
- Stablecoins: Exchanges Net Position Change
- Stablecoins: Exchanges Buying Power
- Stablecoins: Supply in Smart Contracts
- Stablecoins: Supply in Smart Contracts Net Position Change
Bitcoin
- Bitcoin: Realized Profit and Loss
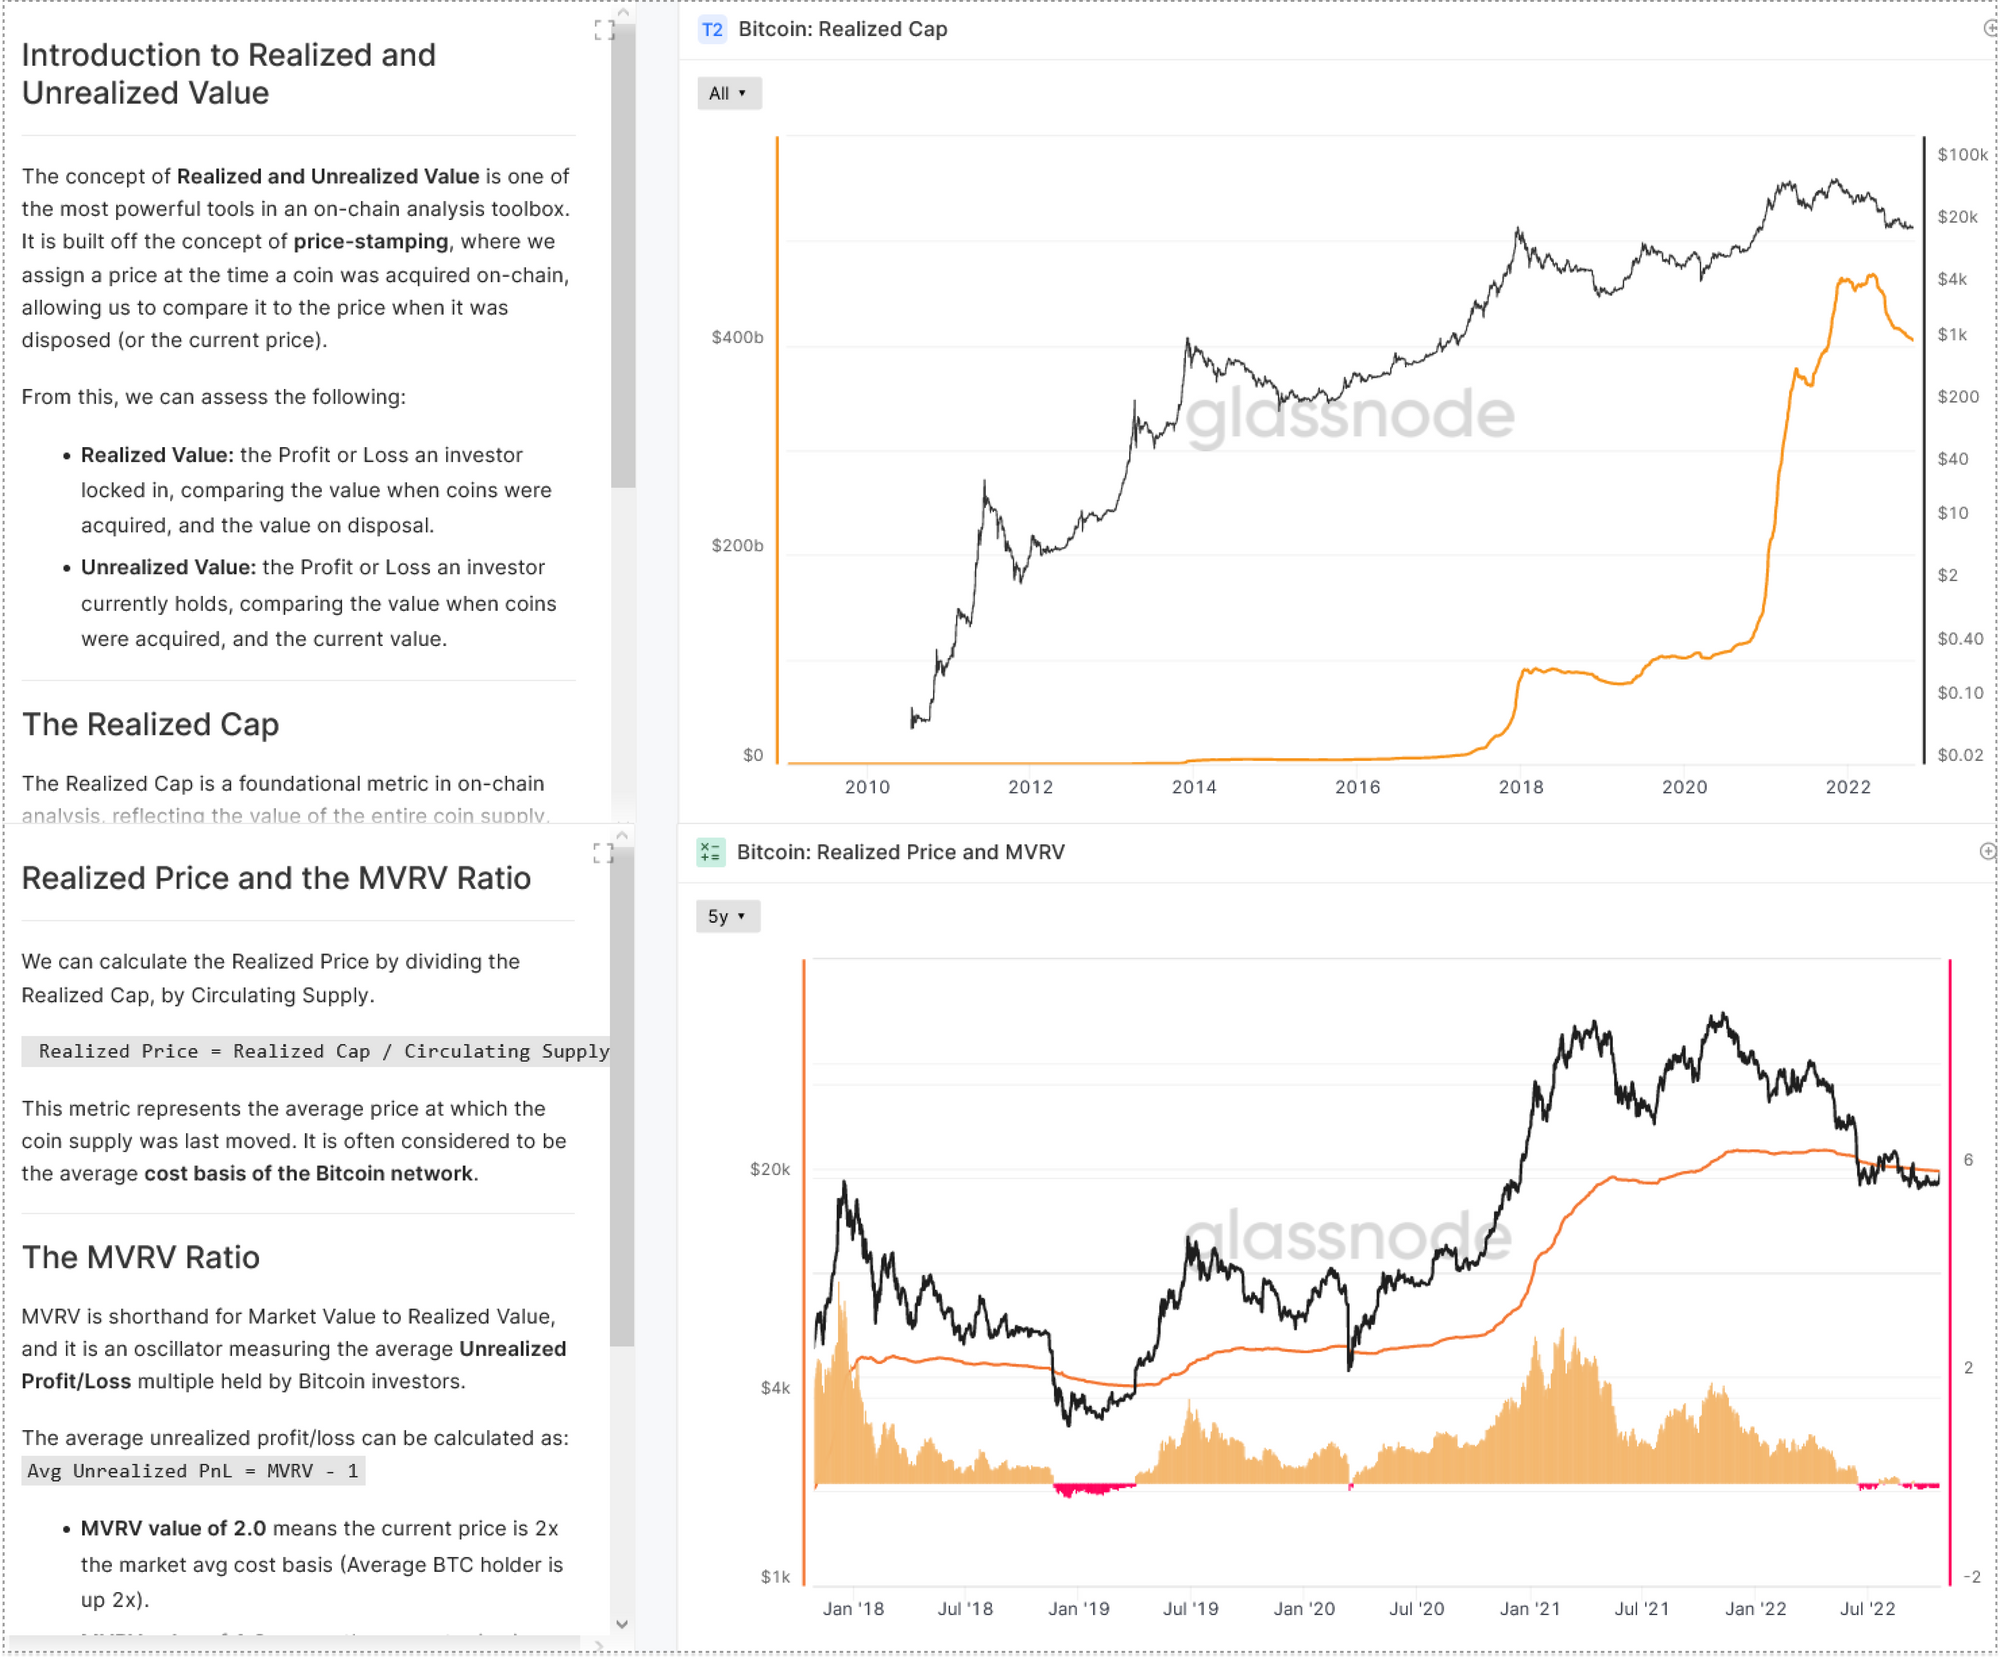
- Bitcoin: Realized Price and MVRV
- Bitcoin: Realized RVT Ratio
- Bitcoin: Average Lifespan per Coin
- Bitcoin: Percent of 21M Supply Mined
- Bitcoin: Supply Last Active 1Yr+ Age Bands
- Bitcoin: Supply Last Active < 6 Months
- Bitcoin: Supply in Profit/Loss
- Bitcoin: LTH and STH Supply in Loss
- Bitcoin: LTH and STH Supply in Profit
Ethereum
Miners
- Bitcoin: Miner Balance (Minus Patoshi and Other)
- Bitcoin: Miner Coverage
- Bitcoin: Miner Revenue vs Yearly Average
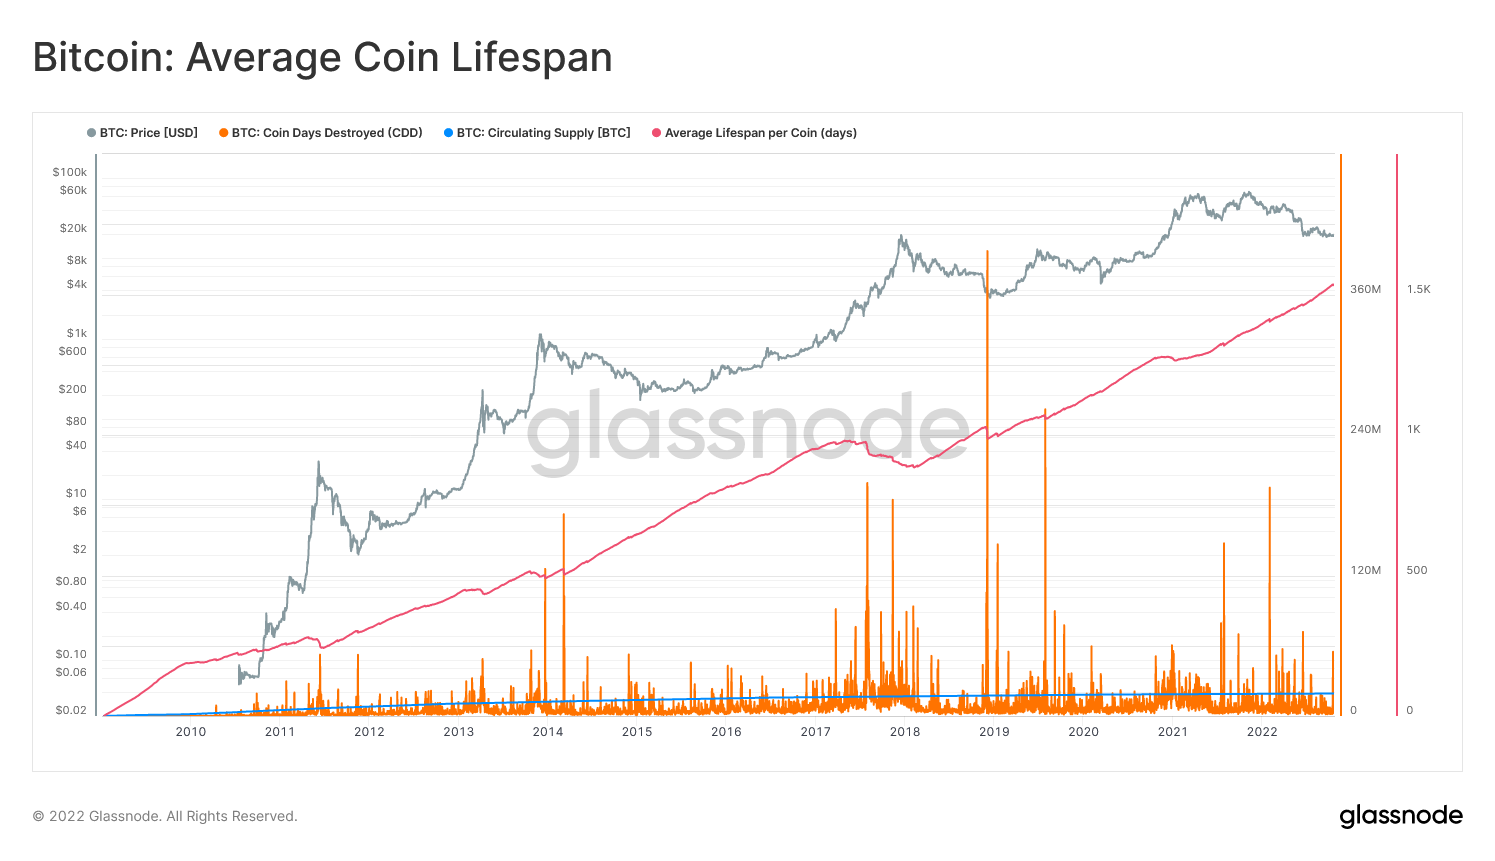
Construction of the Month: Average Lifespan per Coin
This chart presents the average Lifespan held per coin (the age of the average HODL wave). It is based upon the following principles:
Each unit of coin in the supply creates an equivalent volume of coindays per day. Some portion of the coin supply is spent each day, destroying the accumulated coindays (called Coindays Destroyed, CDD). The remaining non-destroyed coindays can be aggregated, and then divided by the Circulating Supply to obtain the average Lifespan per coin.
This chart shows the following traces:
- 🟠 Total Lifespan Destroyed = Coindays Destroyed (CDD)
- 🔵 Total Lifespan Created = Circulating Supply
- 🔴 Average Lifespan per Coin (days)
Uptrends in trhe Average Lifespan metric indicate there is more HODLing taking place than Lifespan destruction. Downtrends indicate that longer-term investors are spending their coins in larger volumes, with steeper downtrends indicating more spent volume.

- Follow us and reach out on Twitter
- Join our Telegram channel
- Visit Glassnode Forum for long-form discussions and analysis.
- For on-chain metrics and activity graphs, visit Glassnode Studio
- For automated alerts on core on-chain metrics and activity on exchanges, visit our Glassnode Alerts Twitter