The Great DeFi Deleveraging
The Ethereum DeFi market is undergoing a dramatic deleveraging, with over $124B in capital flushed out in just six weeks. The Ethereum investor base is now heavily underwater on spot positions, and is locking in historically large realized losses.


The year to date performance in 2022 has been historically bad, not only for digital assets, but for almost all asset classes. Tightening monetary policy around the world, rising strength of the US Dollar, and the decline in risk asset valuations has triggered a wide array of margin calls, debt liquidations, and deleveraging.
In the digital assets space, Ethereum remains the largest smart contract platform, hosting a plethora of financial products, innovation, and automation, with varying degrees of decentralisation (generally referred to as DeFi). Over the course of the 2020-21 bull market cycle, adoption of these products by retail and institutions alike gave rise to an excessive build-up of leverage within the DeFi sector.
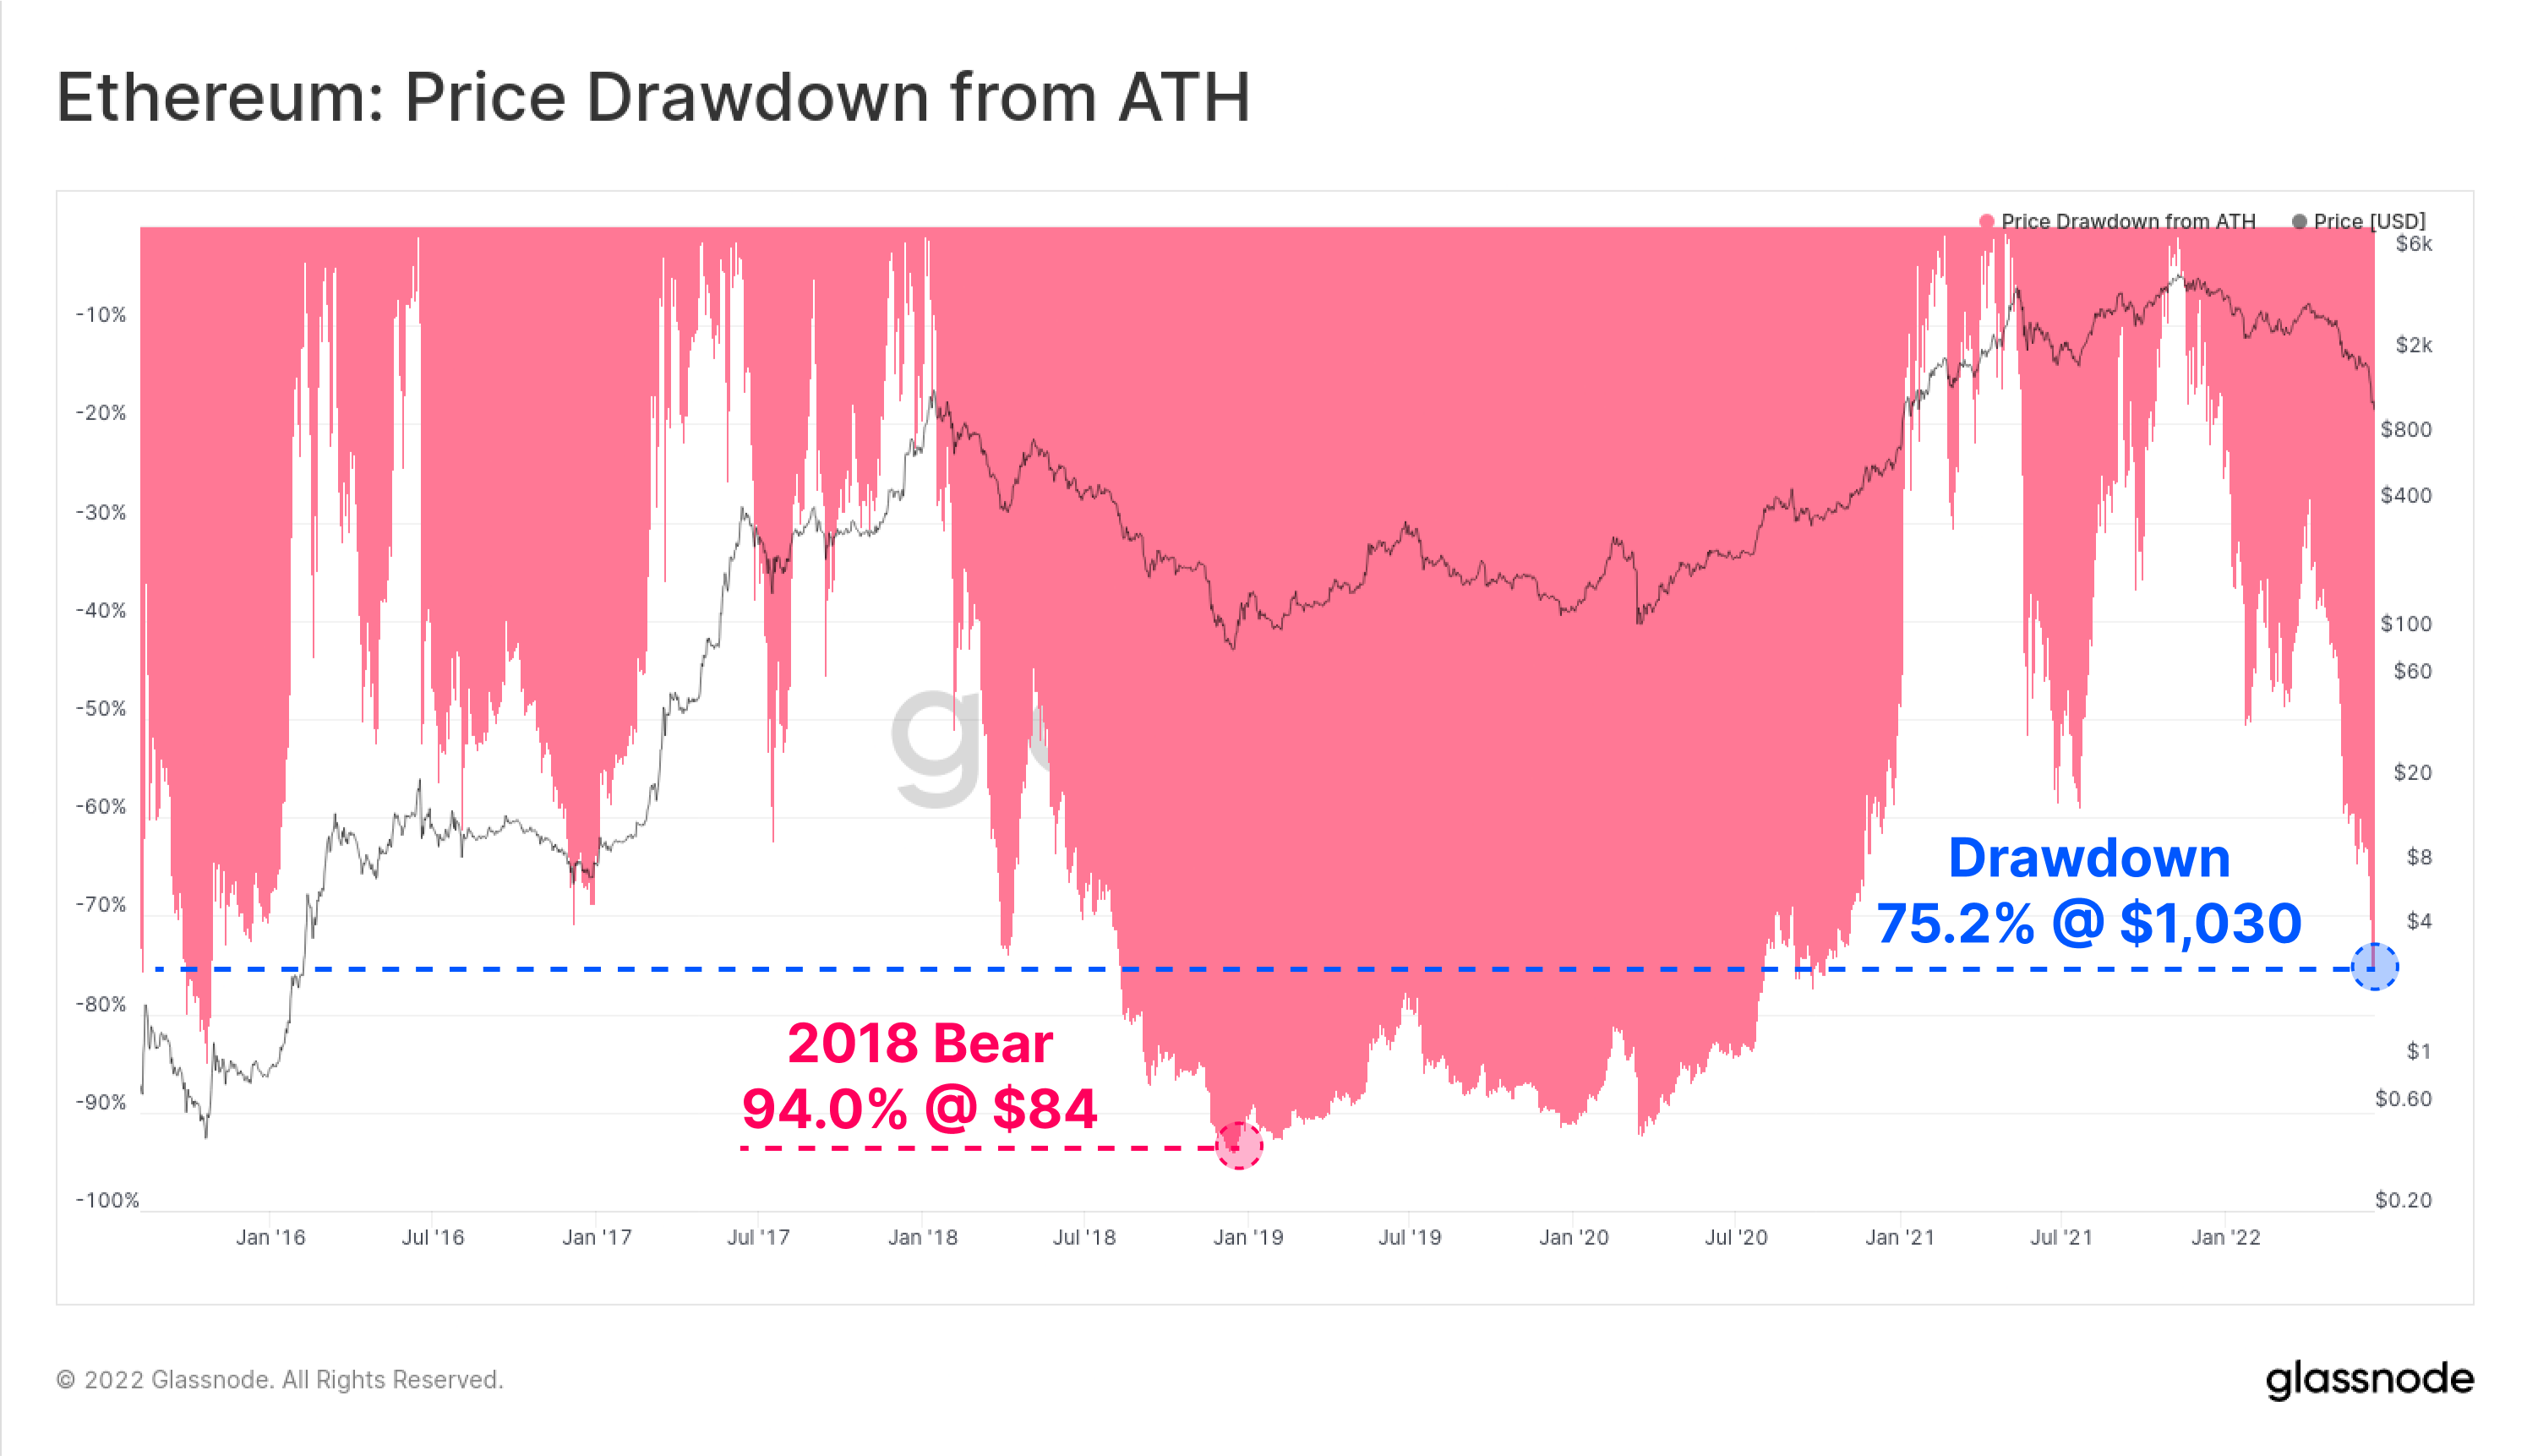
As the prevailing bear market set in, the price of the Ethereum native token ETH has dropped to a low of $1,030, coming 75.2% off the $4,808 all-time-high. As a result of this perfect storm, the entire Ethereum ecosystem is currently experiencing a historical de-leveraging event. In this piece, we will explore some of the early warning signals, the scale of the deleveraging event, and the impact it has had on ETH investor profitability.
This piece also has an associated Live Dashboard Available here.
Diminishing Demand
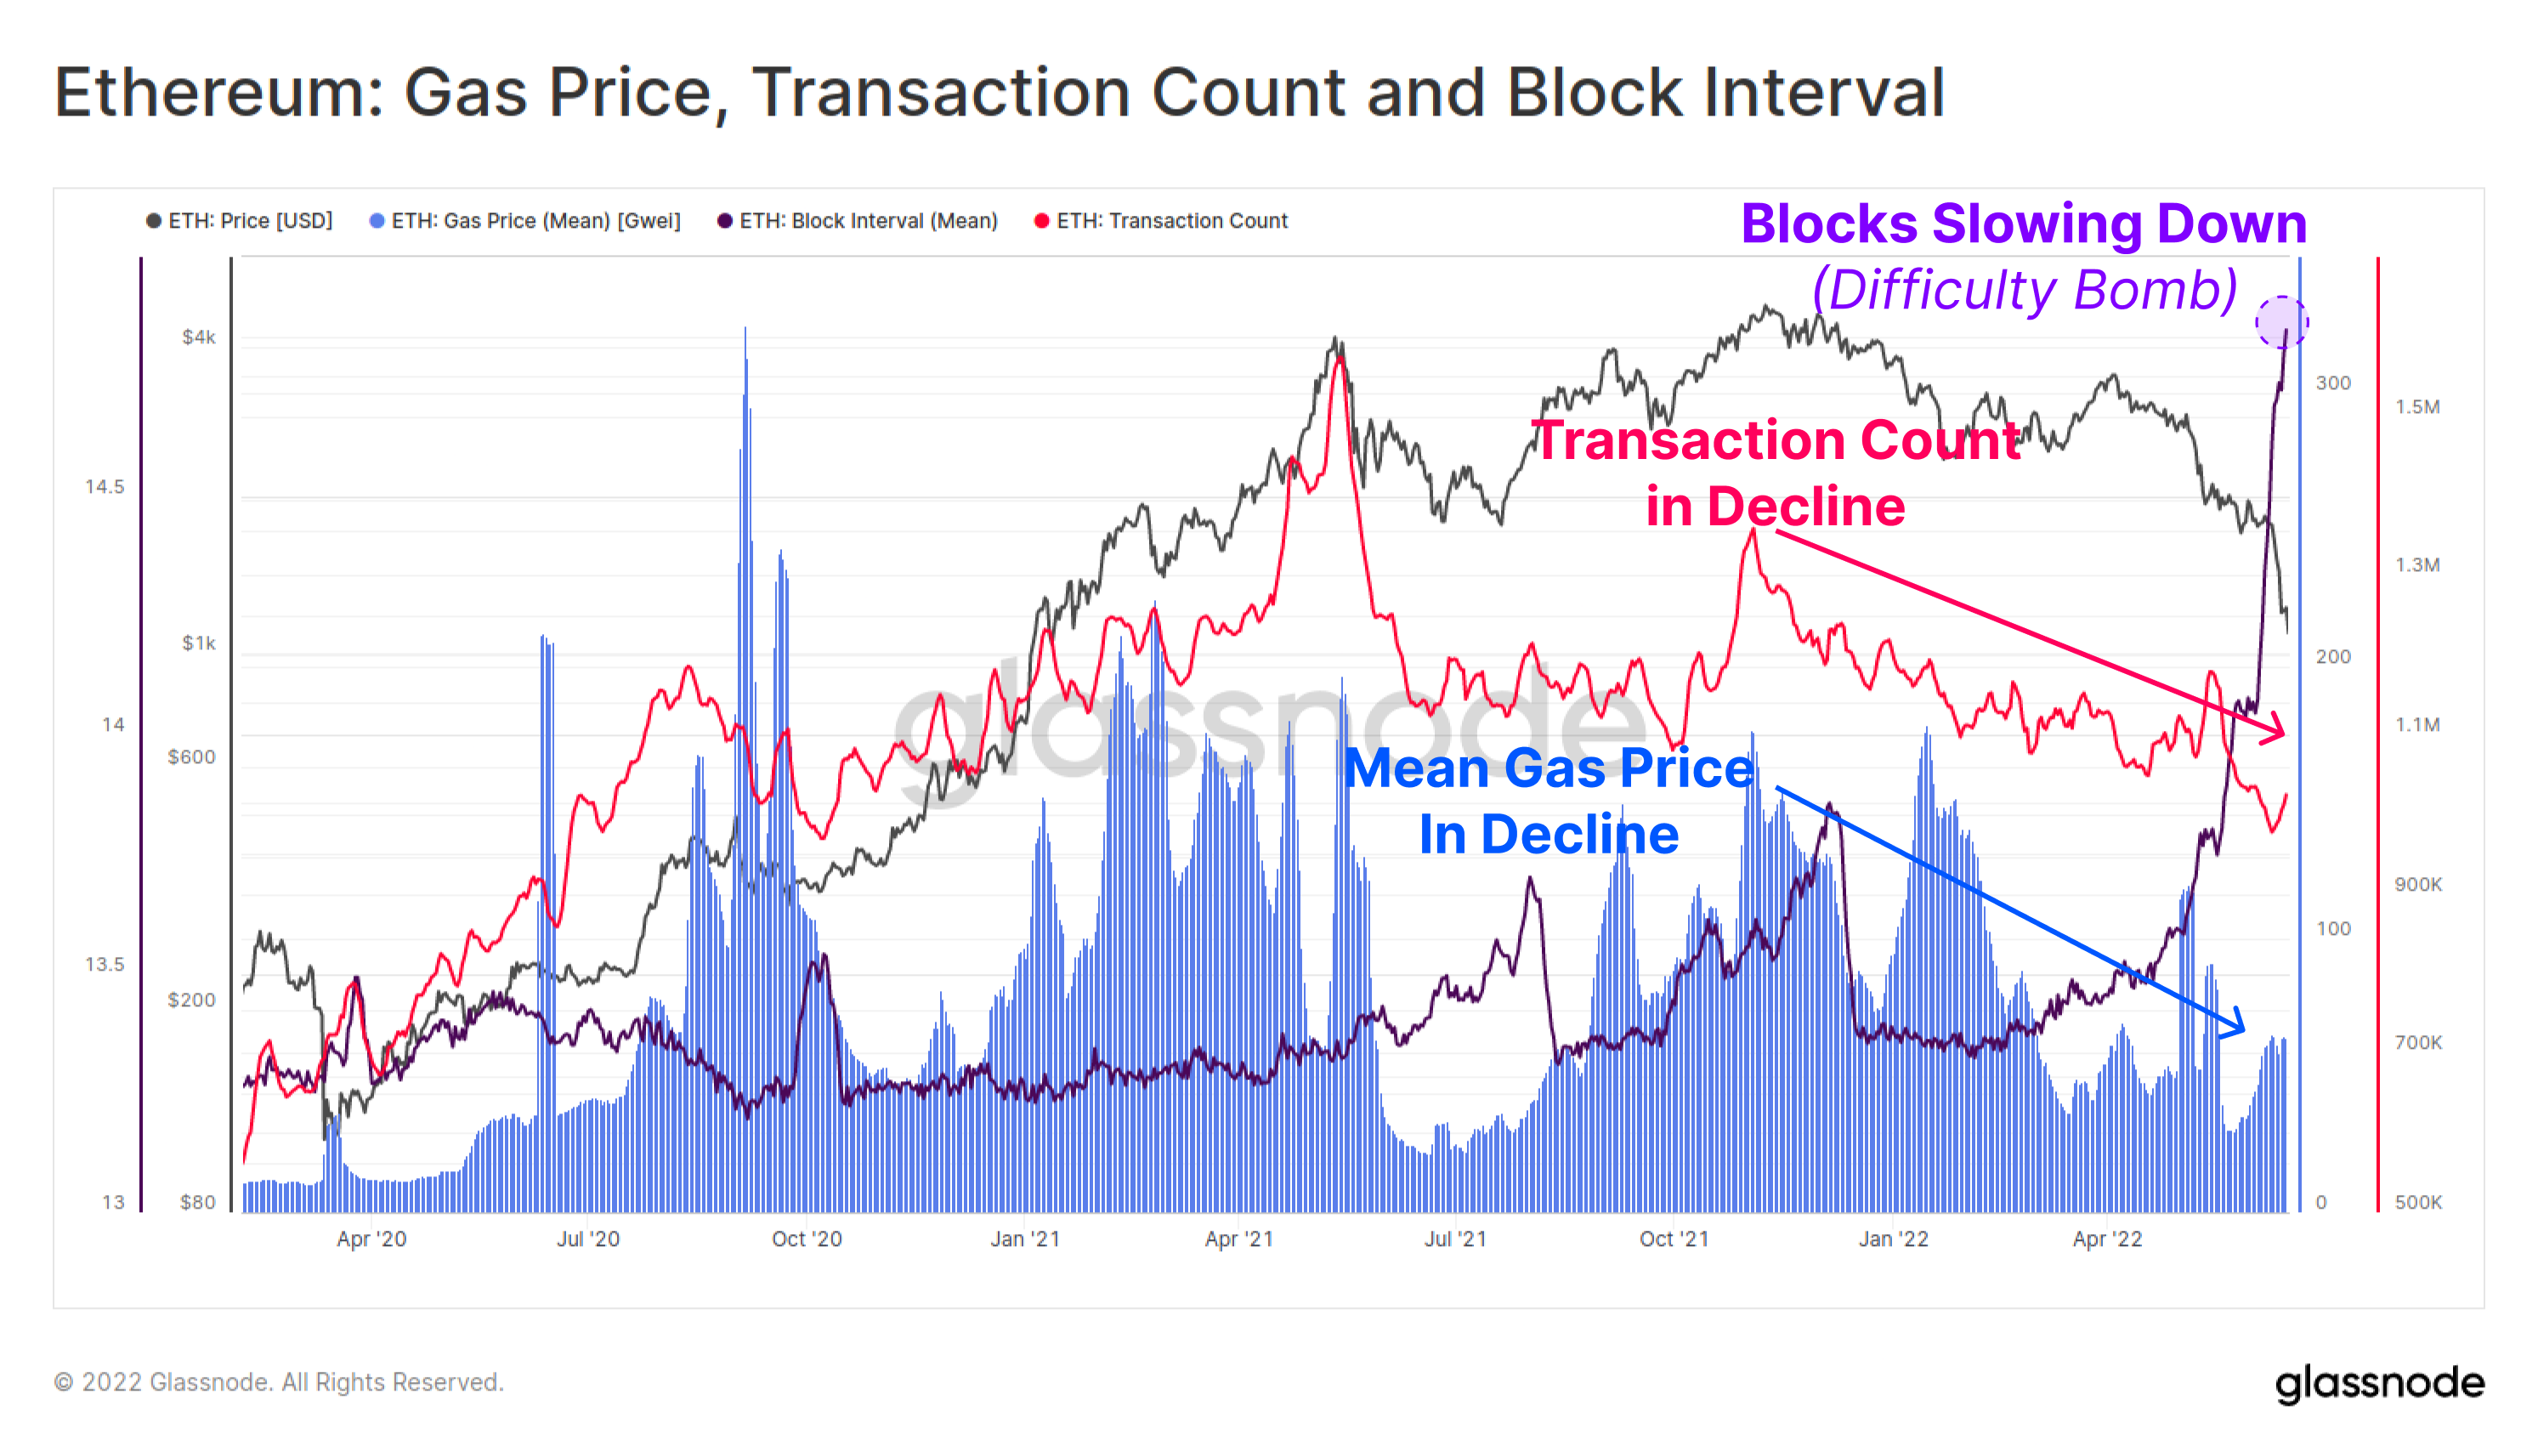
There were somewhat early signals that a decline in Ethereum usage and network demand was underway following the Nov ATH. Both the daily transaction count (pink), and average gas price paid (blue) have been in a near 6-month macro decline. This suggests that overall activity, demand, and utilisation of the Ethereum chain was softening.
The Mean Gas Price has recovered slightly in recent weeks, however this is more likely a result of congestion due to slowing block intervals (purple) as the difficulty bomb sets in for the upcoming Merge.
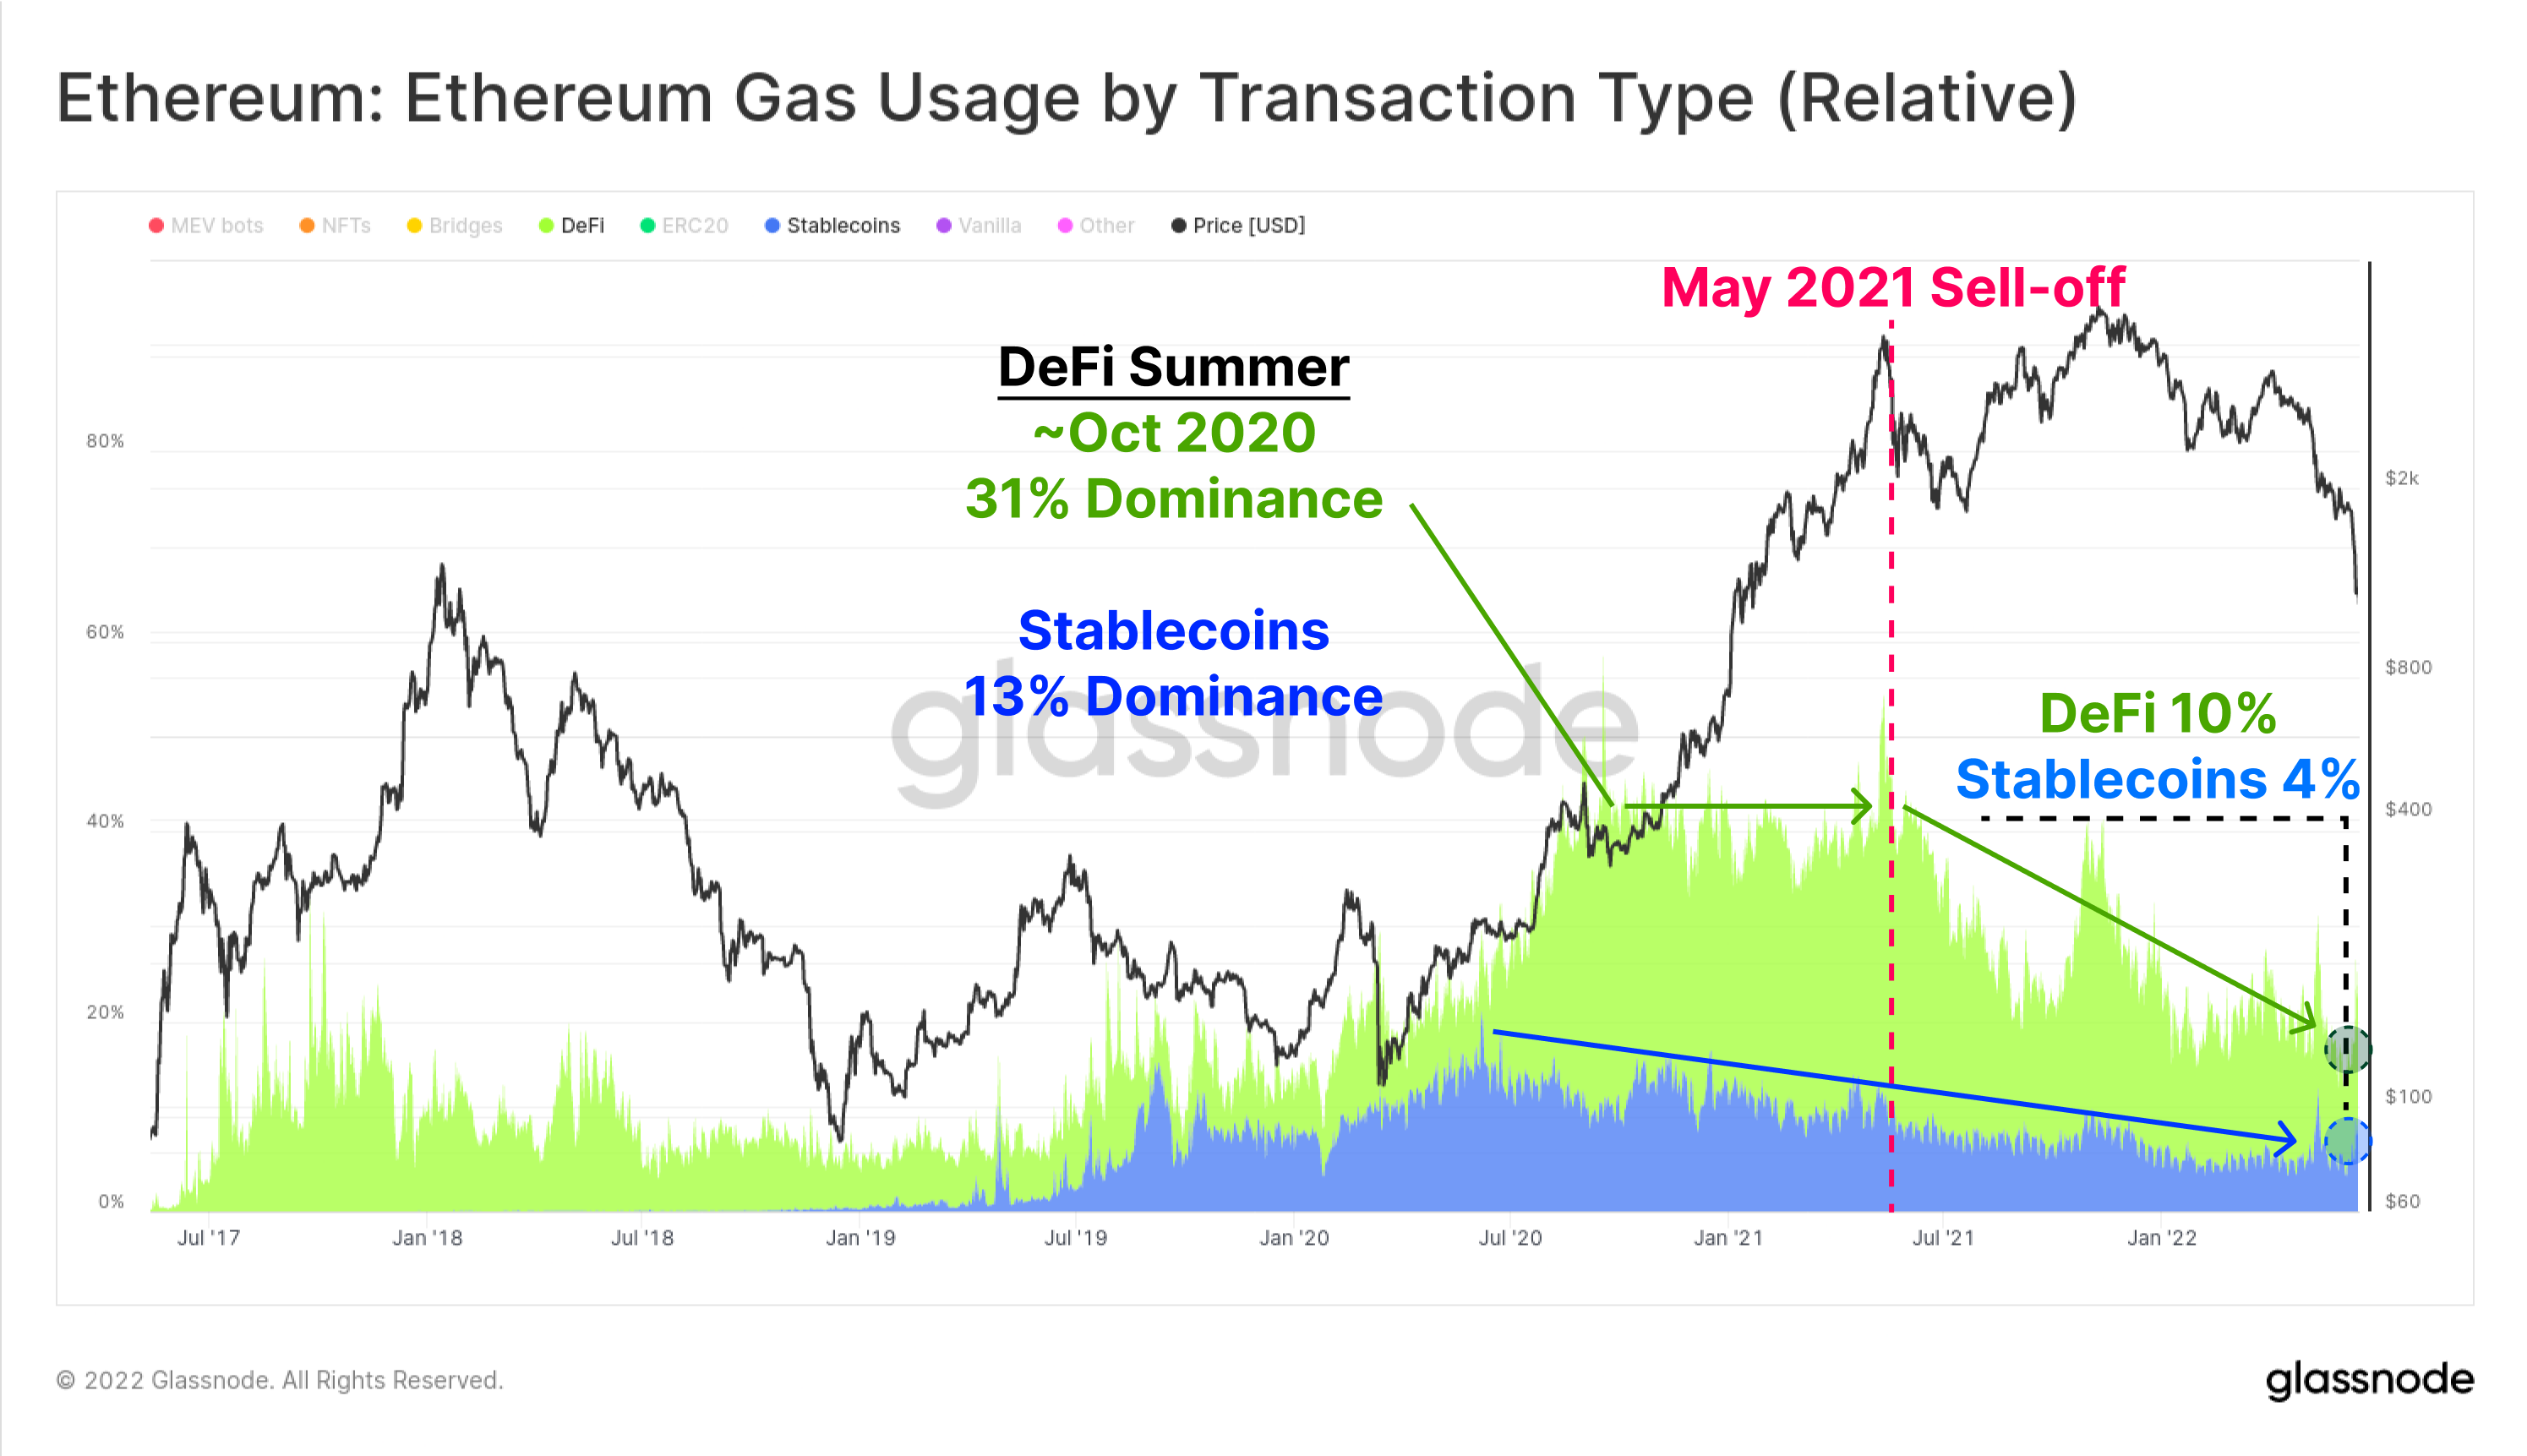
The chart below shows dominance by gas usage for stablecoins (blue) and DeFi applications (green). Stablecoin transfers, and DeFi protocols now represent 5.2%, and 10.2% of current Ethereum gas usage, respectively. This utilization dominance has steadily declined since the May 2021 market high, where Stablecoins and DeFi captured 11.4% and 33.4% of gas usage, respectively.
This is in part due to a crowding out by the NFT boom in the second half of 2021, but is is also indicative of declining demand profile.
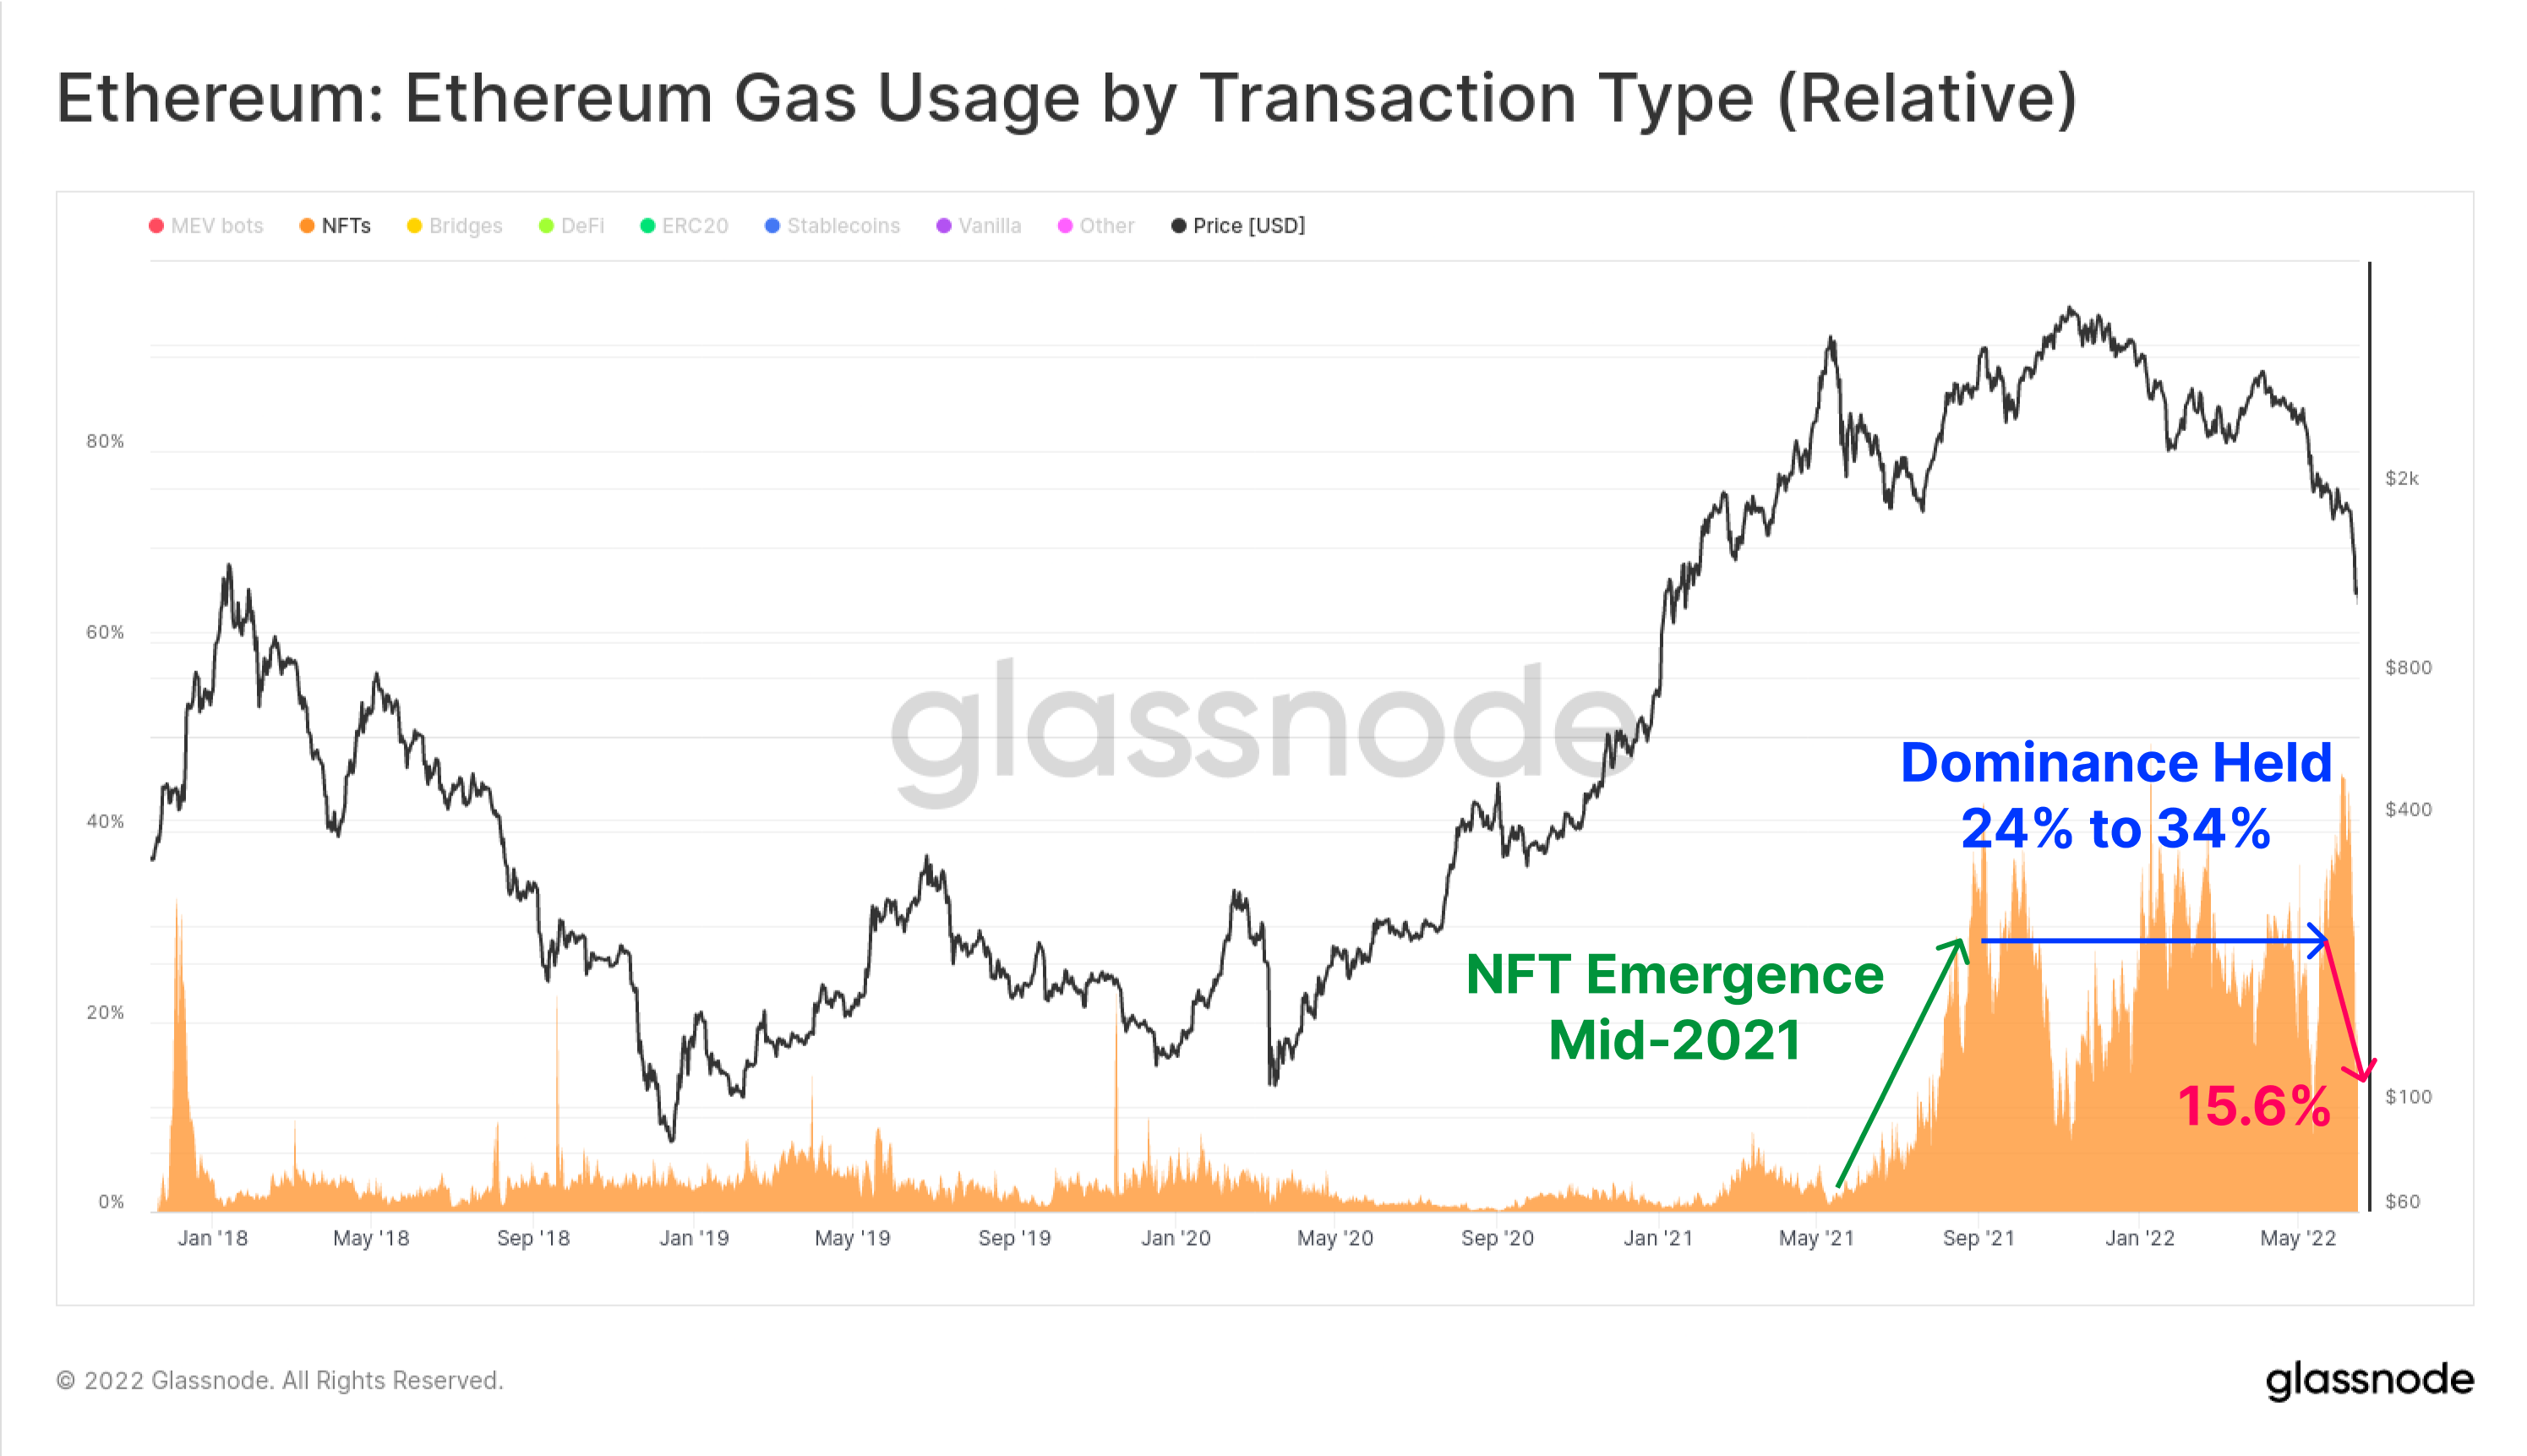
Across the NFT sector, the relative share of gas spent on NFT transactions did peak in the second half of 2021, but has since has declined from the high of 46.0% set in early June 2022, to just 19.6% today. NFT transactions emerged into a booming trade throughout 2021-22, maintaining upwards of 20% of all gas usage through this time.
It possible that the recent peak and then drop in NFT gas usage is indicative of a macro shift towards an increasingly negative investor reaction to market volatility.
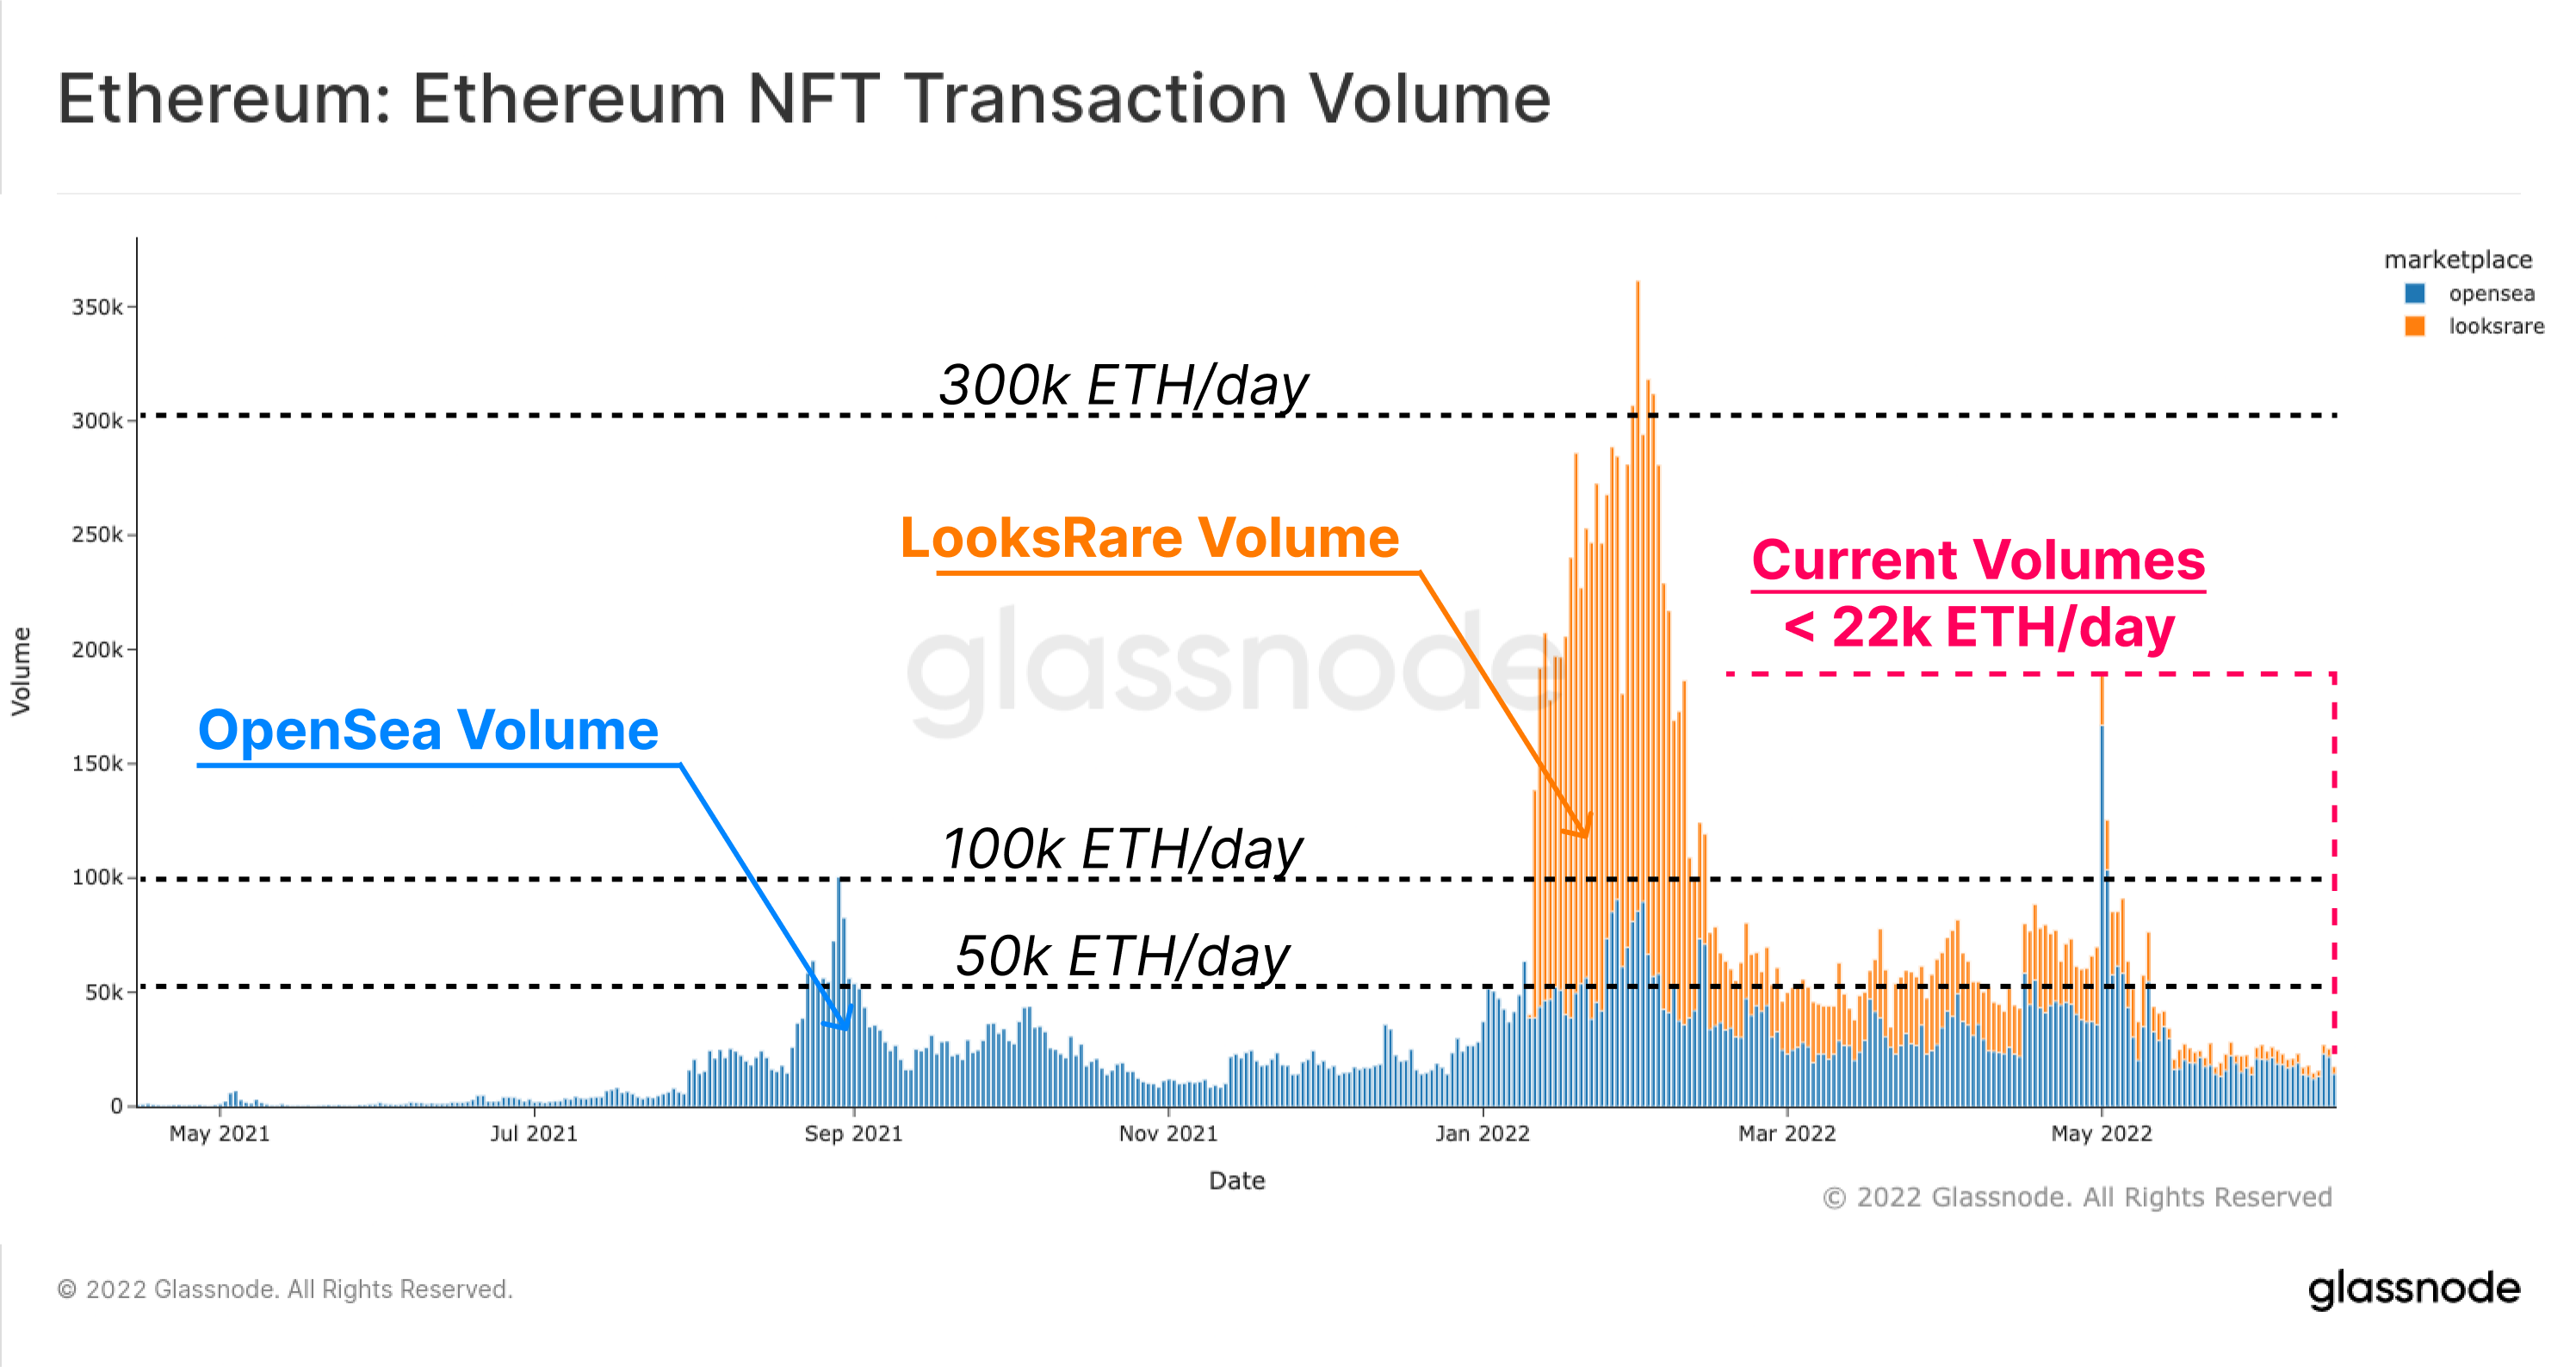
A similar observation can be made with respect to NFT trade volumes. The chart below shows the ETH denominated trade volume for OpenSea (blue) and LooksRare (orange), which held daily trade volumes between 50k ETH and 100k ETH per day through much of 2022. However, trade volumes dropped off precipitously after May this year, currently holding just above 22k ETH/day (approx $24.2M/day @ $1,100 ETH).
Across many facets of the Ethereum ecosystem, the demand profile has been waning, with general application usage in decline, and network congestion easing after the Nov 2021 ATH, and a cooling off of NFT markets becoming evident in recent weeks.
Sizing Up the Unwind
One of the more popular metrics within the DeFi ecosystem is the concept of Total Value Locked (TVL), which attempts to track the USD, or ETH denominated value of tokens deposited in a variety of DeFi protocols. These include money markets, lending protocols, decentralized exchange liquidity pools, and many more.
A popular use of DeFi protocols is to obtain leverage, often via the borrowing of USD based stablecoins against crypto collateral. In many instances, this leverage is then traded and/or redeposited into DeFi protocols, creating a form of on-chain rehypothecation.
With capital increasingly taking risk-off positioning, the TVL in DeFi protocols has seen a dramatic unwind. This is a result of two primary mechanisms:
- Leverage, and recursive borrowing positions accumulated by the market during the bull being closed out, either by discretion, or via liquidations.
- The value of crypto collateral falling as tokens locked in DeFi protocols are repriced lower, often as a result of sell-side generated by point 1 above.
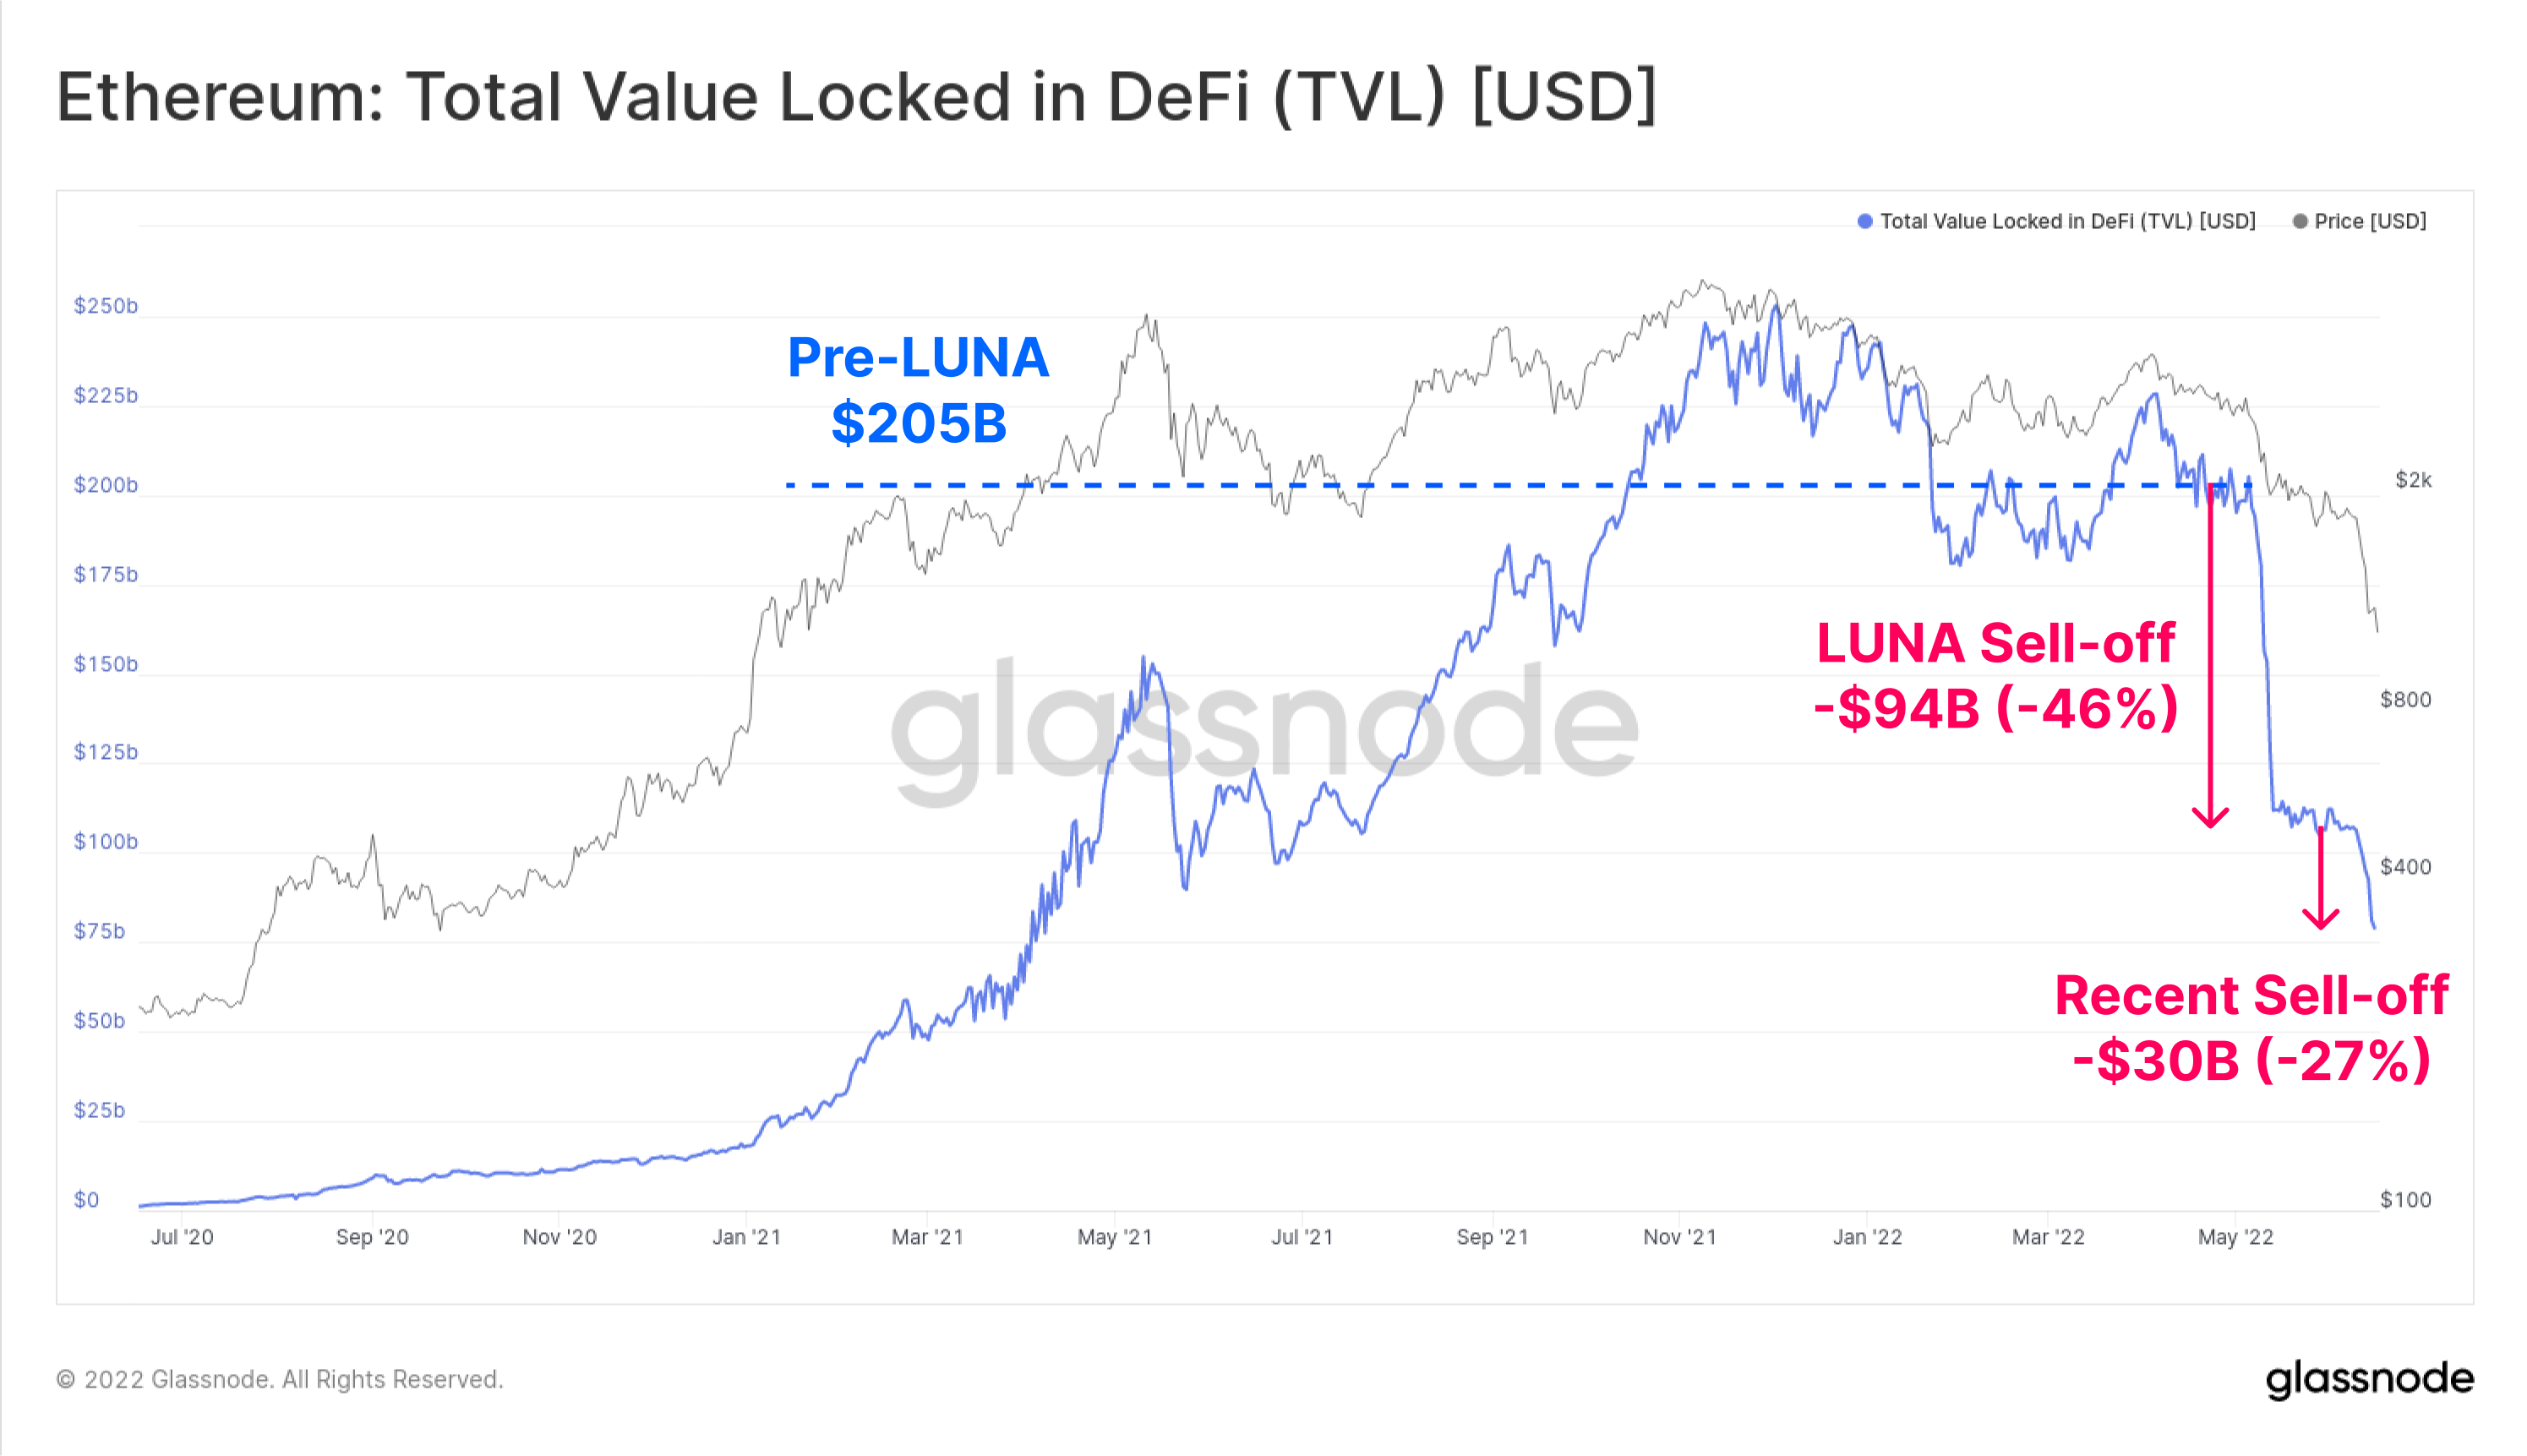
TVL on Ethereum has declined by $124 Billion (60%) over the last six weeks, driving total TVL down to $81B. Through May and June, this unwind has occurred in two tranches, first to the tune of -$94B during the collapse of the LUNA project, and then another -$30B in mid-June.
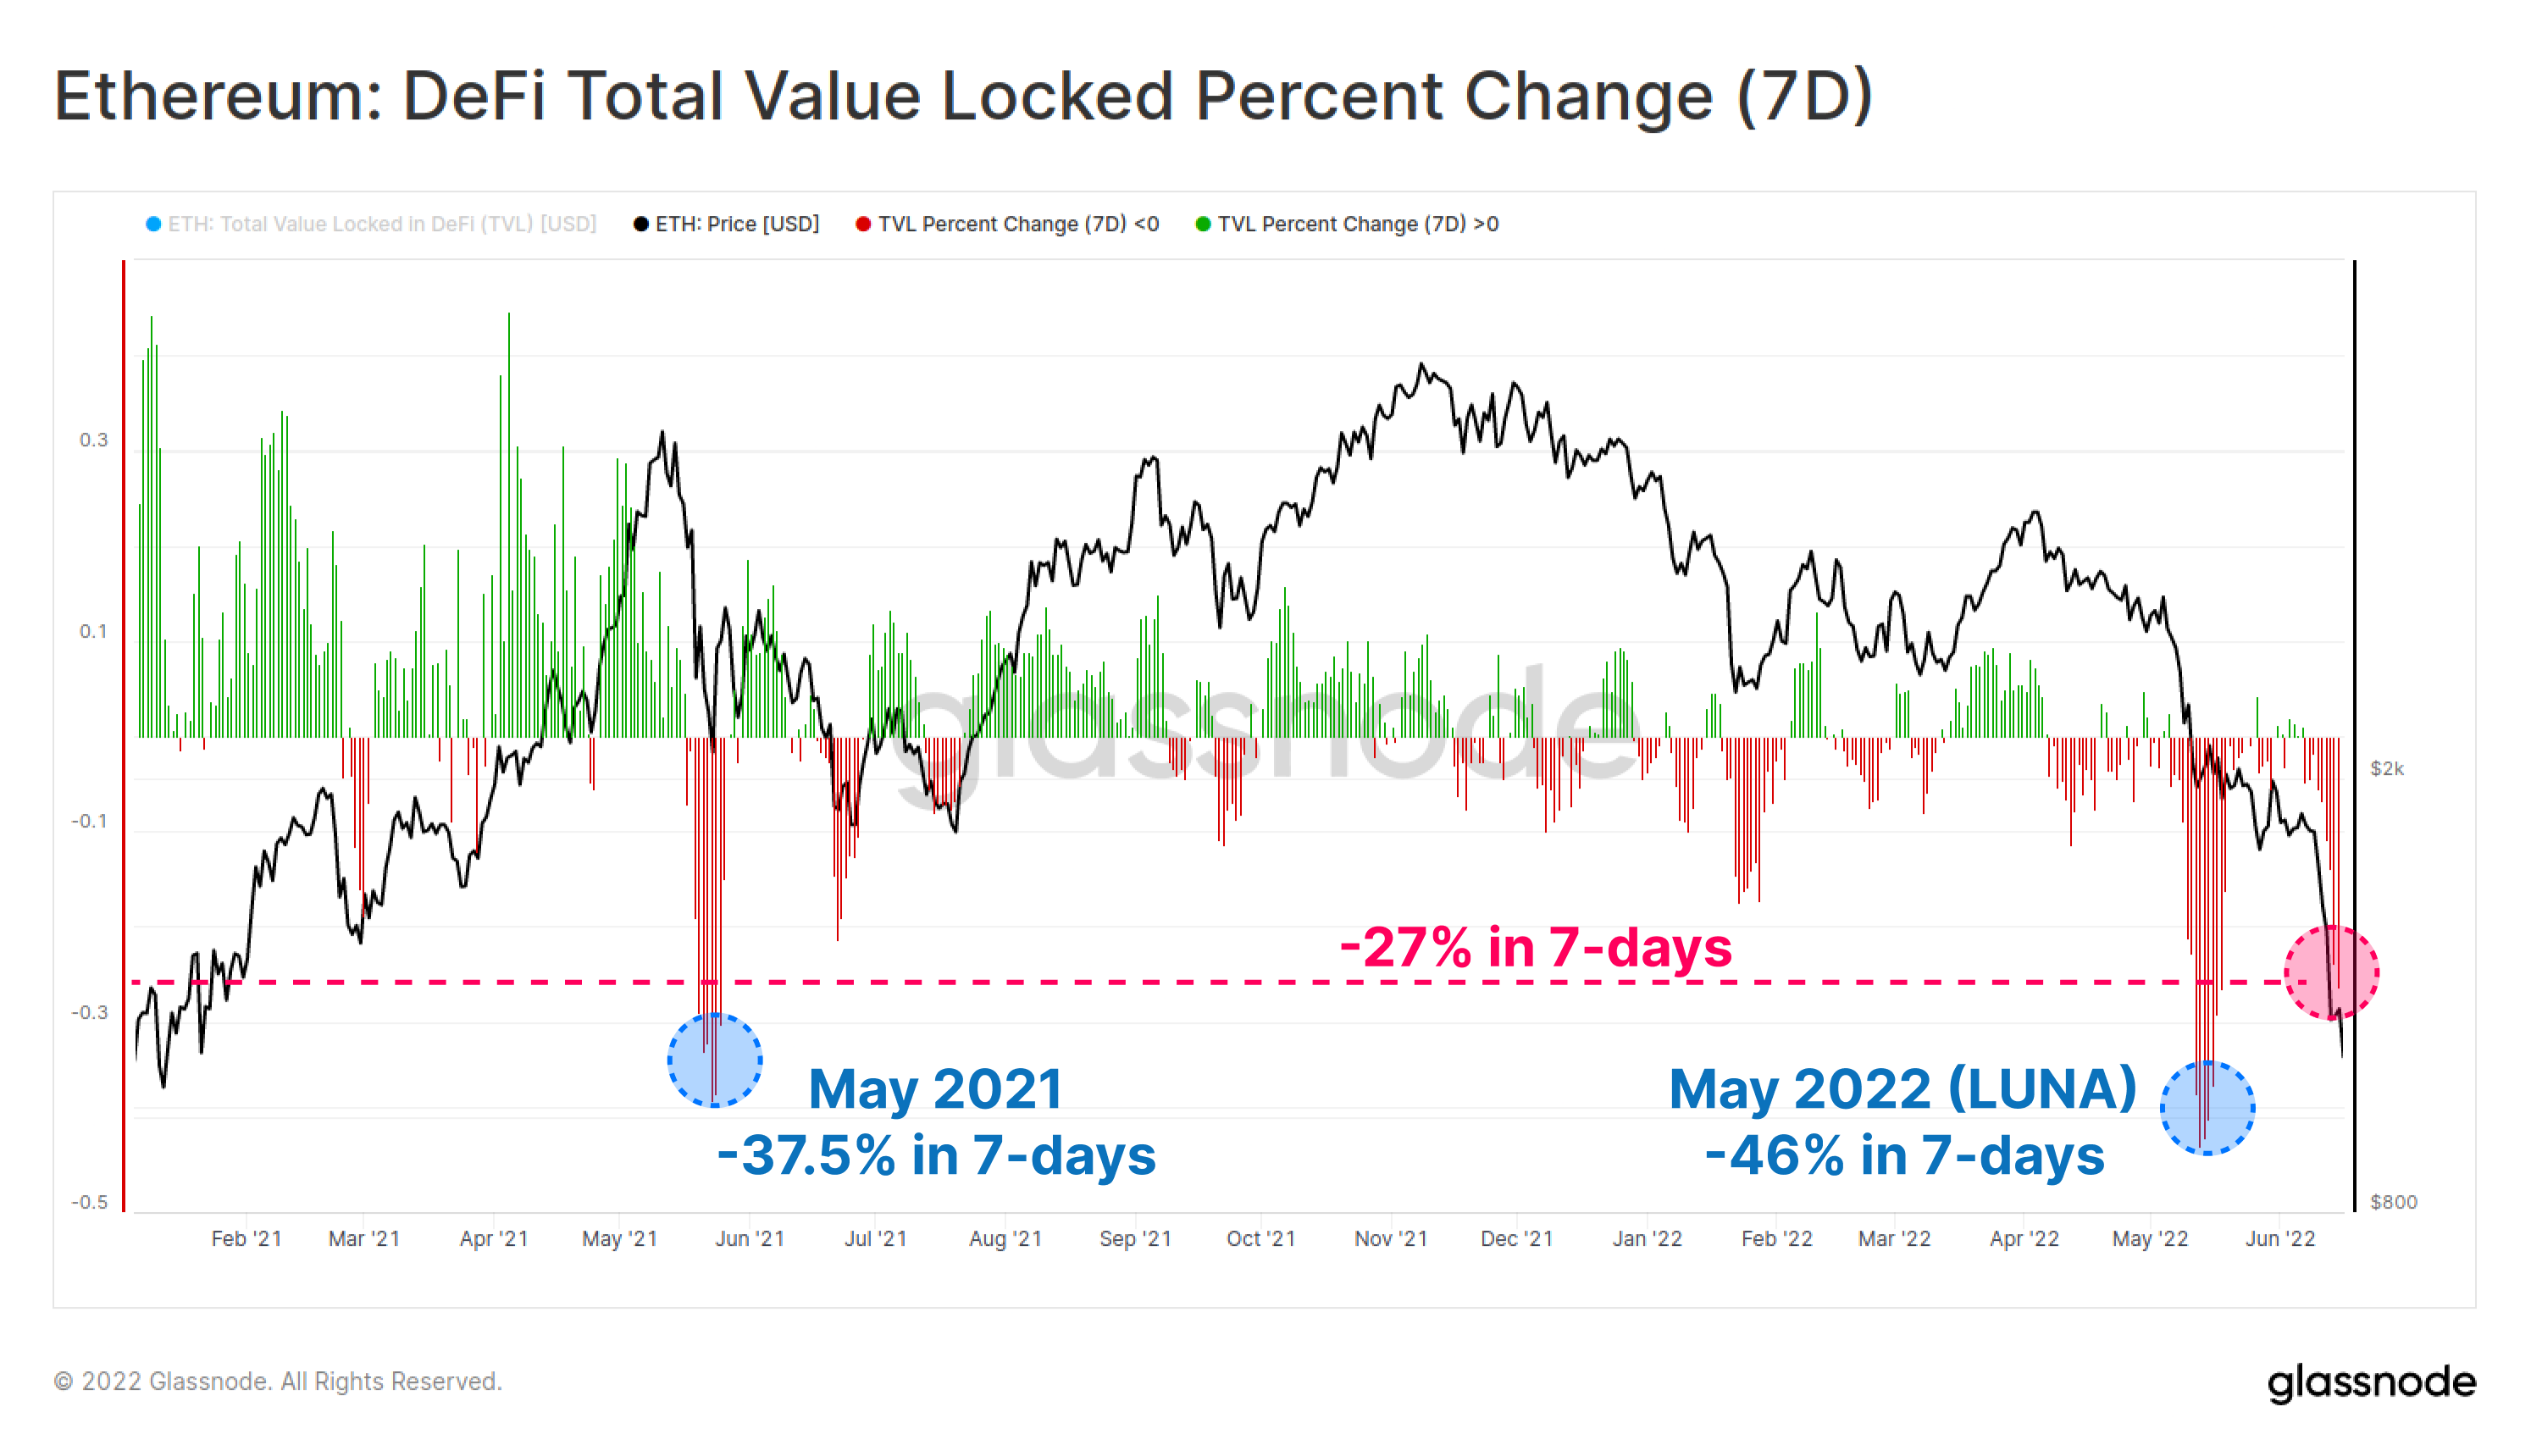
On a 7-day basis, both of these recent TVL flush-outs stand out as some of the most significant in the last 18-months. The recent sell-off has precipitated a TVL contraction of -27% in TVL in one week.
There are only two larger scale deleveraging events by this metric; the first being -46.0% associated with the recent LUNA collapse, and -37.5% during the sell-off from the then-ATH set in May 2021.
The Stablecoin Flippening
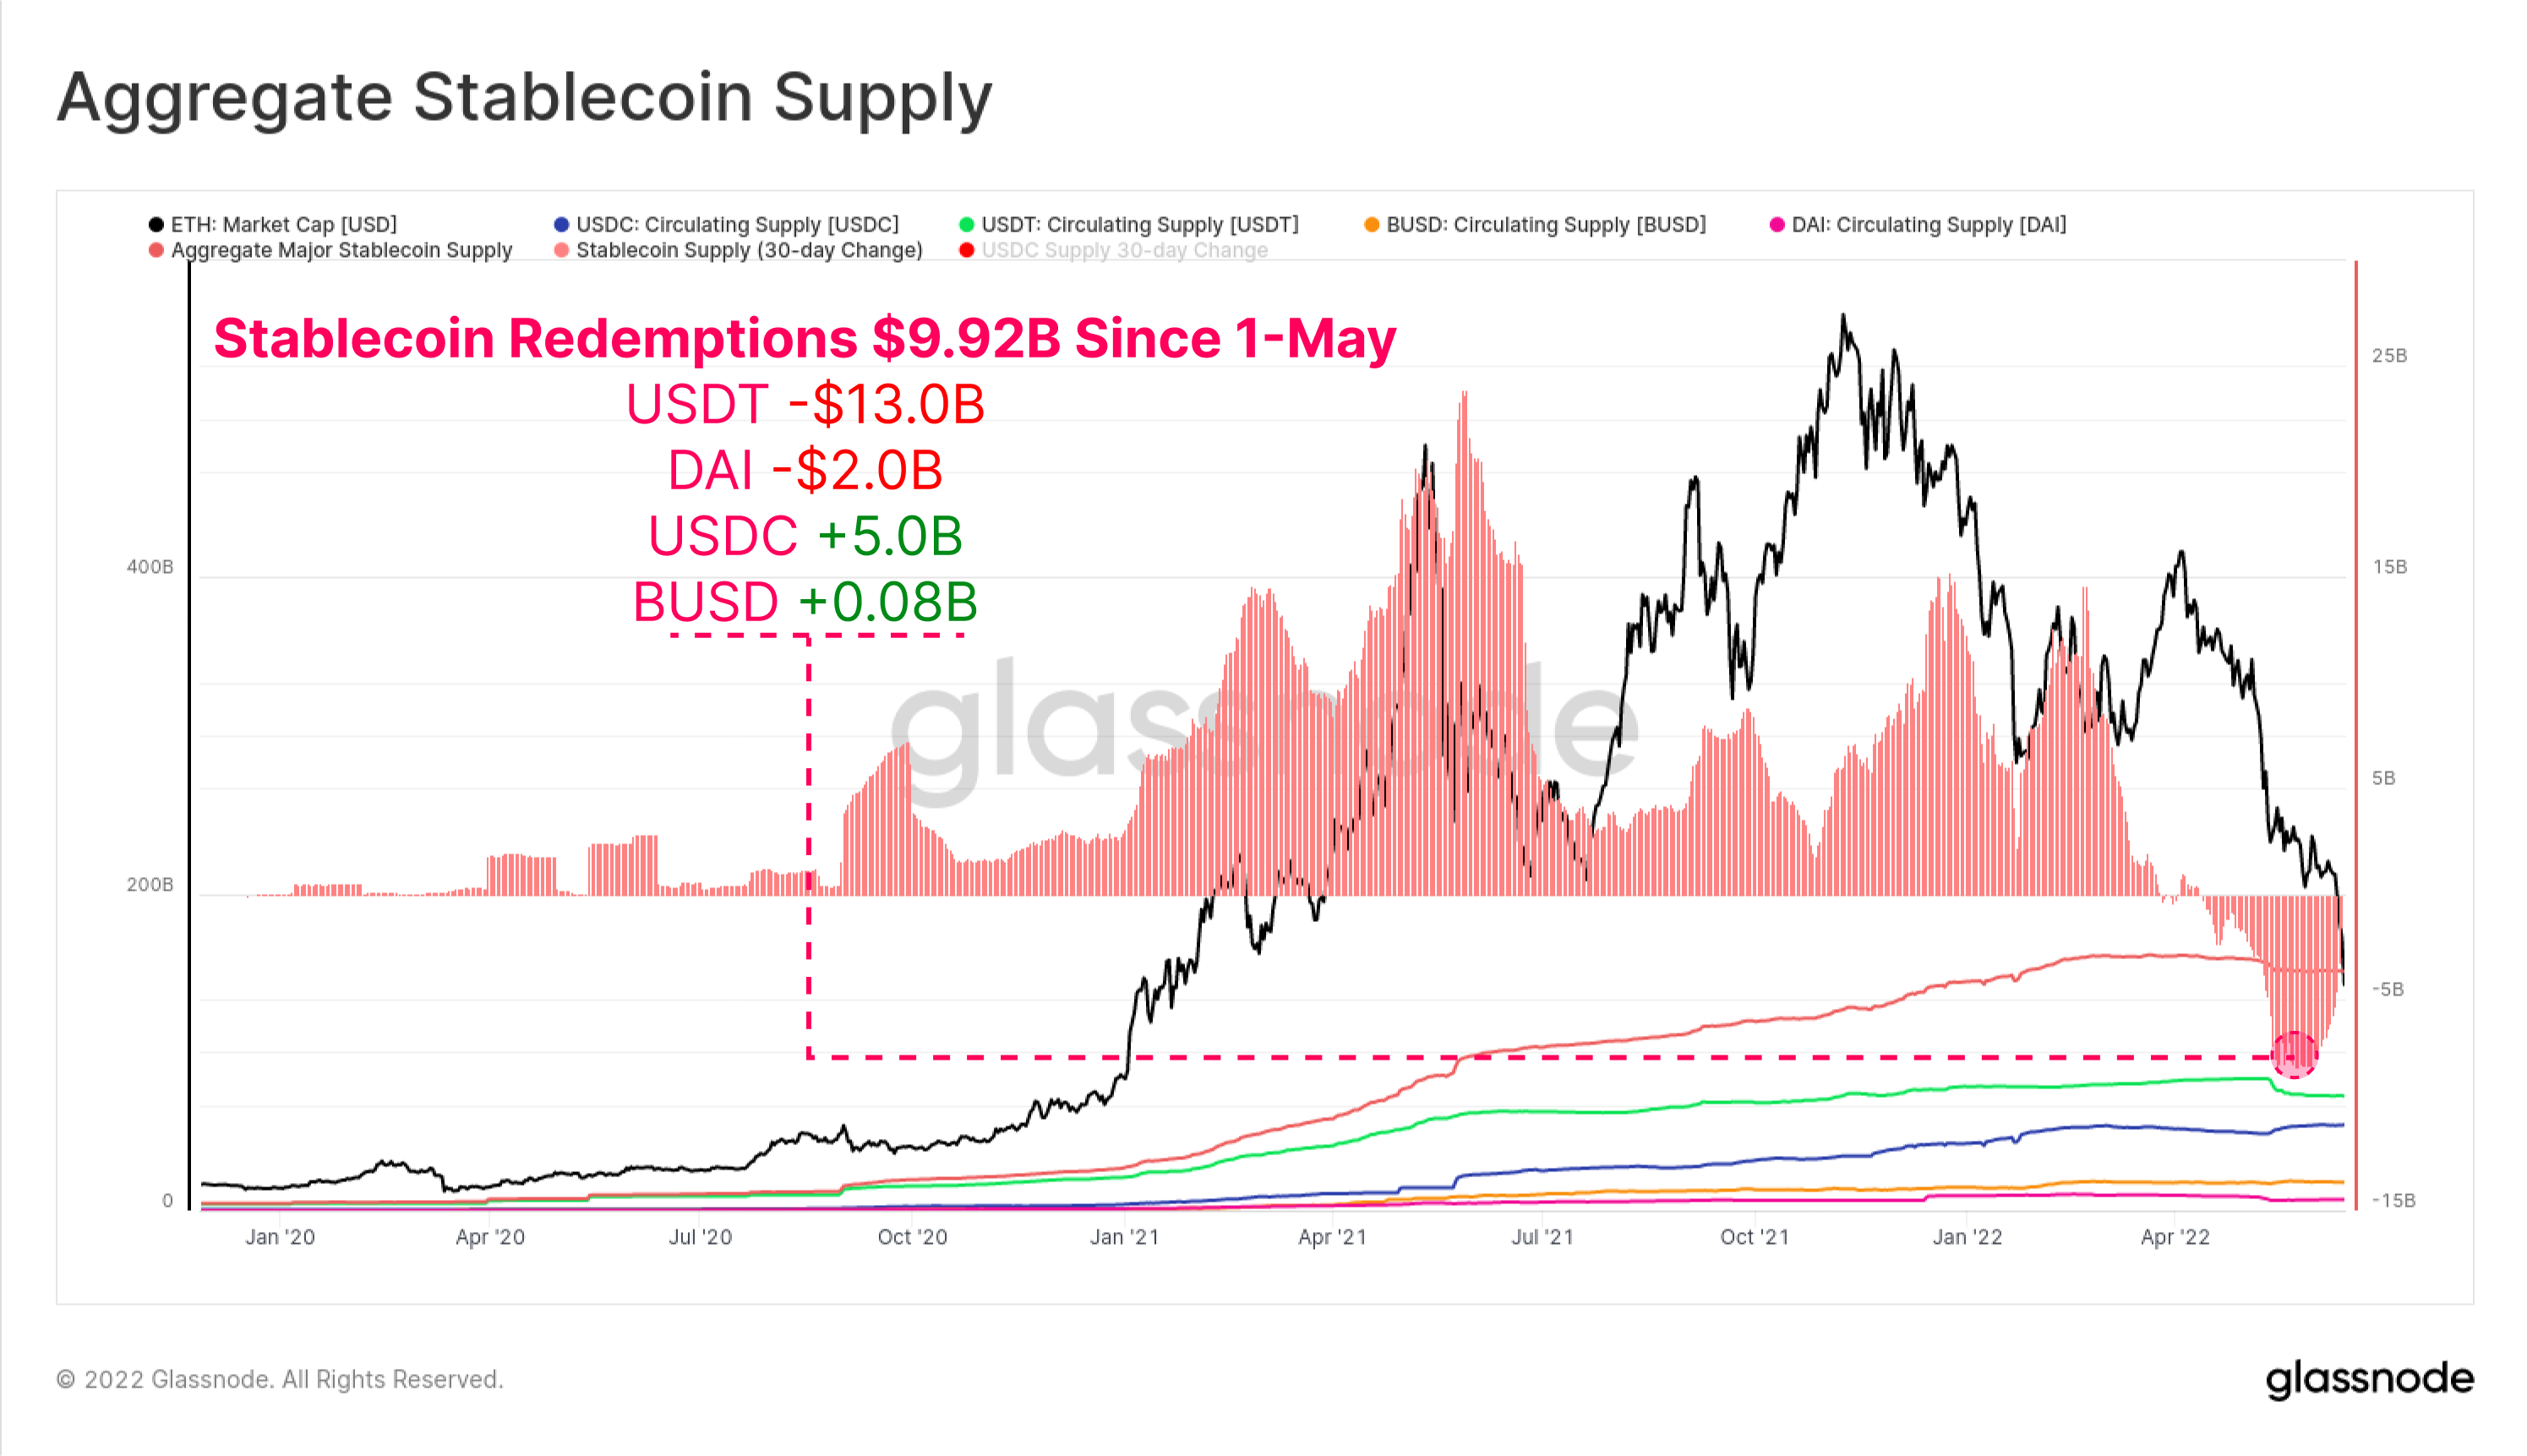
Since the start of May, total stablecoin redemptions have totalled $9.92B in total capital outflow from the market. USDT has seen the largest redemptions of -$13.0B, followed by DAI with -$2.0B, as investors close out leverage (or are liquidated) obtained via MakerDAO vaults.
Interestingly, USDC supply has grown by $5.0B since 1-May, signalling a possible shift in market preference away from USDT and towards USDC as the favoured stablecoin.
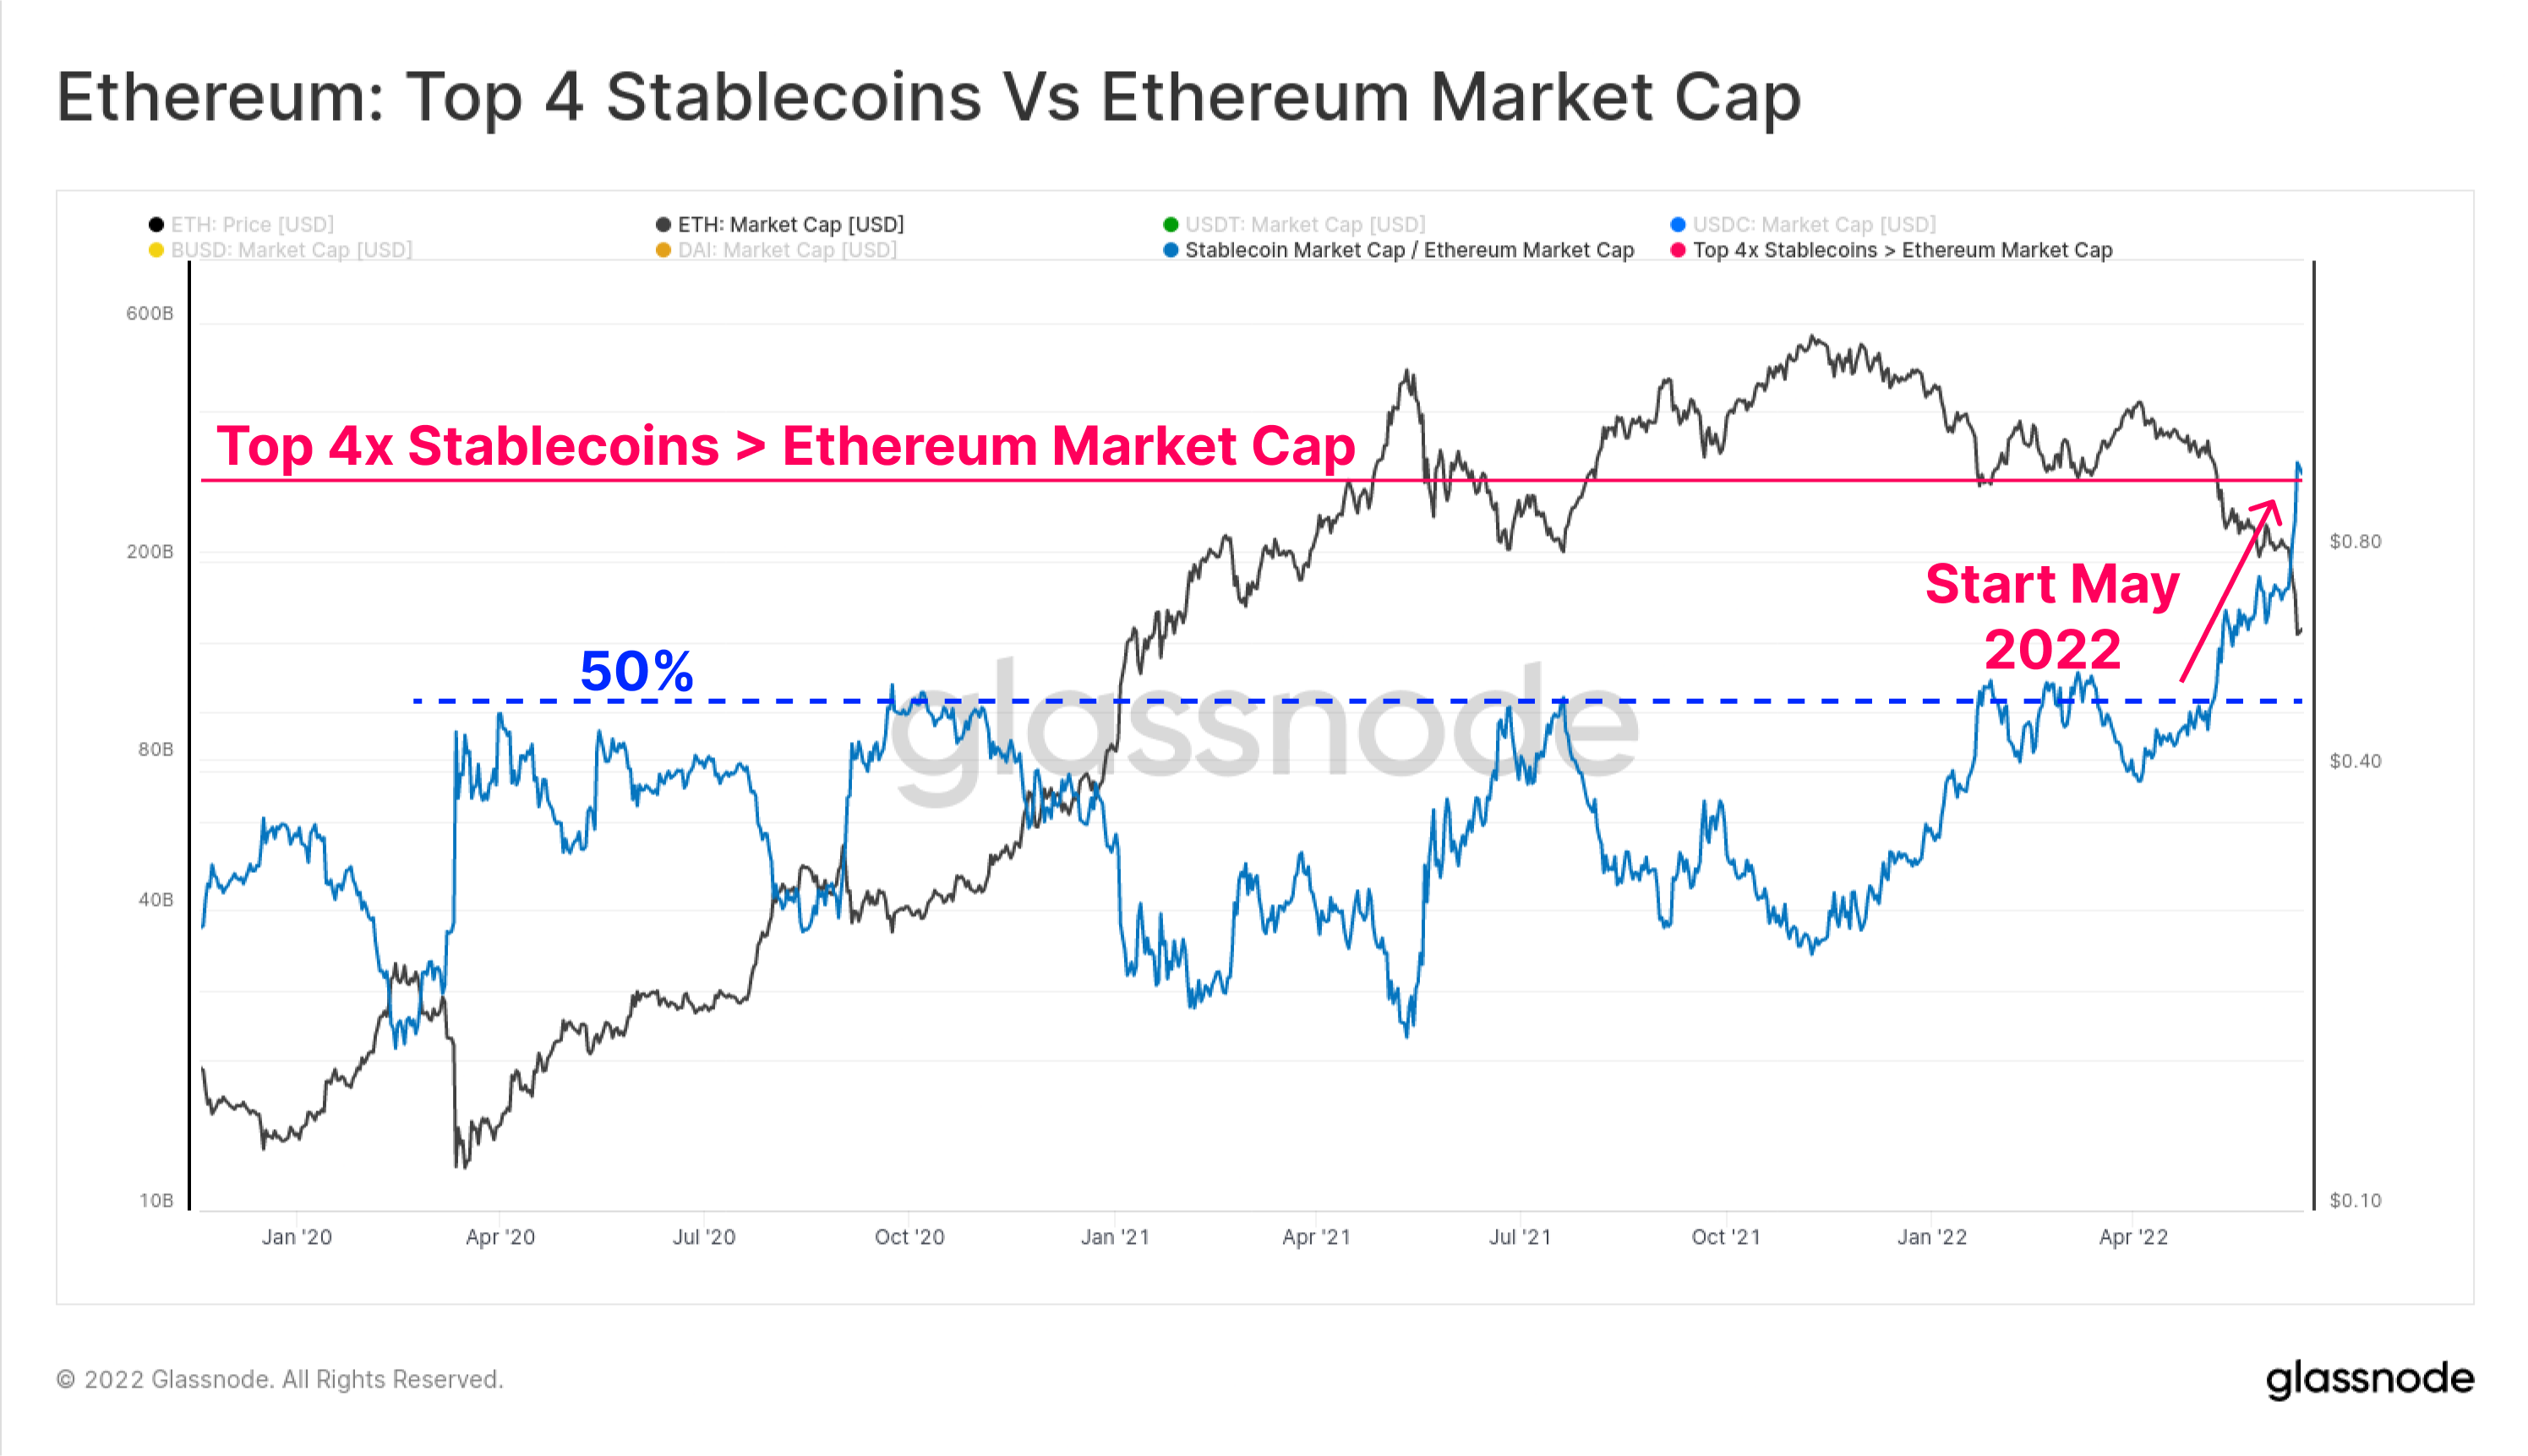
The aggregate capitalization of the top 4 stablecoins (USDT, USDC, BUSD and DAI) have also now overtaken the Ethereum market cap by $3.0B. The aggregate Top 4 stablecoin cap had previously topped out at 50% of Ethereum's Market Cap on multiple occasions throughout 2020-22, however has seen a dramatic break-higher in May and June this year.
This is the first time such an event has happened, and the event puts three observations about digital asset market structure into perspective:
- The dramatic rise of USD stablecoins as the unit of account and quote asset.
- How strong the demand for dollar denominated liquidity has been in recent years. We note that stablecoins now account for three of the top six digital assets by market cap.
- The sheer magnitude of depreciation of the Ethereum ecosystem valuation over the course of 2022.
Note that not all stablecoins are hosted on Ethereum, and a smaller sub-set are borrowed capital from DeFi protocols. Nevertheless, this event highlights why the present deleveraging is taking place, as the disparity between the value of crypto-collateral, and the unit of account for margin debt (USD stablecoins) widens.
Latest Ethereum Research: A Short History of the Etherverse
Our latest research piece explores the Etherverse from the perspective of the market share captured by various use cases in relation to on-chain transactions, and gas consumption.
A Network Underwater
One of the most powerful tools in on-chain analysis is the ability to calculate the Realized Price for sectors of the market. This enables estimation of a cost basis of these cohorts by valuing each coin at the time it last moved between wallets.
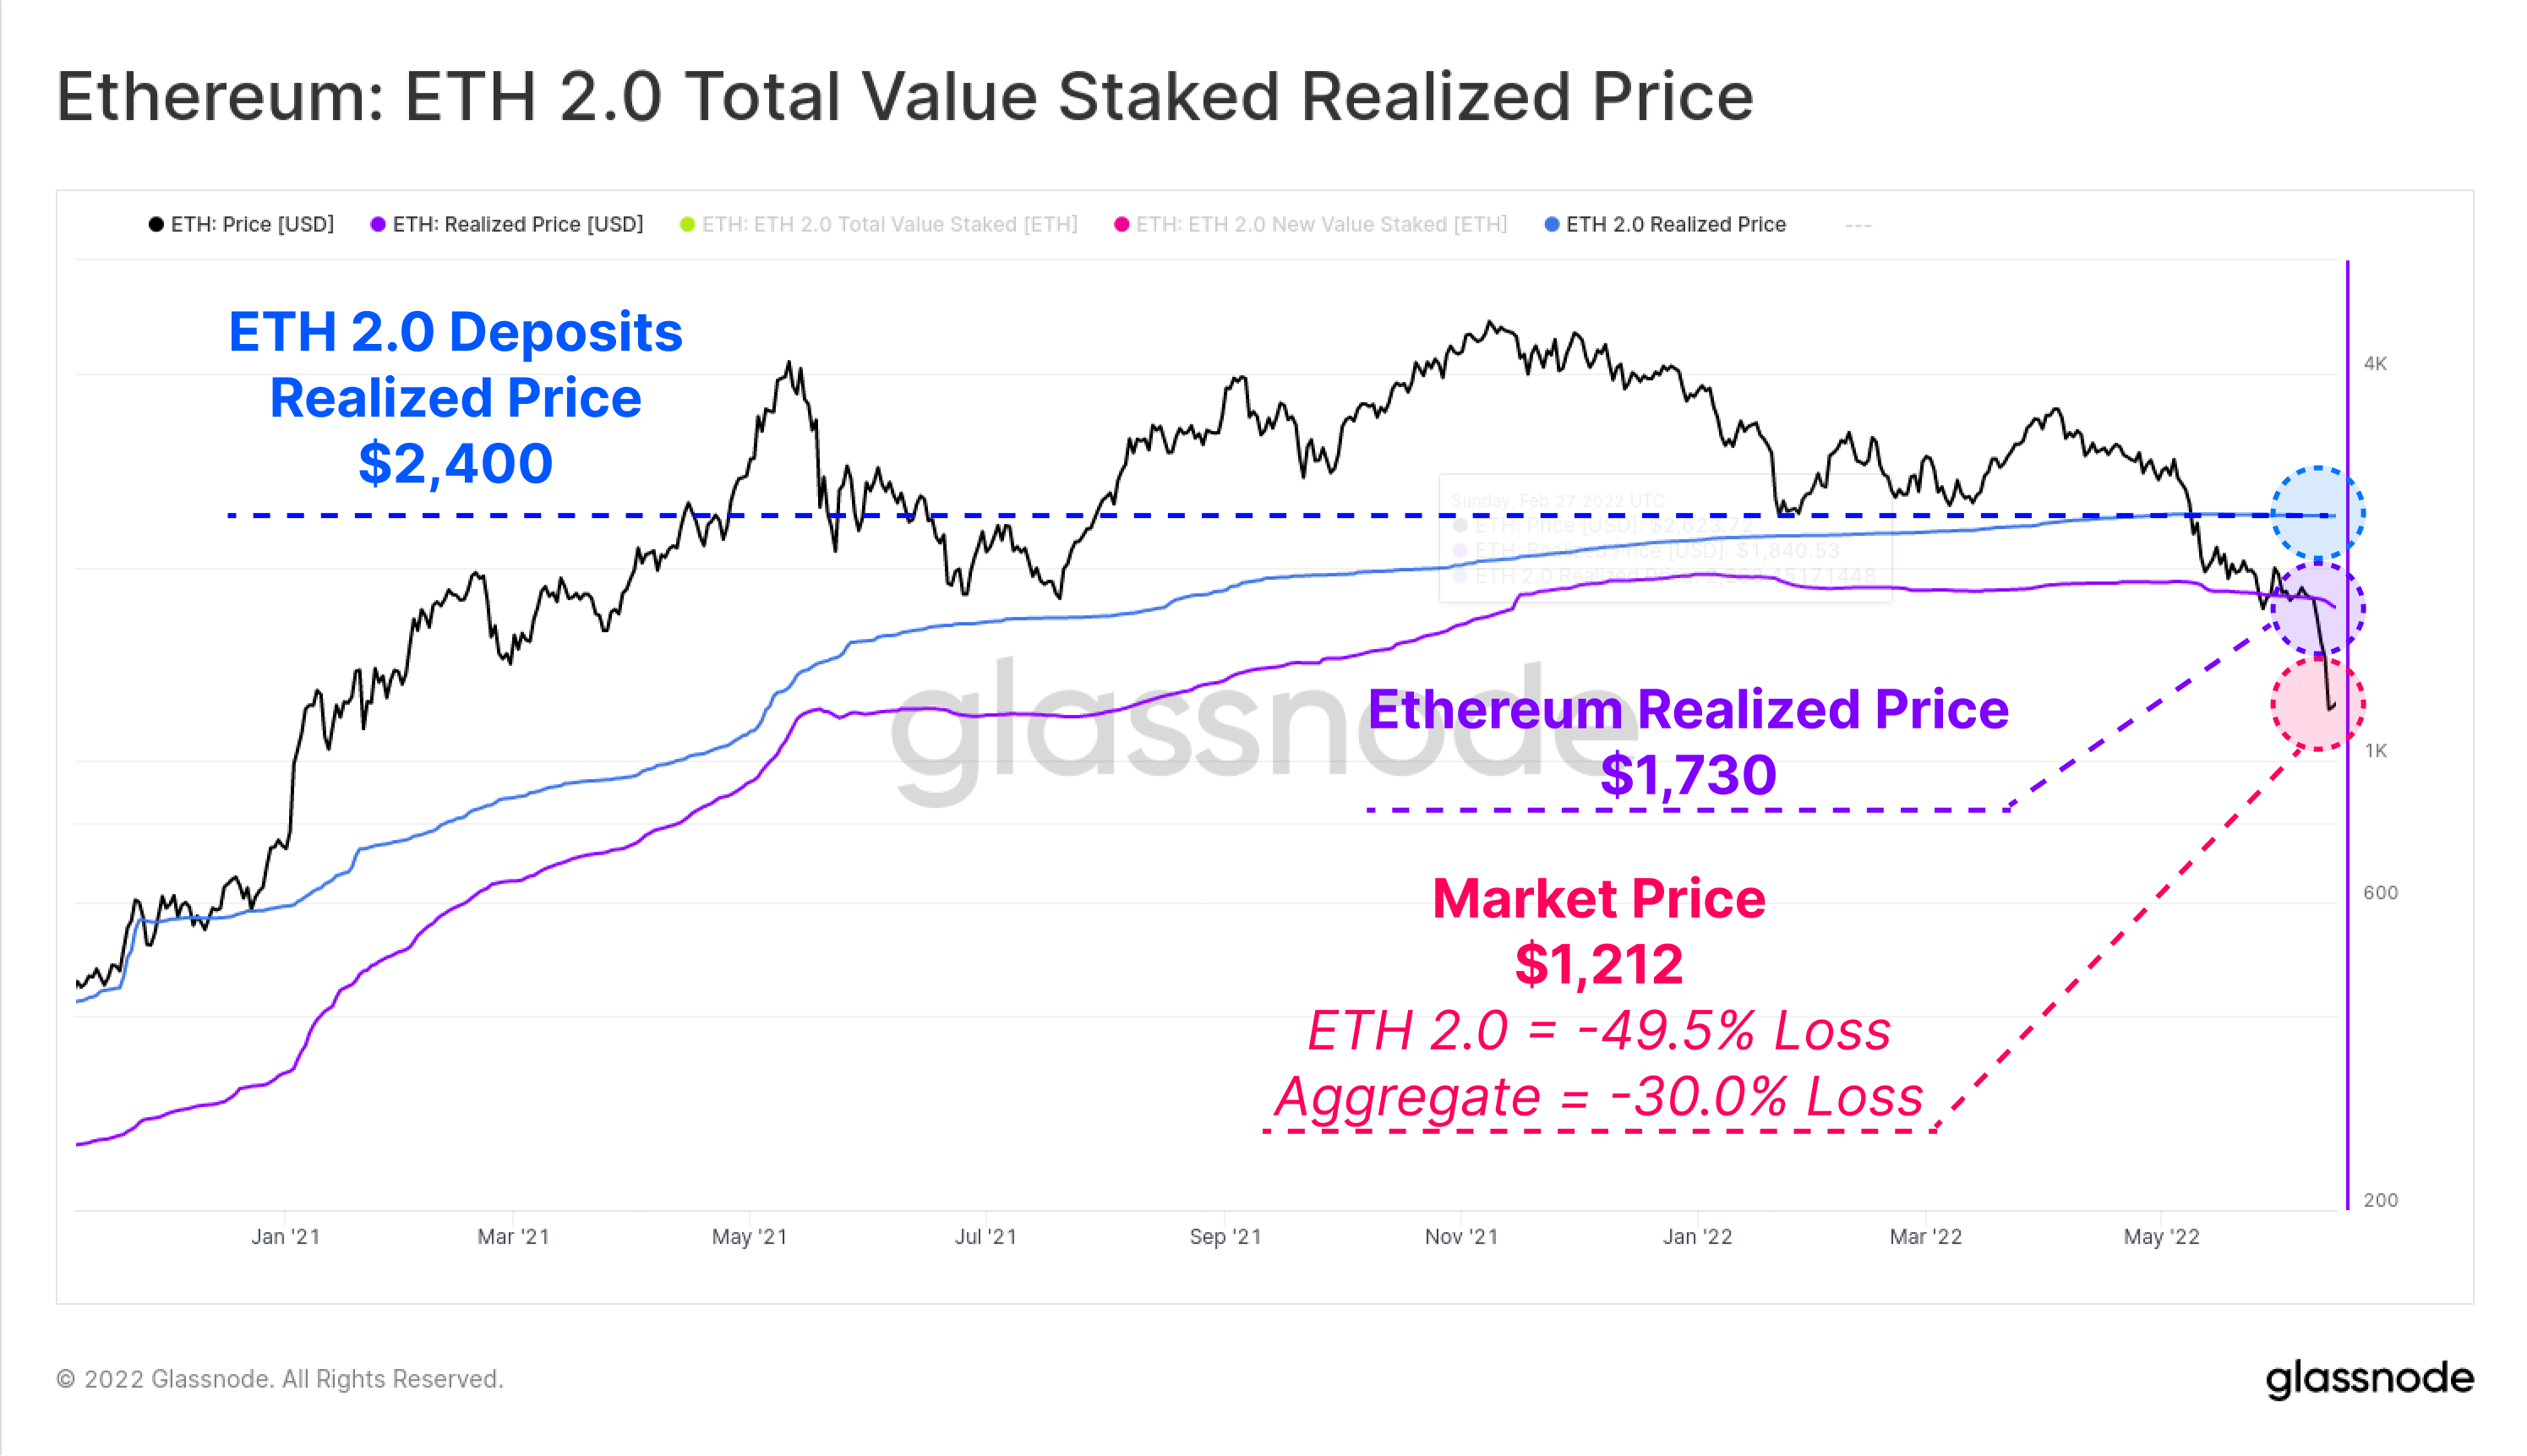
With the ETH spot price now trading at $1,212, the aggregate market is now well below the Realized Price of $1,730. This means the market is holding an average unrealized loss of -30.0%.
If we look specifically towards ETH 2.0 depositors, we can directly measure the value of the ETH tokens at the time they were deposited since they cannot be unstaked. On this basis, ETH 2.0 depositors have a much higher realized price cost basis at $2,400, and are therefore carrying an average unrealized loss of -49.5%.
It is worth noting that some of these deposits will be associated with liquid staking derivatives such as Lido’s stETH, which does allow individual investors to sell the asset without affecting the realized price of the original deposits.
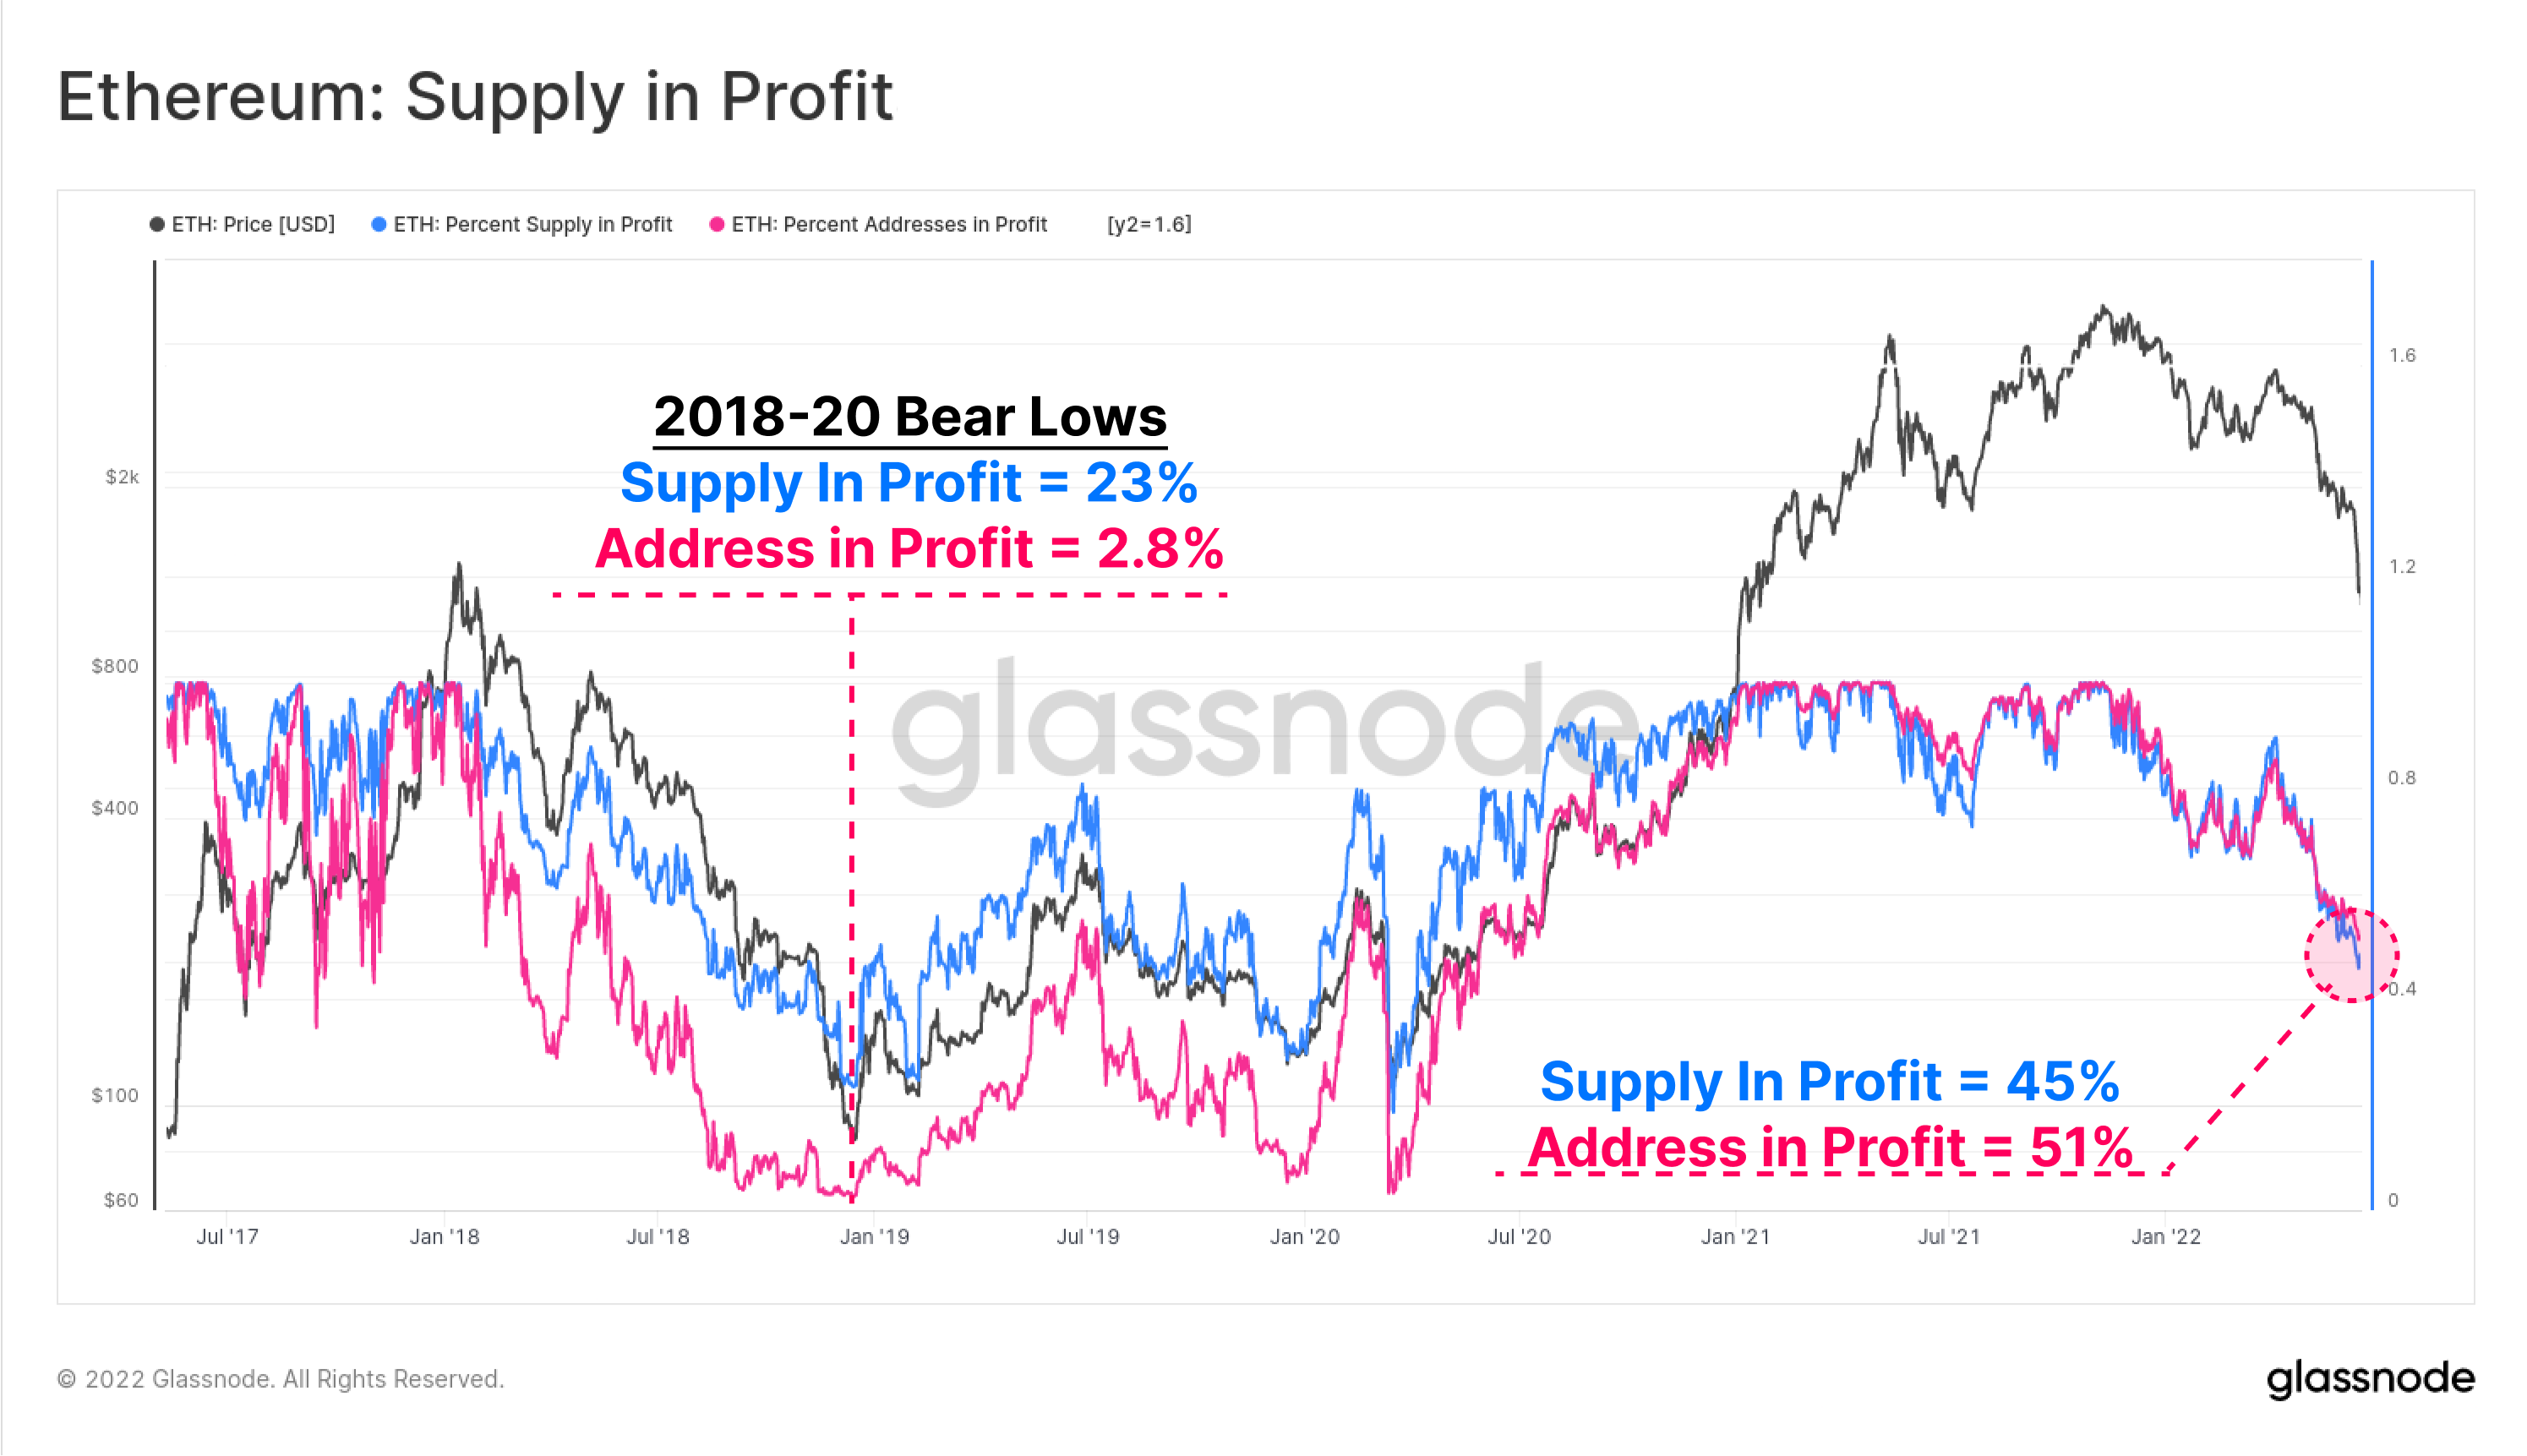
The Percentage of Supply (blue) and Addresses (pink) in Profit are two high-level on-chain metrics to gauge the current financial pain in the Ethereum market against past cycles. Network profitability has now reached the lowest levels since June 2020, when the market was recovering from the COVID crash.
Profitability of supply and address are both suggesting around half of Ethereum holders are underwater on their holdings. Note the 2018, 2019, and 2020 bear market lows reached profitability as bad as 23% of supply and just 2.8% of addresses being in profit. This perhaps paints a somewhat dire path ahead should similar levels be reached this cycle.
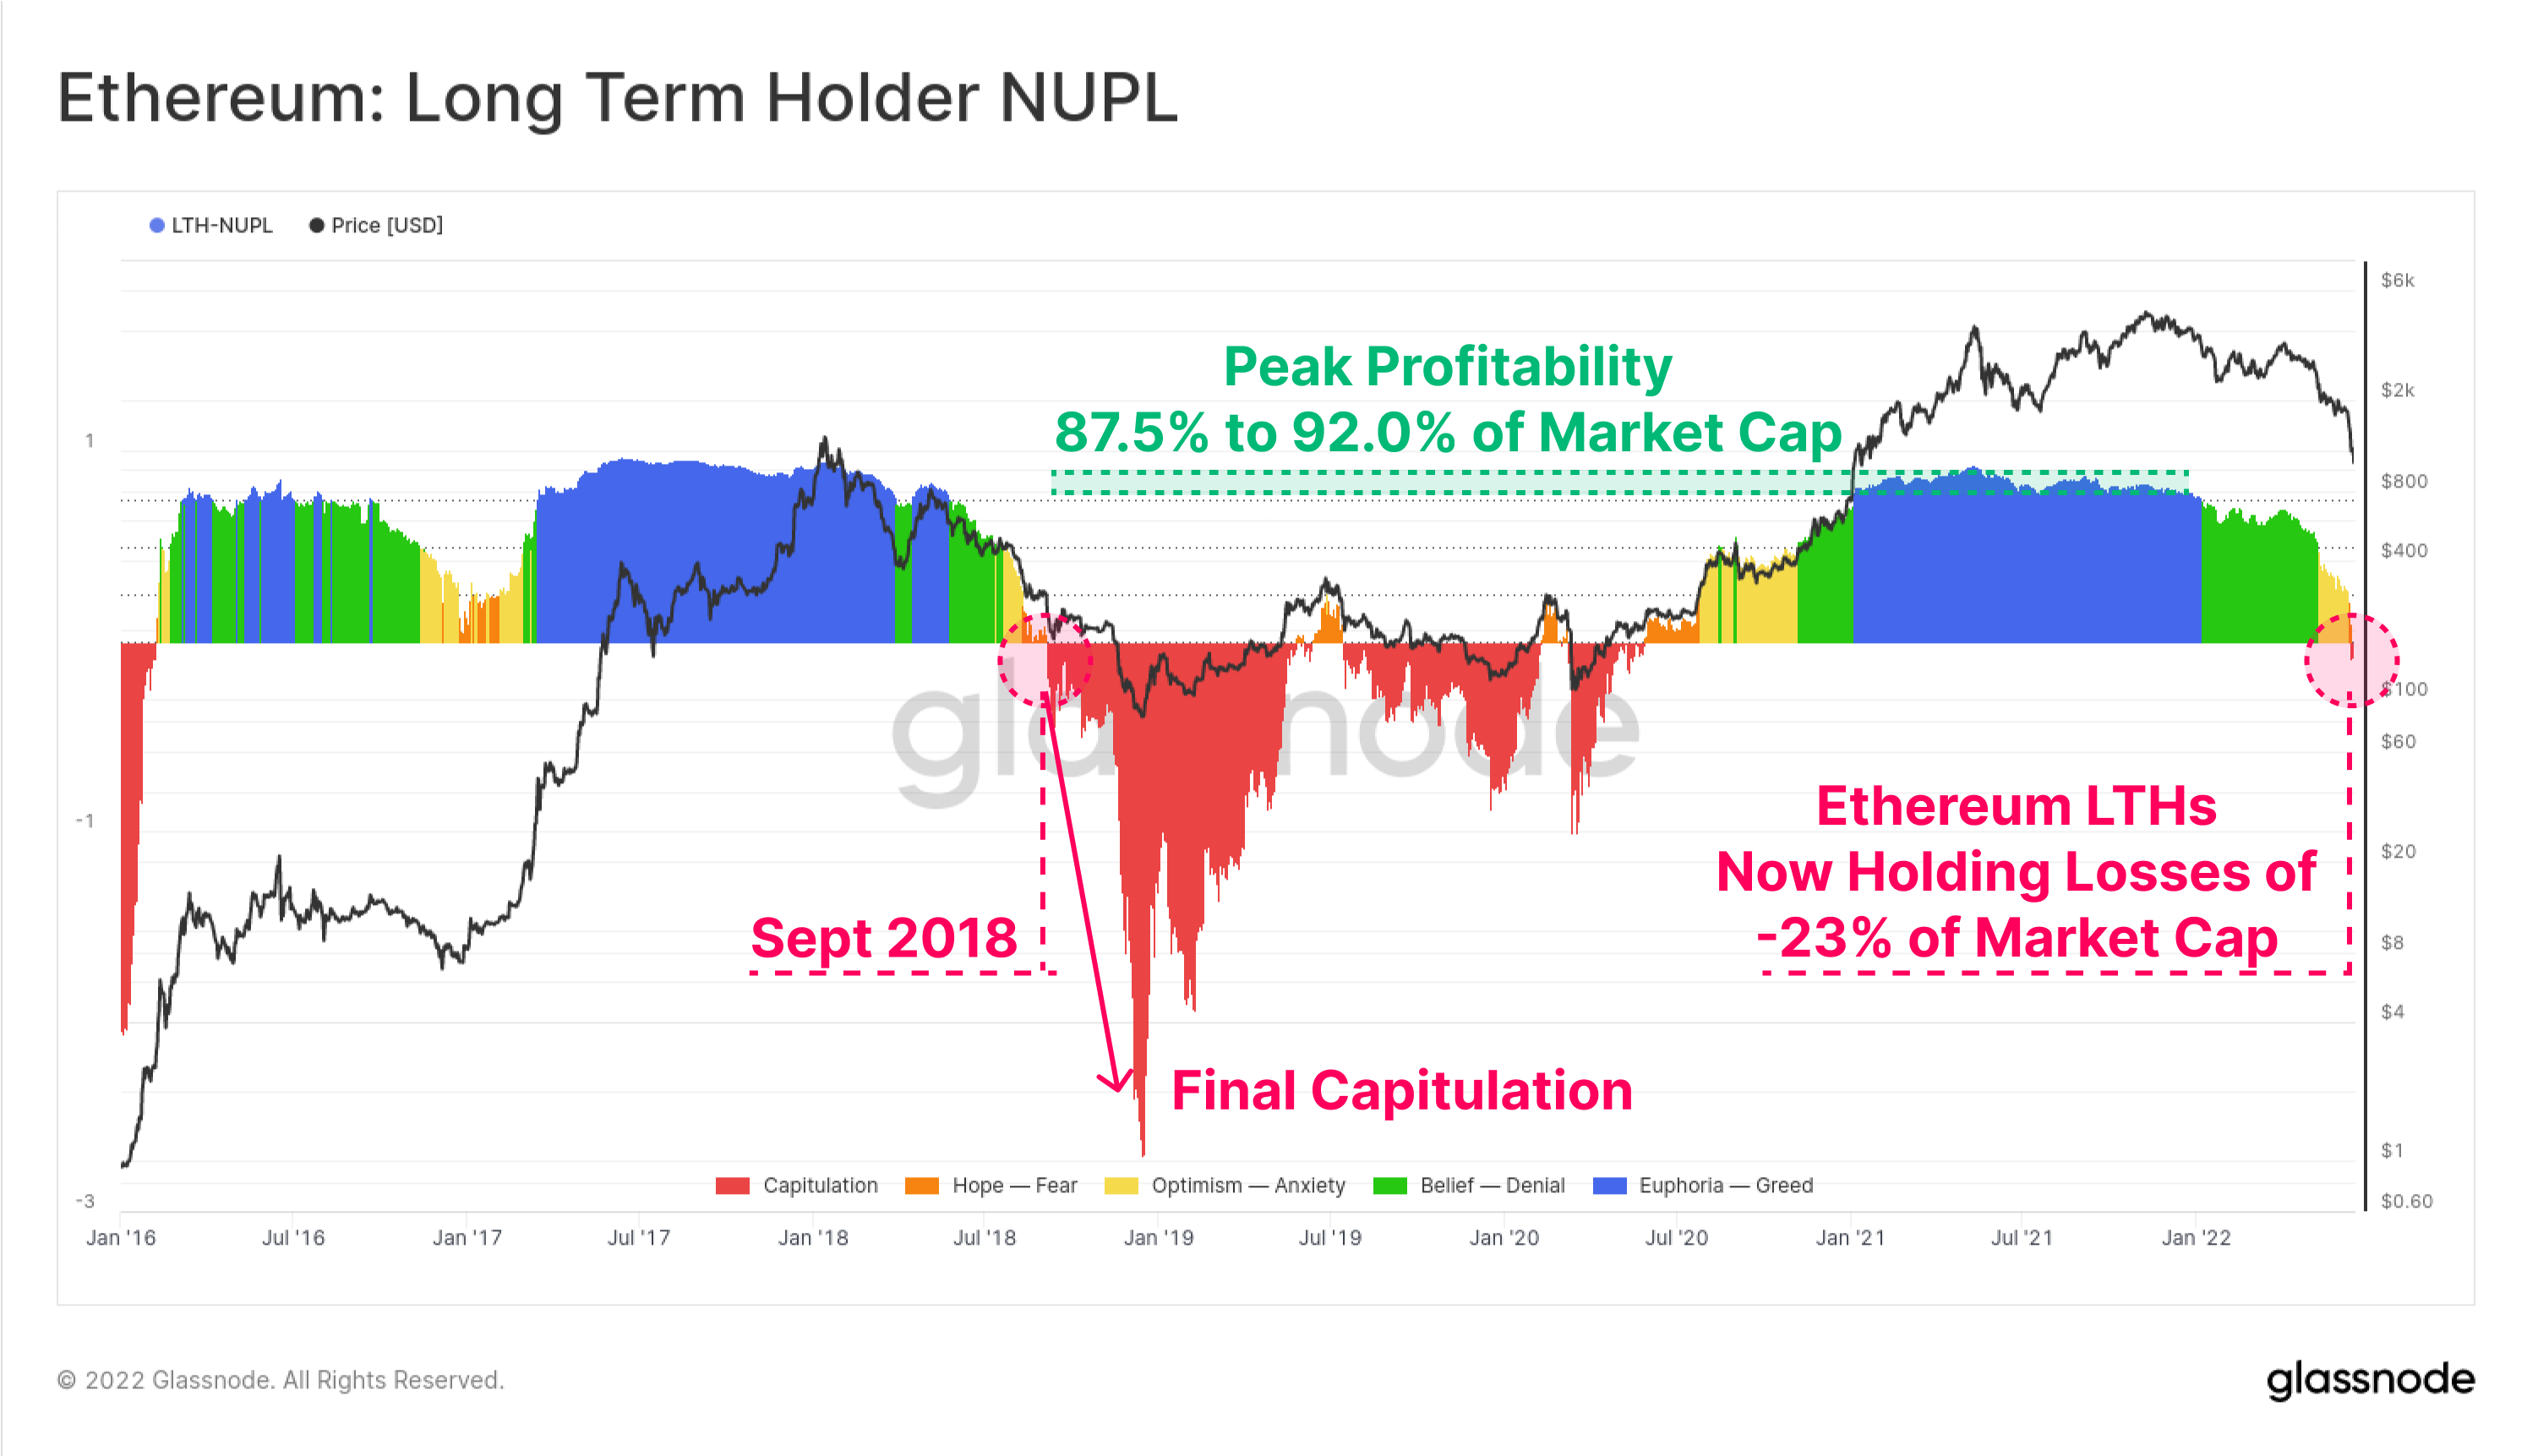
We can also investigate the aggregate unrealized profit and loss of Ethereum Long-Term Holders, being those who have held their coins for ~5-months, and the least likely to spend on a statistical basis.
The Long-Term Holder Net Unrealized Profit/Loss (LTH-NUPL) metric shows the current profitability of this cohort has declined past break-even, to now hold unrealized losses equal to 23% of the Market Cap. This means that even the strongest, and longest duration ETH investors are now underwater on their positions, on average. The last instance of this was Sept 2018, which preceded an even deeper capitulation, as prices fell 64% from $230, to $84.
Locking In Losses
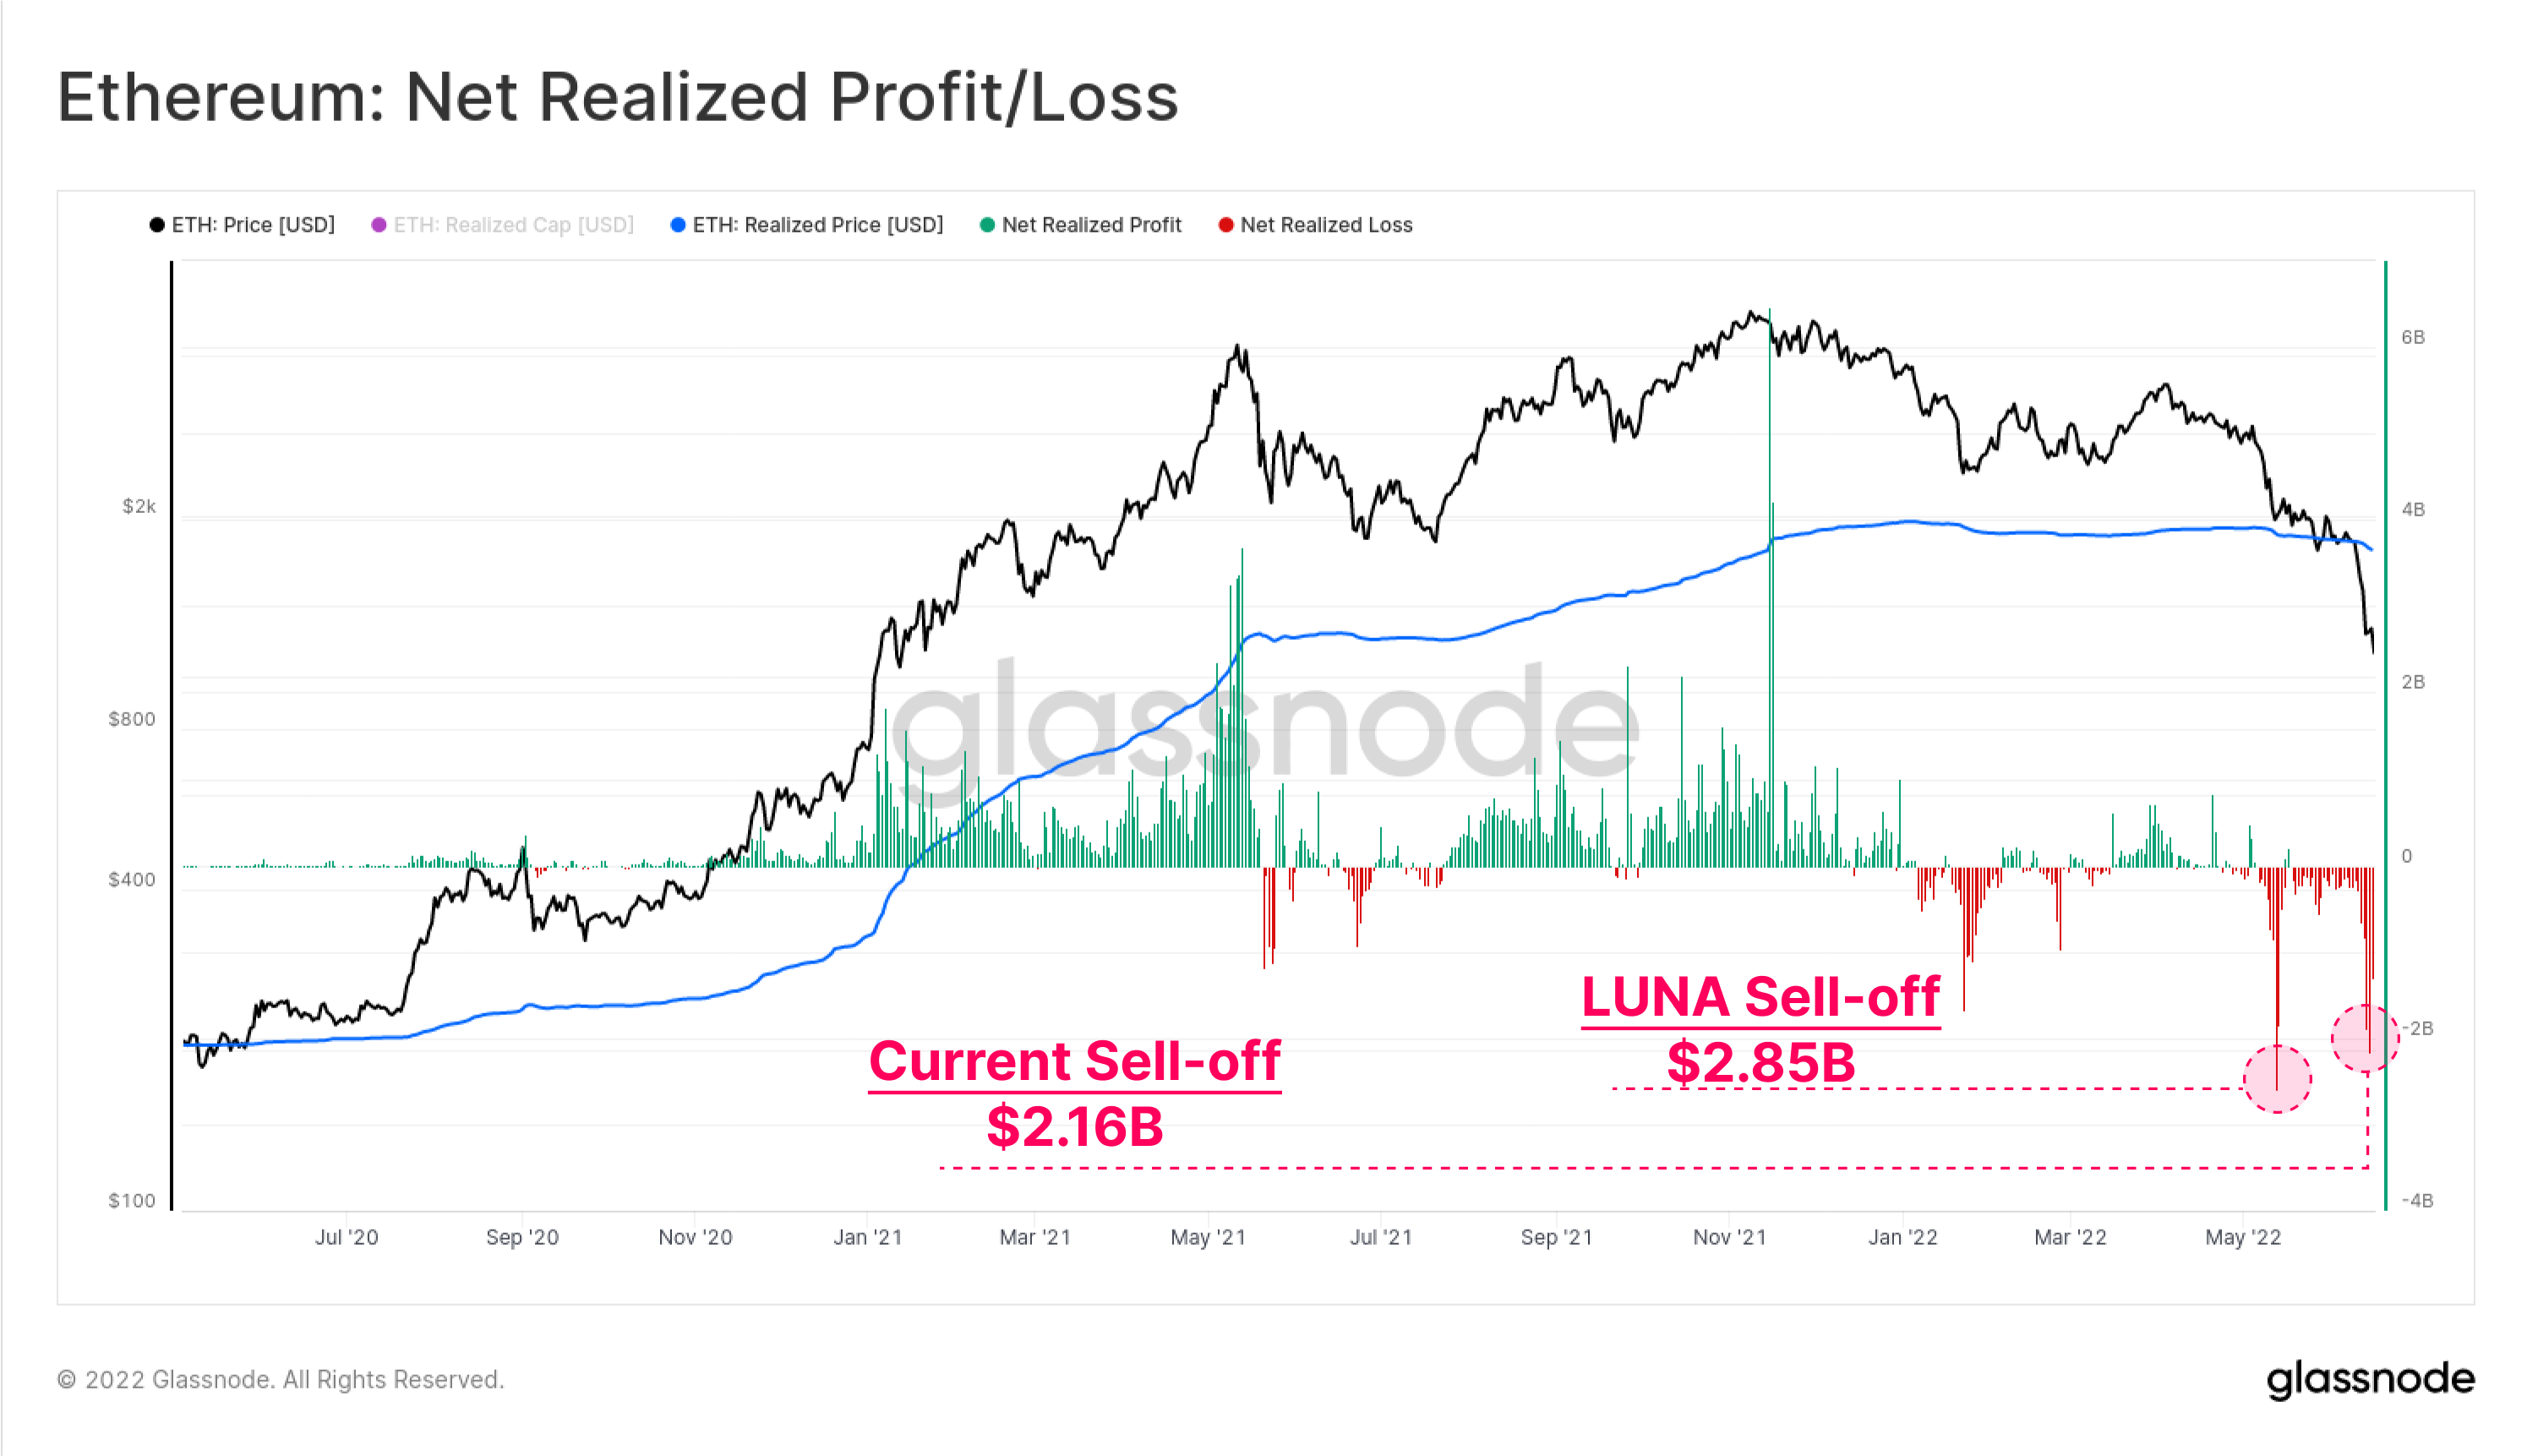
With the Ethereum holder base holding such significant unrealized losses, we can then turn to the spending behaviour to observe the magnitude of profit or loss being locked in by the actual spending taking place.
The LUNA motivated sell-off in early May remains the all-time-high of net realized loss for Etheruem investors, with $2.85B in capital outflows in one day. The current deleveraging comes in close second, hitting $2.16B in losses on 14-June.
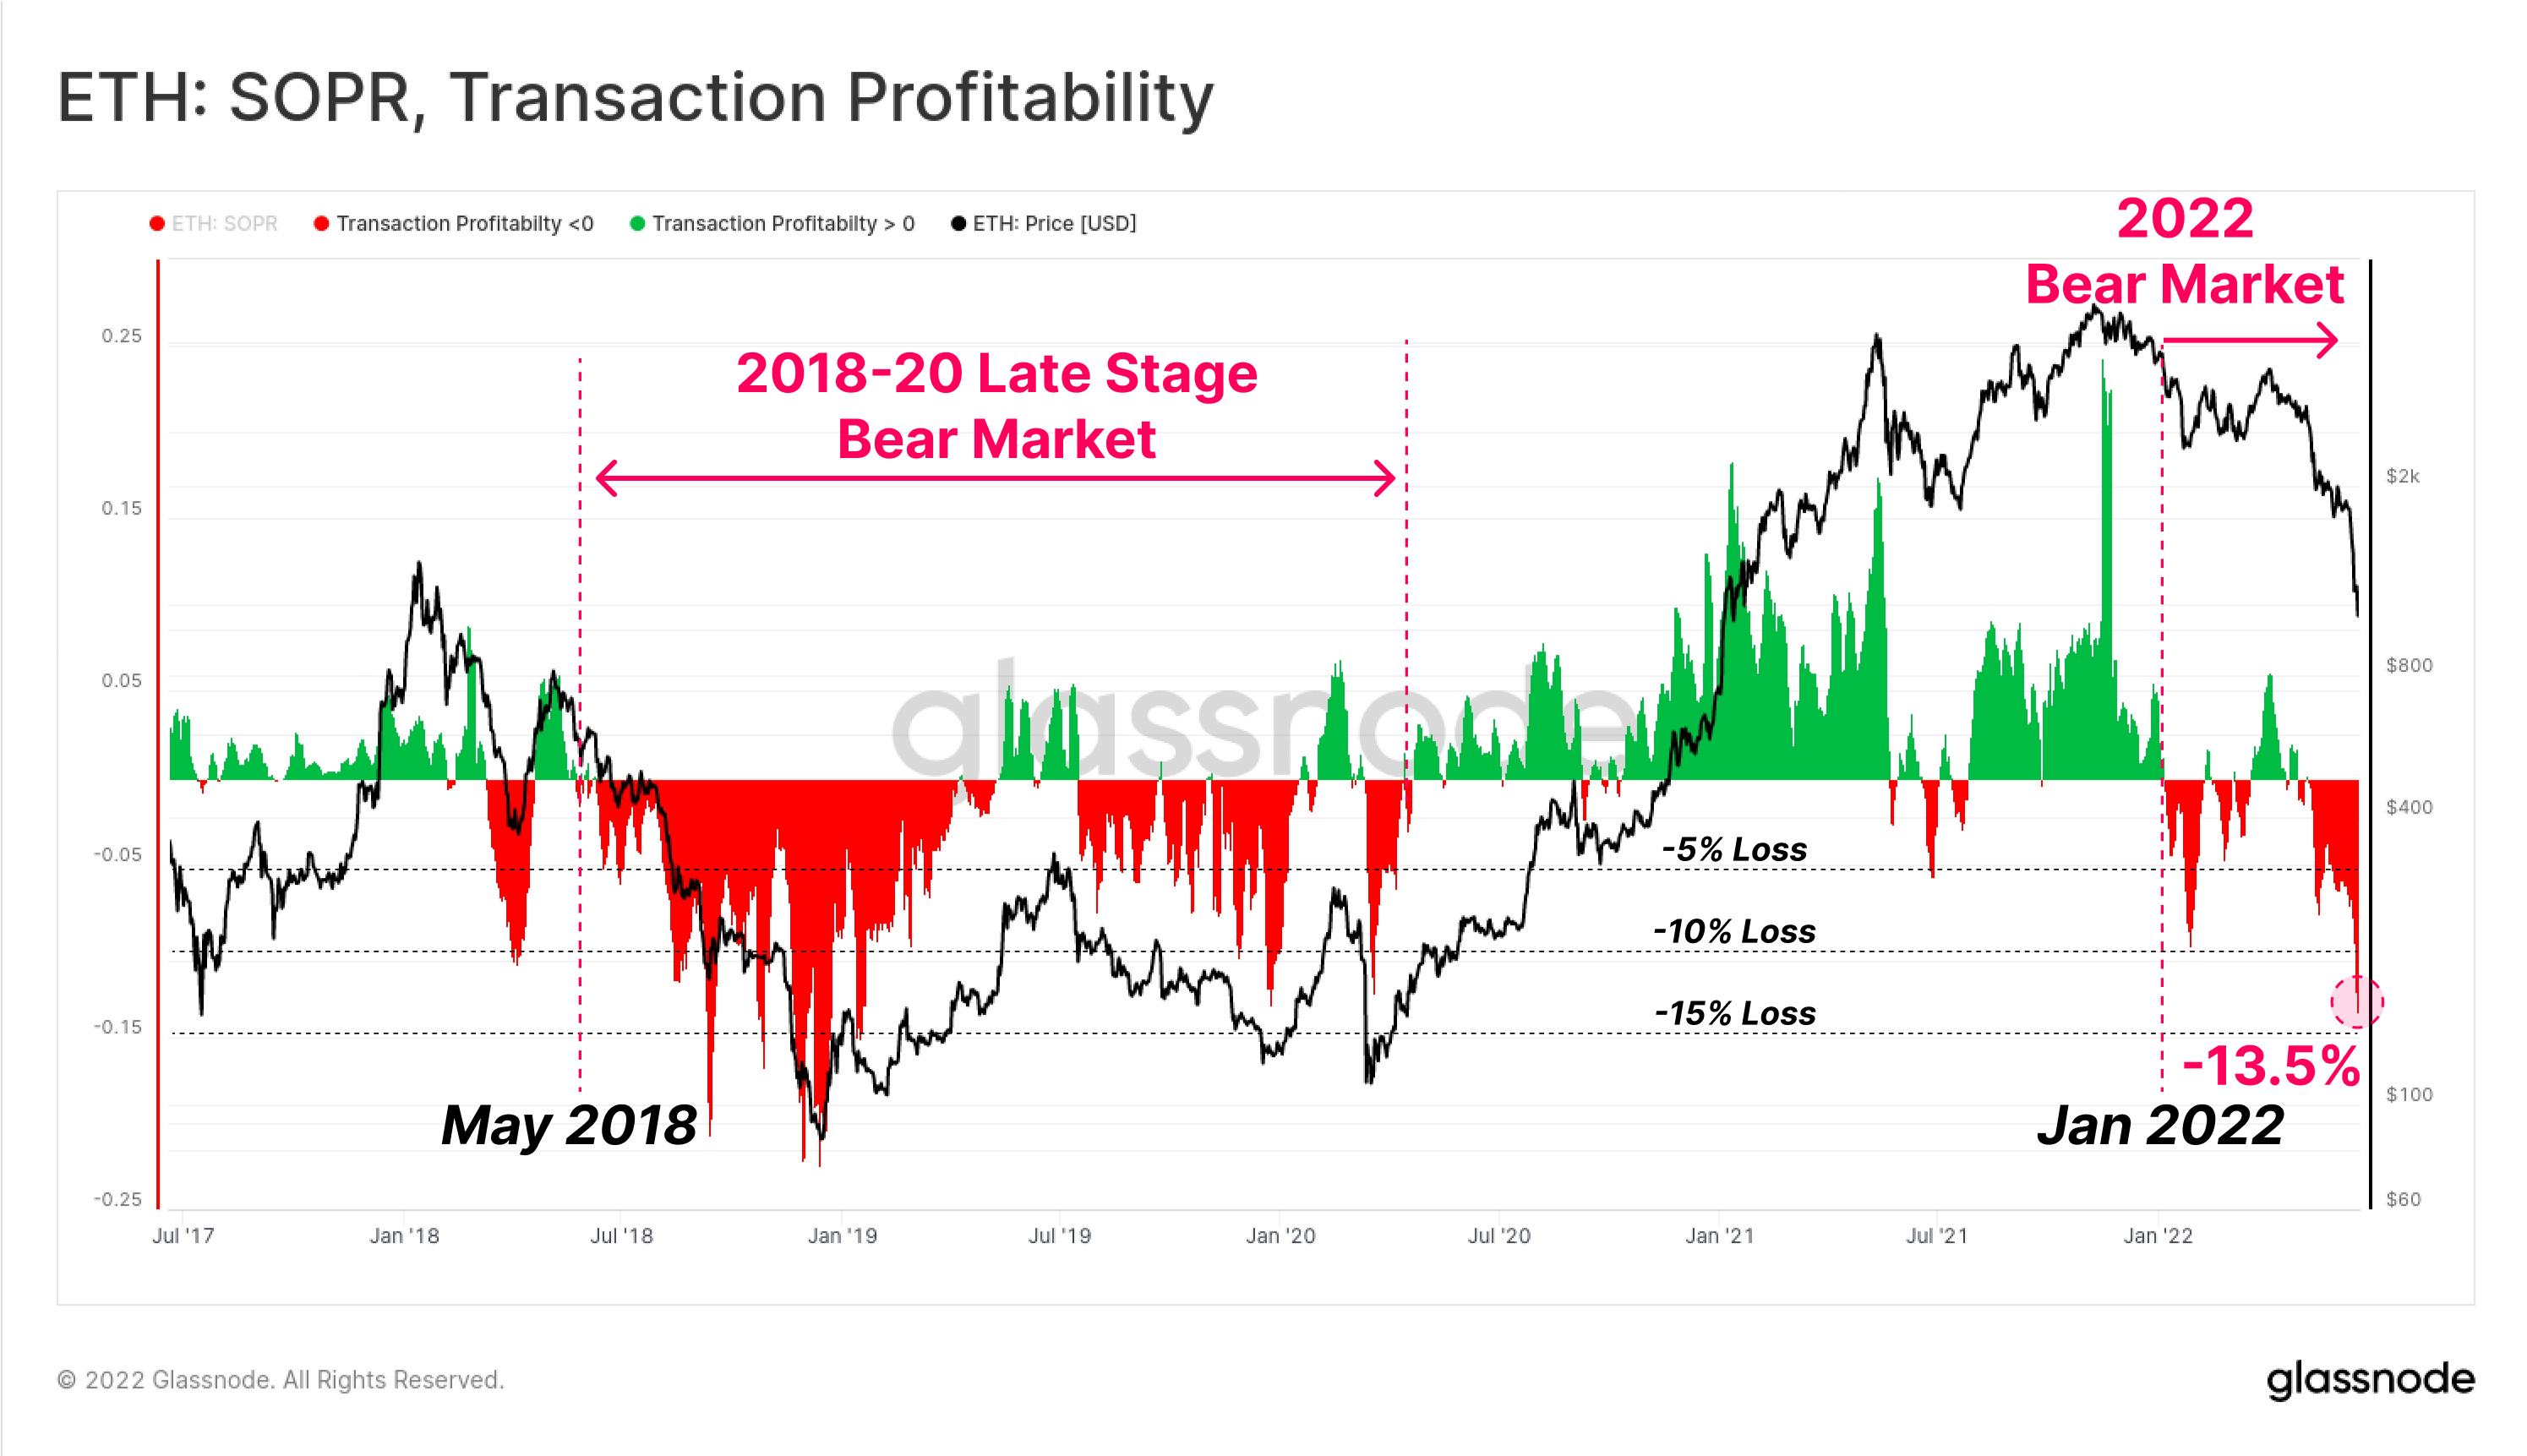
Finally, we can look to the relative Ethereum on-chain Transactional profitability metric (SOPR), looking at regimes where profit or loss is being realized by the aggregate market.
This also confirms that the Ethereum market likely confirmed transition into the bear market in Jan 2022 when relative losses started to dominate spending behaviour. Similar behaviour can be seen in May 2018 which preceded a deep bear market which took almost 2-years to recover from, culminating in the March 2020 sell-off.
Current transactional profitability indicates that the average ETH transaction is locking in a -13.5% loss on average. Whist significant, and at a scale coincident with past Ethereum bear markets, this remains low relative to -20% to -22% losses realized at the capitulation lows of the 2018 bear cycle.
Summary and Conclusions
The 2020-21 bull market in digital assets saw a significant volume of innovation and new products launched across the DeFi space, with Ethereum continuing to lead as the dominant base platform. However, along with innovation and adoption, came an accumulation of leverage, margin debt, and excessive speculation.
With market valuations collapsing through 2022, the value of crypto-collateral has declined dramatically, creating an unsustainable divergence relative to borrowed USD stablecoin capital. The result has been a historically large deleveraging of the DeFi space, with Total Value Locked falling by -$124B in just six weeks (60%).
The Ethereum holder-base is now firmly underwater, with heavy unrealized losses on HODLed coins, and historically large losses being locked in over recent weeks. This signals a high degree of financial pain exists in the investor-base, and whilst dire, it still has not yet reached the extreme lows of profitability and price drawdown seen in the 2018 bear cycle.
Overall, the deleveraging event that is underway is observably painful, and is akin to a form of mini-financial crisis. However, with this pain comes the opportunity to flush excessive out leverage, and allow for a healthier rebuild on the other side.
New Product Launch: Tutorial Dashboards
We are pleased to release four new pre-set dashboards, video guides, and Written notes designed help Glassnode users explore and up-skill in on-chain concepts, starting with Bitcoin.
- Tutorial 1 - Navigating Market Tops and Bottoms
- Tutorial 2 - Introduction to On-chain Activity
- Tutorial 3 - Fundamentals of Bitcoin Mining
- Tutorial 4 - Introduction to Supply Dynamics

- Follow us and reach out on Twitter
- Join our Telegram channel
- Visit Glassnode Forum for long-form discussions and analysis.
- For on–chain metrics and activity graphs, visit Glassnode Studio
- For automated alerts on core on–chain metrics and activity on exchanges, visit our Glassnode Alerts Twitter