Unstable Coins

The Bitcoin market experienced a week for the history books, with the $40B LUNA/UST project hyper-inflating and collapsing, 80k BTC sold by LFG, the Tether $1 peg coming under pressure, Stablecoin supplies contracting by $7.5B, and a near visit to the Realized Price

Unstable Coins

The cryptocurrency markets experienced a week of historic volatility and chaos, with the exchange rate for two stablecoins, UST and USDT taking centre stage. Over the course of just a few days, two top 10 digital assets by market cap (LUNA and UST) erased nearly $40 Billion in investor value. UST lost its $1 peg completely, and LUNA collapsed to a price of $0.00001 as its supply hyper-inflated. As a result, the Luna Foundation Guard (LFG) deployed their only recently established reserves of 80,394 BTC to defend the peg, although without success.

Later in the week, and on the momentum of UST de-pegging news, the market temporarily expressed fear over the quality of Tether's peg (USDT). USDT traded briefly down to a low of $0.9565, however recovered within 24hrs, currently trading at a very slight discount of $0.998.

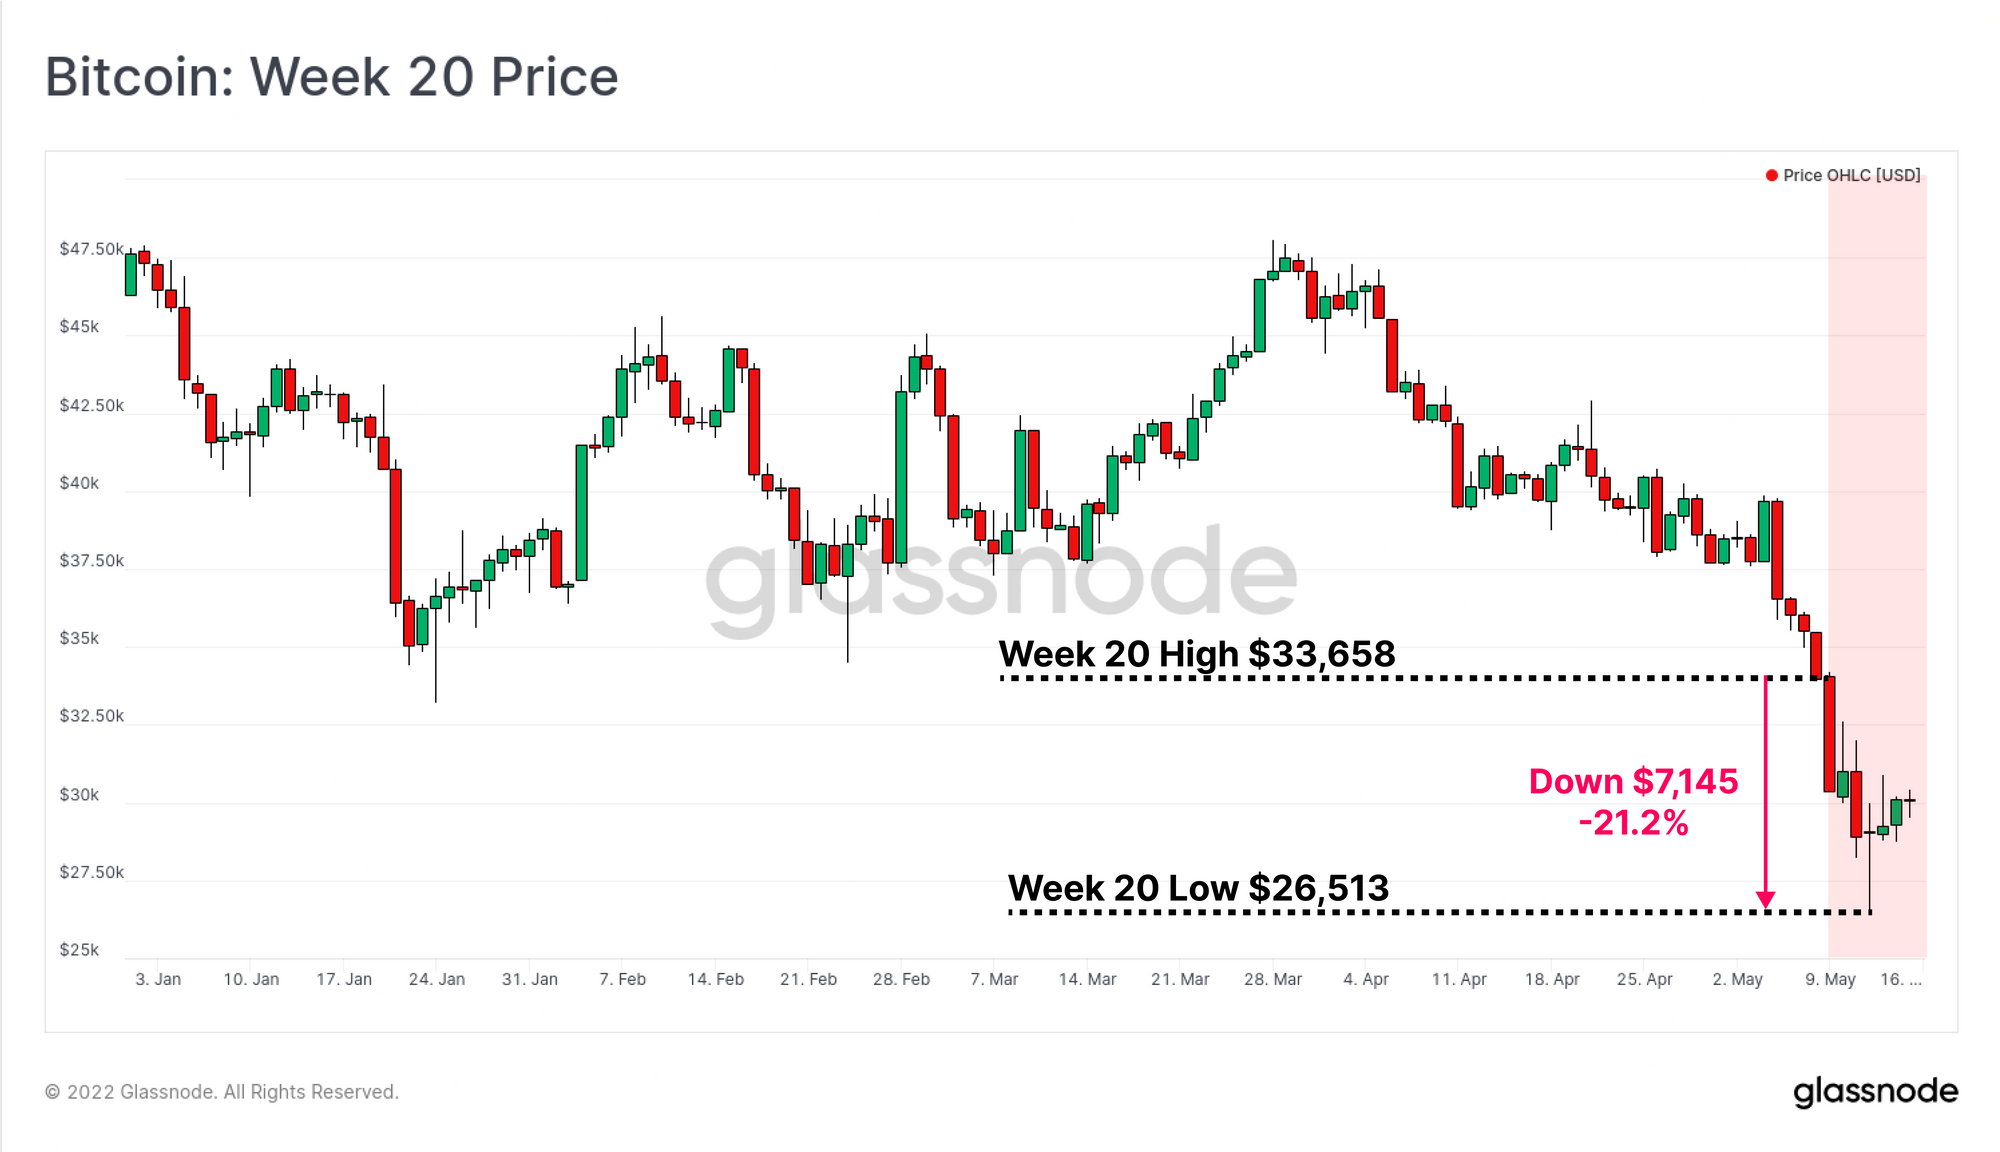
Amidst the stablecoin contagion, and under the weight of $3.275 Billion worth of Bitcoin sold by the LFG, Bitcoin traded down 21.2% to $26,513. This is the lowest price since December 2020 and naturally puts much of the market under financial stress.

In this weeks newsletter we will cover these three key topics, namely:

  • The UST and LUNA market dynamics, what happened to LUNA and UST supplies, and how the LFG Bitcoin reserves were deployed.
  • The brief de-pegging of USDT, and how it affected the market perception of other stablecoins such as USDC, BUSD and DAI.
  • Bitcoin prices traded down towards the Realized Price, which is historically a significant support level, and the markets observable reaction to this event.

Translations

This Week On-chain is now being translated into Spanish, Italian, Chinese, Japanese, Turkish, French, Portuguese, Farsi, Polish, and Greek.

The Week Onchain Dashboard

The Week Onchain Newsletter has a live dashboard with all featured charts available here. This dashboard and all covered metrics are explored further on our Video Report which is released on Tuesdays each week. Visit and subscribe to our Youtube Channel, and visit our Video Portal for more video content and metric tutorials.


The Spectacular and Reflexive Fall of LUNA

Over the past few years, the market has seen stablecoins rise to represent a sizeable portion of the total market cap of all digital assets. On the 8-May, stablecoins captured more than $135 Billion in value between USDT, USDC, BUSD, DAI, and UST.

Stablecoins come in a number of flavours, but can generally be represented in three types:

  • Collatoralised (USDT, USDC, BUSD)
  • Crypto-over-collateralised (DAI)
  • Algorithmic (UST).

In the case of UST and LUNA, the algorithmic design allowed for users to convert 1 UST into $1 worth of LUNA (and vice-versa), irrespective of the market price of both assets. In effect, this means that the LUNA supply contracts (and price often rises) when there is demand for UST. However, this same reflexivity works in reverse, when demand falls, and prices move to the downside, the supply of LUNA can (and did) hyper-inflate.

The UST peg began to break in the 9-May, where LUNA was trading around $60 (~49.5% off the $119 ATH). Over the next 36-hours, LUNA prices fell below $0.1, and the UST peg traded between extremes of $0.30 and $0.82. This put the protocol redemption mechanism into overdrive, as users both panicked, and arbitraged the exchange of 1 UST for $1 worth of LUNA, inflating the supply and depressing prices further.

At the time of writing, LUNA is now trading for $0.0002 (down 99.9998% from ATH), and UST is stabilising around $0.1251, well below the desired $1 peg.

The magnitude of LUNA supply inflation can be seen the chart below, where UST supply (green, RHS) is in linear scale, whilst LUNA supply (red, LHS) is in log scale. Over the course of one week, 7.5 Billion UST were redeemed (40% of supply), whilst the LUNA supply inflated from 343 Million, to over 6.53 Trillion, an annualised inflation rate of 99,263,840%.

At one stage on 13-May, the LUNA blockchain was even halted as a result of second order effects on network stability and governance due to the hyper-inflating supply.

As the UST peg traded lower, the Luna Foundation Guard began to deploy their recently acquired Bitcoin reserves in an effort to stabilise the peg. Their total reserves had built up to 80,394 BTC over recent months, with the largest acquisitions occurring between 21 March and 5 May. The total realized value of their holdings, with coins valued at the time they were added to the wallet, was $3.275 Billion.

These wallets were completely emptied over a 21.5 hour window between the 9th and 10th of May.

Live Workbench Chart

The LFG Bitcoin balance was emptied in three tranches as shown below. The first tranche deployed around $750M in value (22,189 BTC) at 3:30 on 9-May as the UST peg traded down to $0.98. The second tranche of 30,000 BTC ($916M) was deployed 15-hours later, and the final tranche of 28,205 BTC ($873M) was emptied from the wallet 6.5hrs later.

A series of equivalently sized exchange inflows (shown in blue) occurred between 18:30 on 9-May and 01:10 on 10-May as coins were moved between custodians by the market makers engaged by LFG. By our assessment, the initial destination of these coins were:

  • 52,189 BTC sent to to Gemini via OTC desks (which were quickly deployed elsewhere, including to Binance)
  • 28,205 BTC sent to Binance via direct transfer
Live Workbench Chart

The LFG has since confirmed that almost all of the Bitcoin was sold, and as of 16-May, they have just 313 BTC remaining in inventory.

Aggregate exchange balances increased by around 88k BTC over this period, which is higher than the 80,394 deployed by the LFG. This signals that these events triggered a contagion effect and panic, as Bitcoin investors added to the sell-side pressure. A large outflow occurred from Coinbase on 14-May, although it does not appear that Coinbase was a recipient venue of LFG sourced coins.

Live Chart

Unstable Coin Contagion

As if the week had not already experienced enough chaos, on 11-May, Tether (USDT) which is the largest stablecoin by market cap saw its peg come under pressure. Whilst UST was significant in size ($21B), many consider USDT at $83B in size to be systemically important to the market in its current form, being the dominant quote pair on many exchanges.

Over the period from midday 11-May to midday 12-May, USDT traded below its $1 peg to a low of $0.9565, before recovering within 36hrs to trade at a slight discount of $0.998. During this time, other major stablecoins USDC, BUSD and DAI experienced at a 1% to 2% premium as investors moved towards assets they perceived were less at risk of contagion.

Live Workbench Chart

Tether announced on 12-May during the worst of the peg stress that redemptions remained open and active, and that $2B worth were already underway.

If we look to the supply of USDT, we can see that indeed, over $7.485 Billion worth of USDT has been redeemed with week. The total USDT supply declined from near the $81.237B ATH to $75.75B. As we noted in last weeks report, the recent stablecoin supply contraction of $2.9B was the largest in history, mostly driven by USDC. As such, an outflow of this scale has now put this week into the pole position by this metric.

Live Chart

We also saw interesting supply changes across the other major stablecoin supplies this week, providing insight on market preference during times of stress. USDC reversed the trend of supply contraction that has been in place since late Feb, expanding by $2.639B. Given the dominant growth of USDC over the last 2yrs, this may be an indicator of changing market preference away from USDT and towards USDC as the preferred stablecoin.

Live Chart

The other stablecoin that saw a dramatic change in supply was DAI, which saw supply fall by 24.4%, as $2.067 Billion was burned. DAI is an over-collateralised stablecoin, backed by other digital assets deposited in the Maker protocol. The DAI supply will contract when debt holders close out their position by repaying and burning DAI.

This process can be discretionary, or forced in the event of a vault liquidation. However, despite the high volatility in collateral assets, elevated demand for DAI, and liquidation events, DAI managed to maintain a strong $1 peg, albeit trading at a very slight premium.

Live Chart

Heavy Losses Realized On-chain

As the LUNA saga unfolded, the coins acquired by LFG were spent on-chain at prices much lower than when they were purchased. With the USDT peg also coming under pressure, prices broke below the $29k support level set in July 2021. This actually put all investors from the 2021-22 cycle into a loss, and precipitated a significant and widespread net loss.

Net losses realized by all on-chain spending hit over $2.5Billion for two consecutive days, which is on par with the largest capitulation events in history (the largest if considered in aggregate).

LFG alone contributed a realized loss of $703.7M to the total aggregate. Note, this reflects losses between when the coins entered, and left the LFG wallet, and does not account for the additional losses that were taken as the BTC was traded for UST and hyper-inflating LUNA.

Live Chart

As the Bitcoin market grows in size, naturally the USD denominated losses can and will be larger over time. Thus, we can establish a 'relative realized loss' metric by dividing daily realized loss across the network by the Realized Cap to compare apples between cycles.

Here we can see that the LUNA capitulation still precipitated one of the largest loss events in the last 5 years, triggering aggregate losses equivalent to 0.28% of the Realized cap. This is comparable to:

  • The start and end sell-off events of the 2018 bear market
  • The March 2020 COVID crash
  • The May 2021 sell-off, which interestingly is celebrating its 1yr anniversary this week.
Live Workbench Chart

Realized Price Within Reach

The Realized Price is one of the oldest, and most fundamental metric concepts in on-chain analysis. It is calculated by dividing the Realized Cap, which is the sum of all coin values at the time when they were last moved, by the circulating supply. Thus it reflects an estimate of the aggregate cost basis of all coins in the supply.

Historically, the Realized Price has provided sound support during bear markets, and has provided signals of market bottom formation when the market price trades below it. The table below shows the previous bear market cycles, and the proportion of time where prices traded below the realized price.

It can be seen that over time, each bear cycle has spent less relative duration below the realized price. This may be in part a result of general market awareness of its existence (it was first discovered in 2018). March 2020 remains the most notable deviation, with just 7-days spent below the realized price, rather than months as seen in prior cycles.

As the market hit the weekly price low of $26,513, the Realized Price was trading at $24k. As the market collapsed under the weight of LFGs BTC sales, the destruction of value held in LUNA and UST, and the depeg fear of Tether, spot prices fell within 9.5% of the Realized Price.

As a result of the aggregate realized losses described above, the Realized Cap declined by $7.92 Billion, representing a capital outflow from the Bitcoin network, and causing the Realized Price to decline by $60 to $23,940.

Live Chart

Despite the volatility however, the bulls in the market appeared to responded strongly as prices fell towards a the Realized Price. The chart and table below show the Accumulation Trend Score, which will return values closer to 1 when a large proportion of the market are adding to their on-chain balances.

On Thursday 12-May, when the market was at the lowest, the Accumulation Trend Score reversed from very weak values below 0.3, to return values upwards of 0.796. Supporting the Bitcoin price bounce back into the $30ks, the Score returned values above 0.9 for the remainder of the week, suggesting strong buy side activity took place.

Live Chart

This can be further confirmed looking at the various wallet cohorts that participated. What we can see is a swift reversal from weak accumulation (< 0.3, warm colours) across all cohorts in early May, to strong accumulation across most cohorts this week (> 0.7, cool colours).

Small holders (< 1BTC) were by far the largest accumulators, and were supported by whales with more than 10k BTC (which includes the LFG balance which was completely distributive). Wallet cohorts holding 100 BTC to 10k BTC remained weaker in their net accumulation.

The takeaway observation is that whilst exchange balances ticked higher, realized losses were taken at a historical scale, and LFG unloaded 80k BTC, the aggregate market still added to their balance. This offset distribution impacts that will have weighed heavily on the Accumulation Trend Score over the last week.

Unreleased metric from the Glassnode Engine Room

Summary and Conclusions

What happened this week was historic in nature, however in many ways, aligns with the characteristics of a textbook digital asset bear market. There have been various examples of large name cryptocurrency projects that turned out to be unstable, and ultimately collapse under their own weight. Such events are usually precipitated by the downwards price pressure of a bear market, as demand wanes, and experimental systems (which are often leveraged) come under stress.

As stablecoins become increasingly integrated as base layer infrastructure in the market, the shockwaves of a de-pegging event, especially in the largest stablecoin USDT will have widespread impacts. The double momentum from UST and USDT depegging, some $40B in LUNA/UST value destroyed, and with LFG adding 80k BTC sell-pressure created a perfect storm. This event will also no doubt attract the regulatory spotlight at a greater pace and urgency.

It remains to be seen if a full return to the Realized Price is required to put this bear market to rest, and if so whether it is for months, weeks, days or just a short a moment. Perhaps those days are behind us if the accumulation we observed is indicative of the support the bulls are willing to put up in the $20ks range. Note also, there remains a plethora of macro, inflationary and monetary policy forces acting as headwinds. The road ahead will likely continue to be a rocky one.


Product Updates

All product updates, improvements and manual updates to metrics and data are recorded in our changelog for your reference.


Disclaimer: This report does not provide any investment advice. All data is provided for information purposes only. No investment decision shall be based on the information provided here and you are solely responsible for your own investment decisions.