The Week On-chain (Week 22, 2021)
The Bitcoin market has become a battleground between bulls and bears, as we analyse on-chain sentiment for Long-term and Short-term holders.


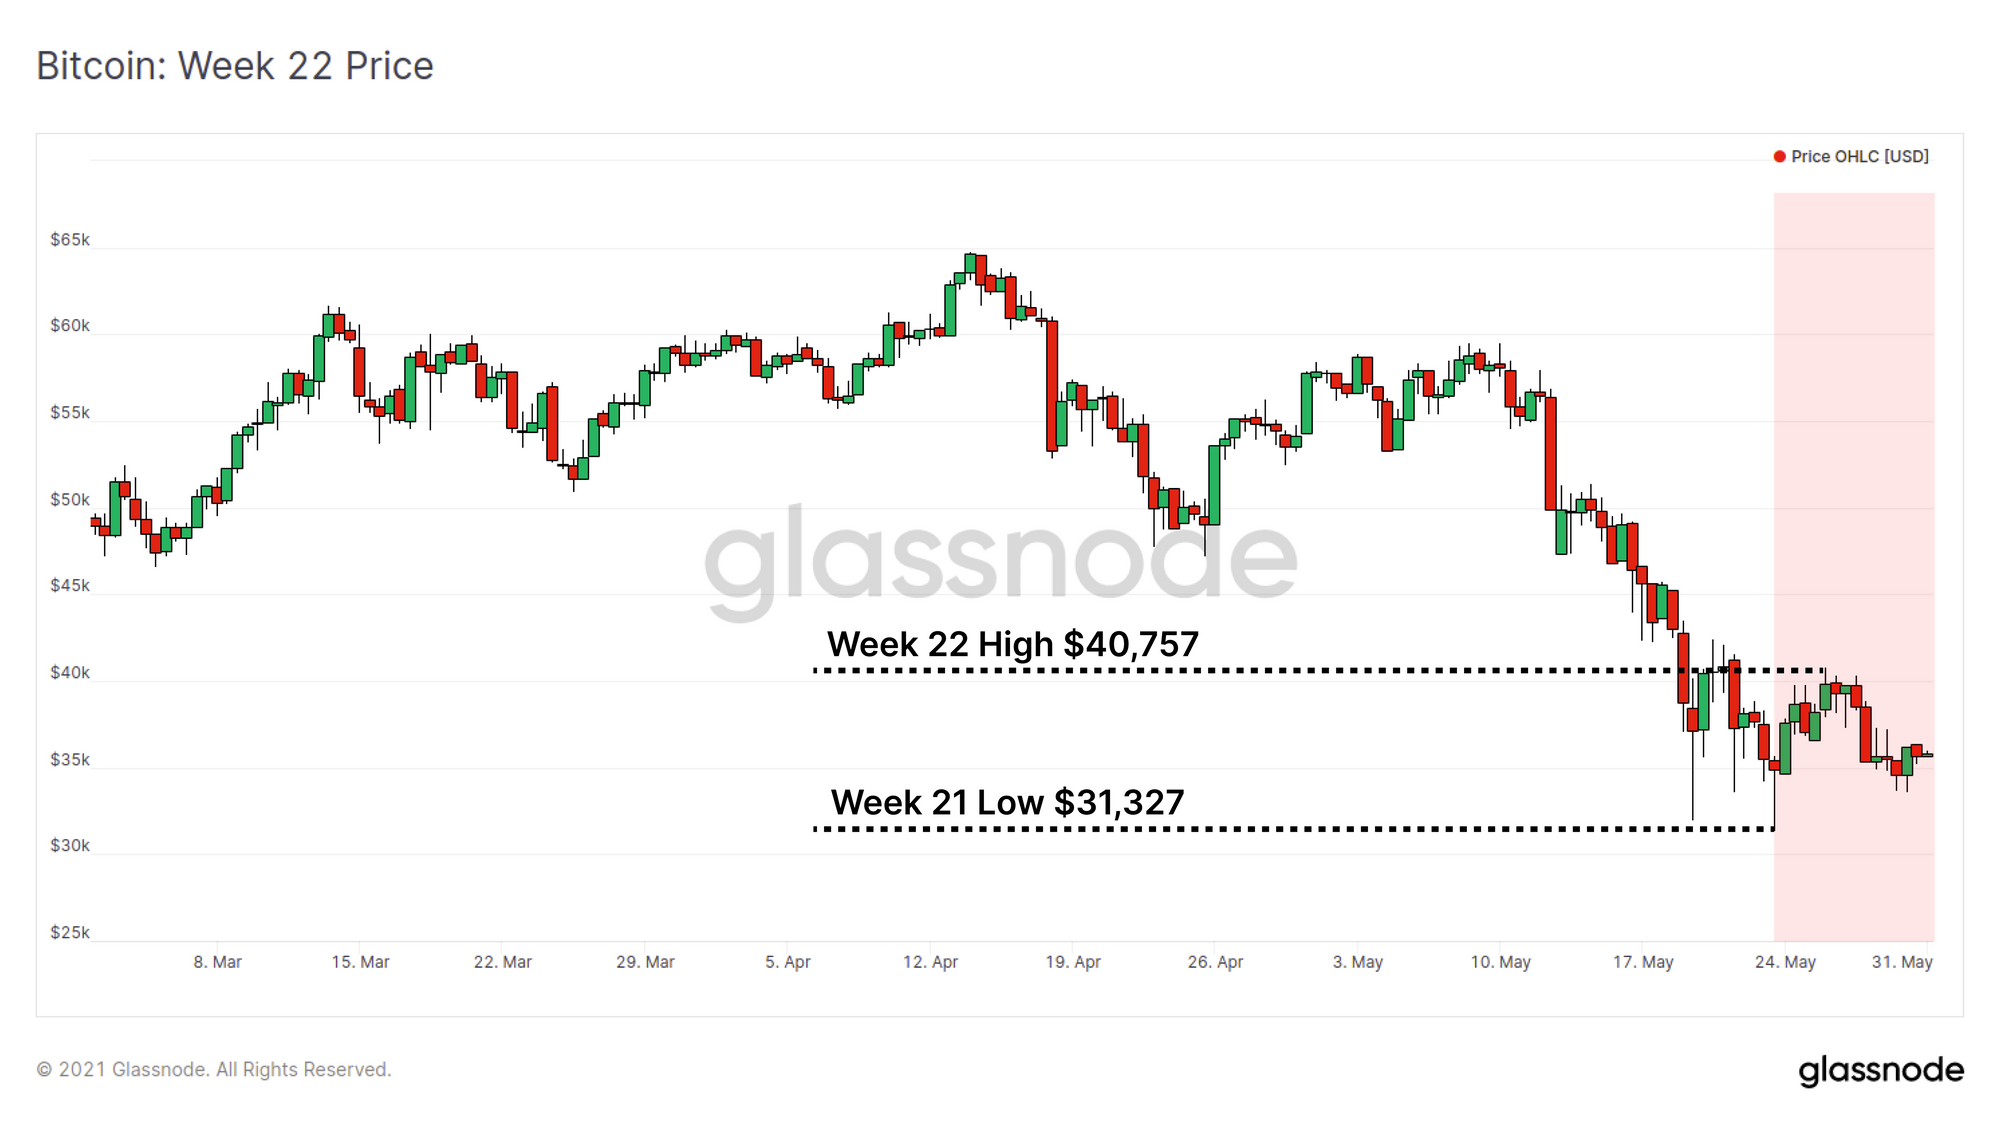
This week the Bitcoin price has consolidated within a $9,430 trading range. Price opened the week at a low of $31,327, hit a local high of $40,757, before trading back towards the lows. A period of consolidation is to be expected as the market comes to terms with the dramatic sell-off last week.
The primary question on investors minds is whether a bear market trend is in play, or whether the market has returned to a re-accumulation range. In this newsletter we will assess the on-chain spending behaviour of Short- and Long-term coin holders to gauge their relative sentiment.
Approaching the Pain Threshold
The current market structure is quite intriguing, as the Bitcoin price 5 months ago (our threshold for Long-term Holders, 155-days) is only slightly below current prices. As such, Long-Term Holders (LTHs) more or less represent all profitable coins (accumulated prior to 2021) with buyers from late December/early January at or near their cost basis. Conversely, Short-Term Holders (STHs) represent almost all coins that are at an unrealised loss.
Using statistical means, we established these two classes of coin-holders based on the time since a coin was last moved:
- Short-Term Holders (STH), generally assumed to be relatively new market entrants holding coins younger than 155-days.
- Long-Term Holders (LTH) generally assumed to be hodlers, smart money and buyers of last resort holding coins older than 155-days.
Using this classification, we establish the proportion of supply that is held by STH vs LTH and further by how many of those coins are currently in profit or at a loss. As the current trading price range is very close to the prices 155-days ago, we can also see that a small proportion of LTHs are now underwater shown in the light blue zone in the chart below.
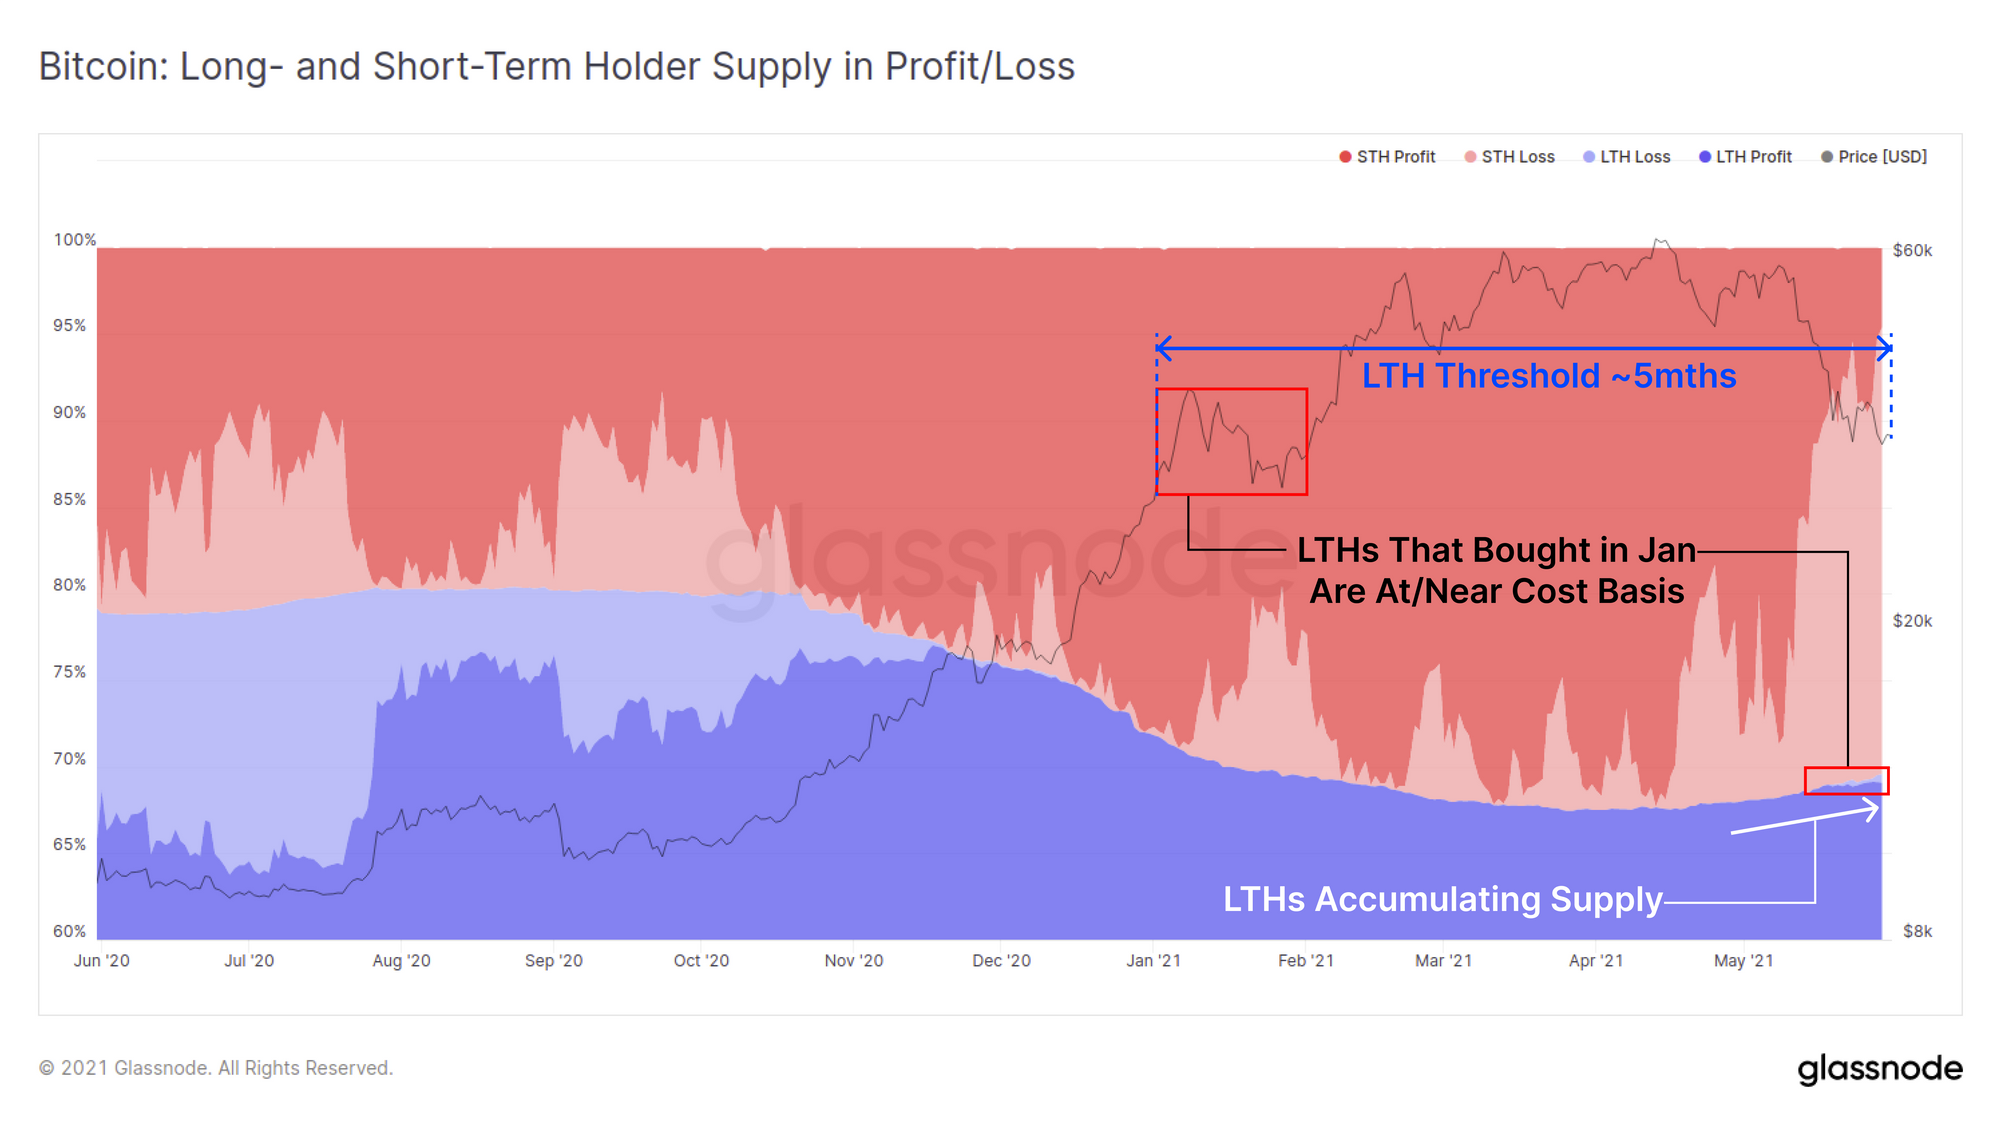
Key statistics regarding the current supply dynamics in the chart above:
- LTHs in profit (dark blue) hold 69% of all BTC supply. This essentially represents all buyers before 2021.
- LTHs in loss (light blue) hold 0.5% of all BTC supply capturing buyers from the final days of 2020 and early January. Should price continue to range in this zone for say 1-month (or fall lower), the thickness of this light blue zone will indicate how many buyers from January continue to HODL their coins.
- LTHs overall (white arrow) have returned to accumulation. This suggests that early bull market buyers (prices < $30k) have HODLed a reasonable volume of supply, and should this trend continue, may indicate a longer term supply squeeze is in play.
- STHs in profit (dark red) hold only 4.5% of BTC supply, having fallen dramatically from over 30% in mid-April at the $64k ATH. This suggests that around 26% of the coin supply is currently underwater.
- STHs at a loss (light red) therefore hold 26% of supply at an unrealised loss. This group are the most likely source of sell-side pressure now and into the future.
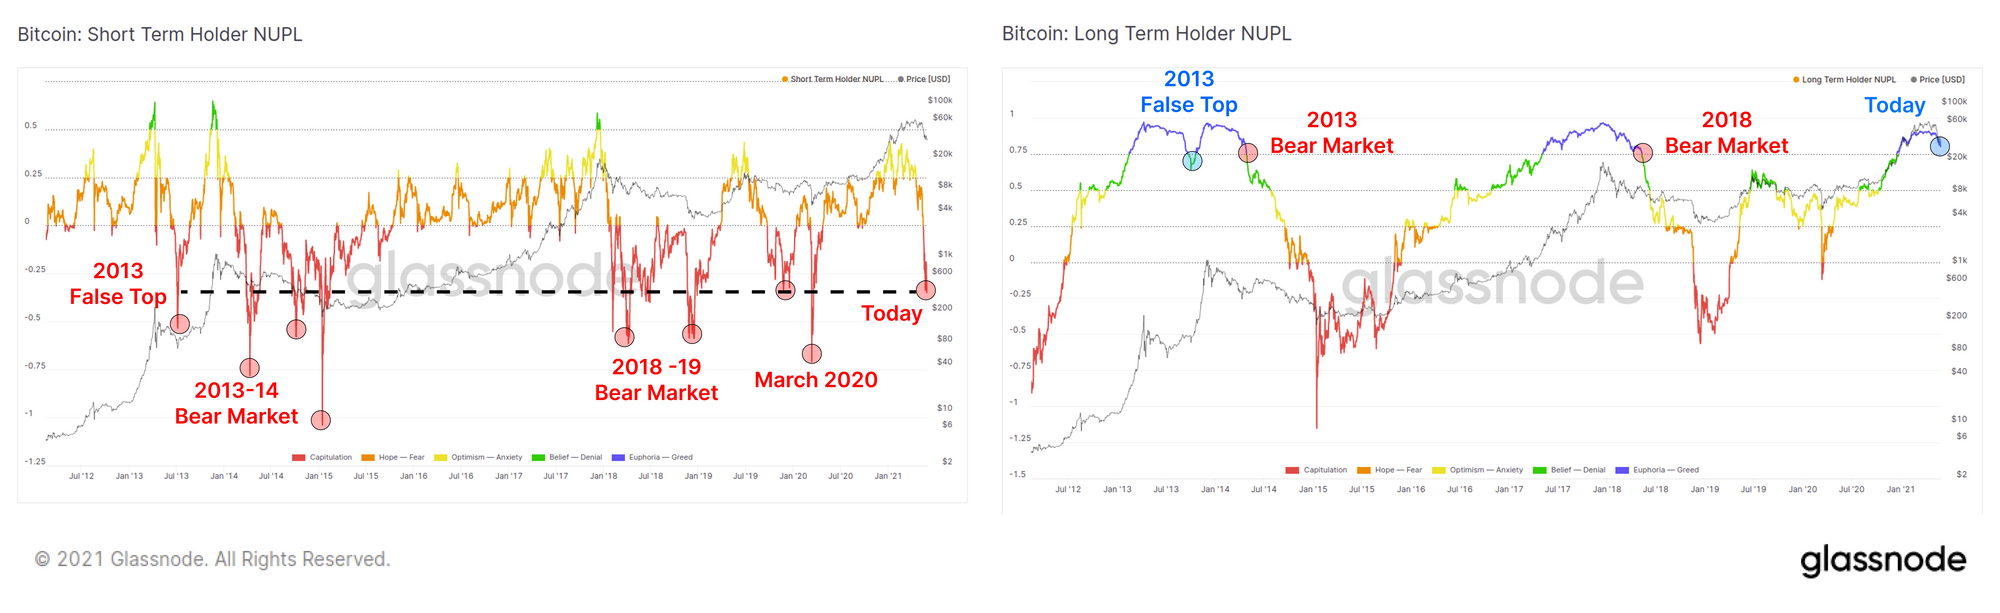
In our latest insights piece, we discuss the Net Unrealised Profit and Loss for both groups to establish their relative pain points. Our assessment is that STHs have capitulated a large volume of coins, however may continue to be a source of sell-side supply moving forwards. LTHs on the other hand remain largely in profit, however are approaching the NUPL threshold of 0.75. In previous cycles, this has signalled the start of more bearish trends as LTHs capture remaining unrealised gains.
Spending Patterns Matter
From the above, we can see plenty of Bitcoin investors are underwater and things may seem pretty grim.
However, now that we have established potential pain points for the market, we can observe actual spending behaviours on-chain to verify whether investors are taking action on paper losses, or are being spooked by red candles.
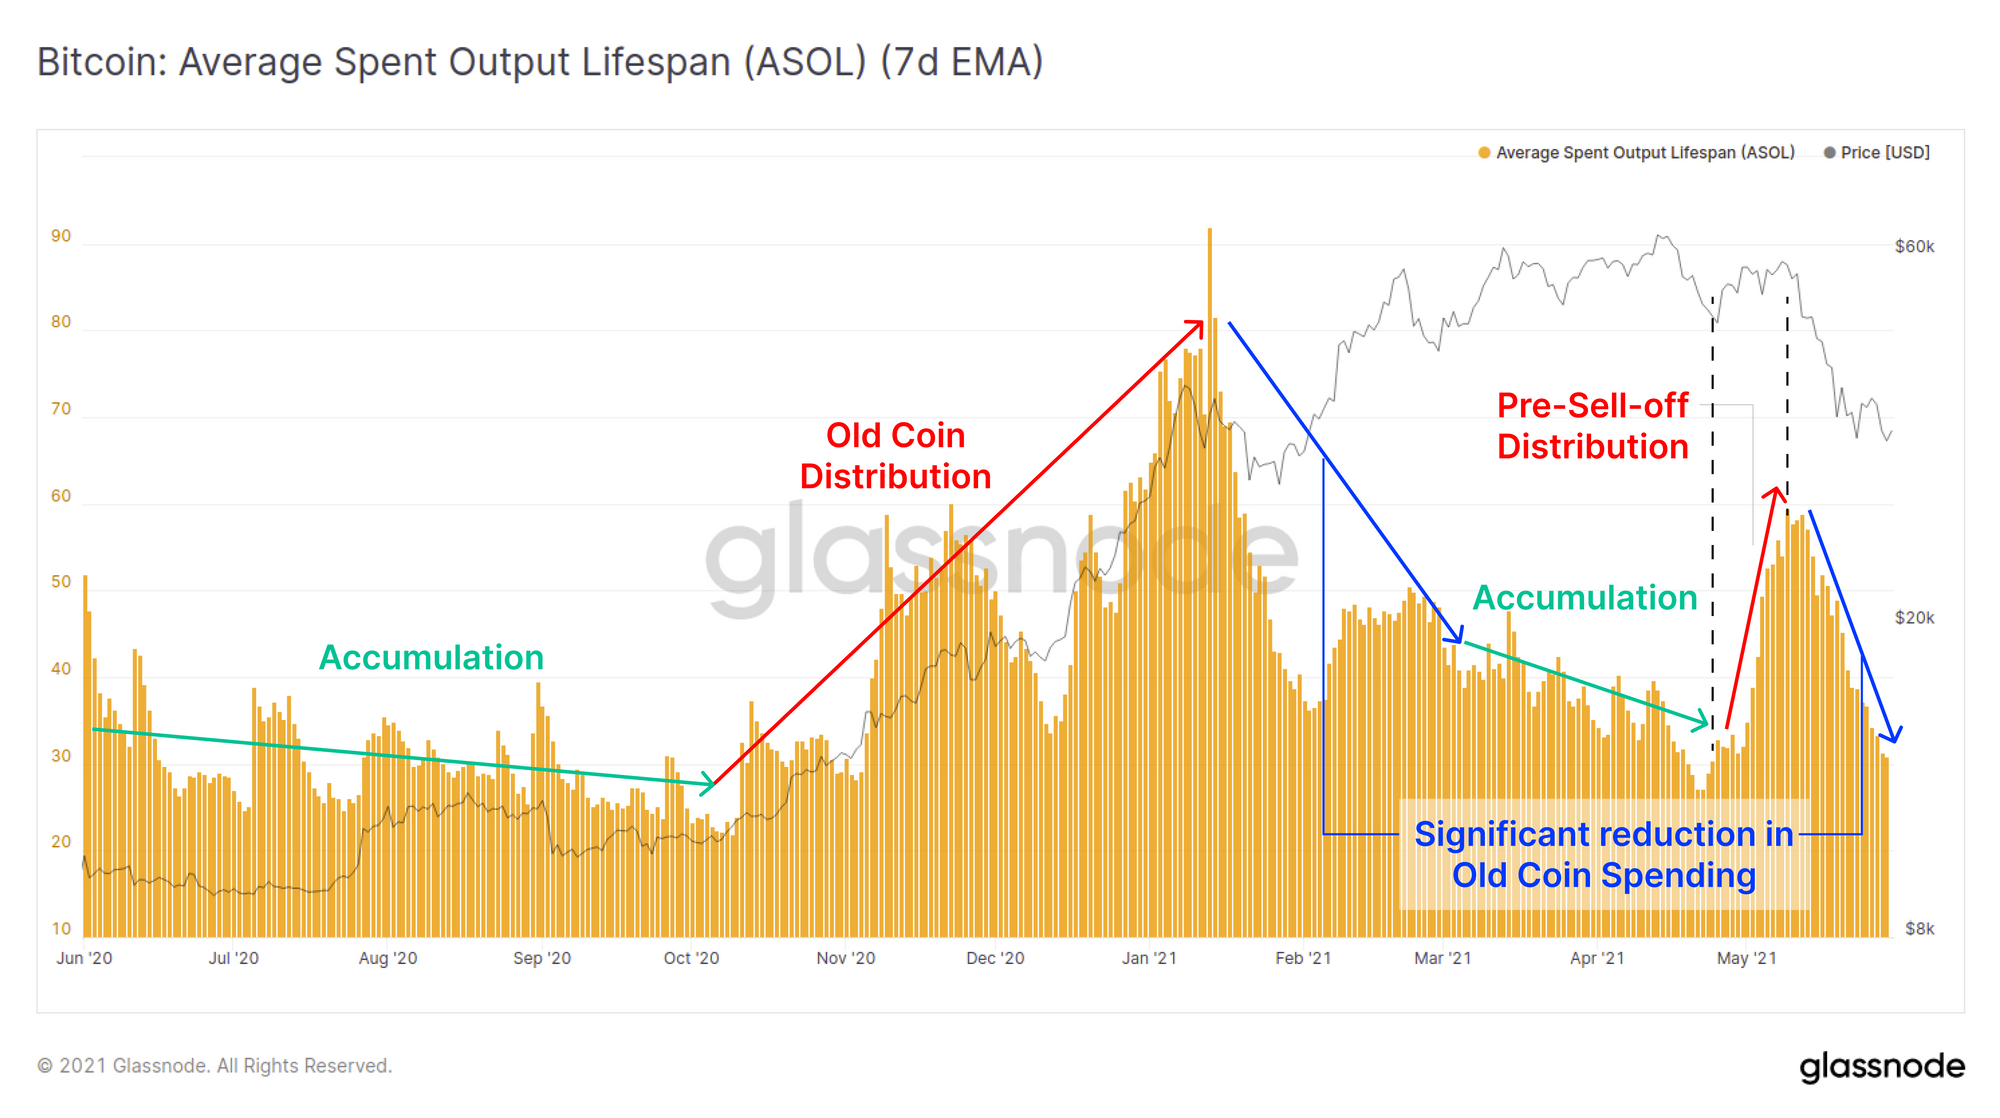
The Average Spent Output Lifespan metric (ASOL) provides insight into the average age of all UTXOs spent that day. In the chart below, we have applied a 7-day EMA to emphasise recent spending behaviour whilst also smoothing out daily noise.
- High ASOL values mean old coins are on the move and distributing.
- Low ASOL values suggest old coins remain HODLed and dormant.
There are a two key observations related to recent price action:
- Older coins saw a spike in spending behaviour in early May, likely in part distribution (smart money may have anticipated weakness) and also capital rotation (ETH doubled in price during this time).
- During the sell-off, ASOL fell dramatically, back to levels below the accumulation range seen between $50k and $60k. This indicates LTHs did not panic sell and capitulate and instead primarily HODLed through the dip.
Two more lifespan metrics, Coin-Days Destroyed and Dormancy tell a similar story. Older coins appear to remain dormant (low values) despite prices falling 50% from ATH.
- CDD represents the total lifespan spent by coins that day.
- Dormancy corrects CDD for on-chain volume showing spent lifespan per unit BTC.
- High value are generally bearish as old coins are spent and distributed.
- Low values are generally bullish as old coins remain dormant and accumulation takes place.
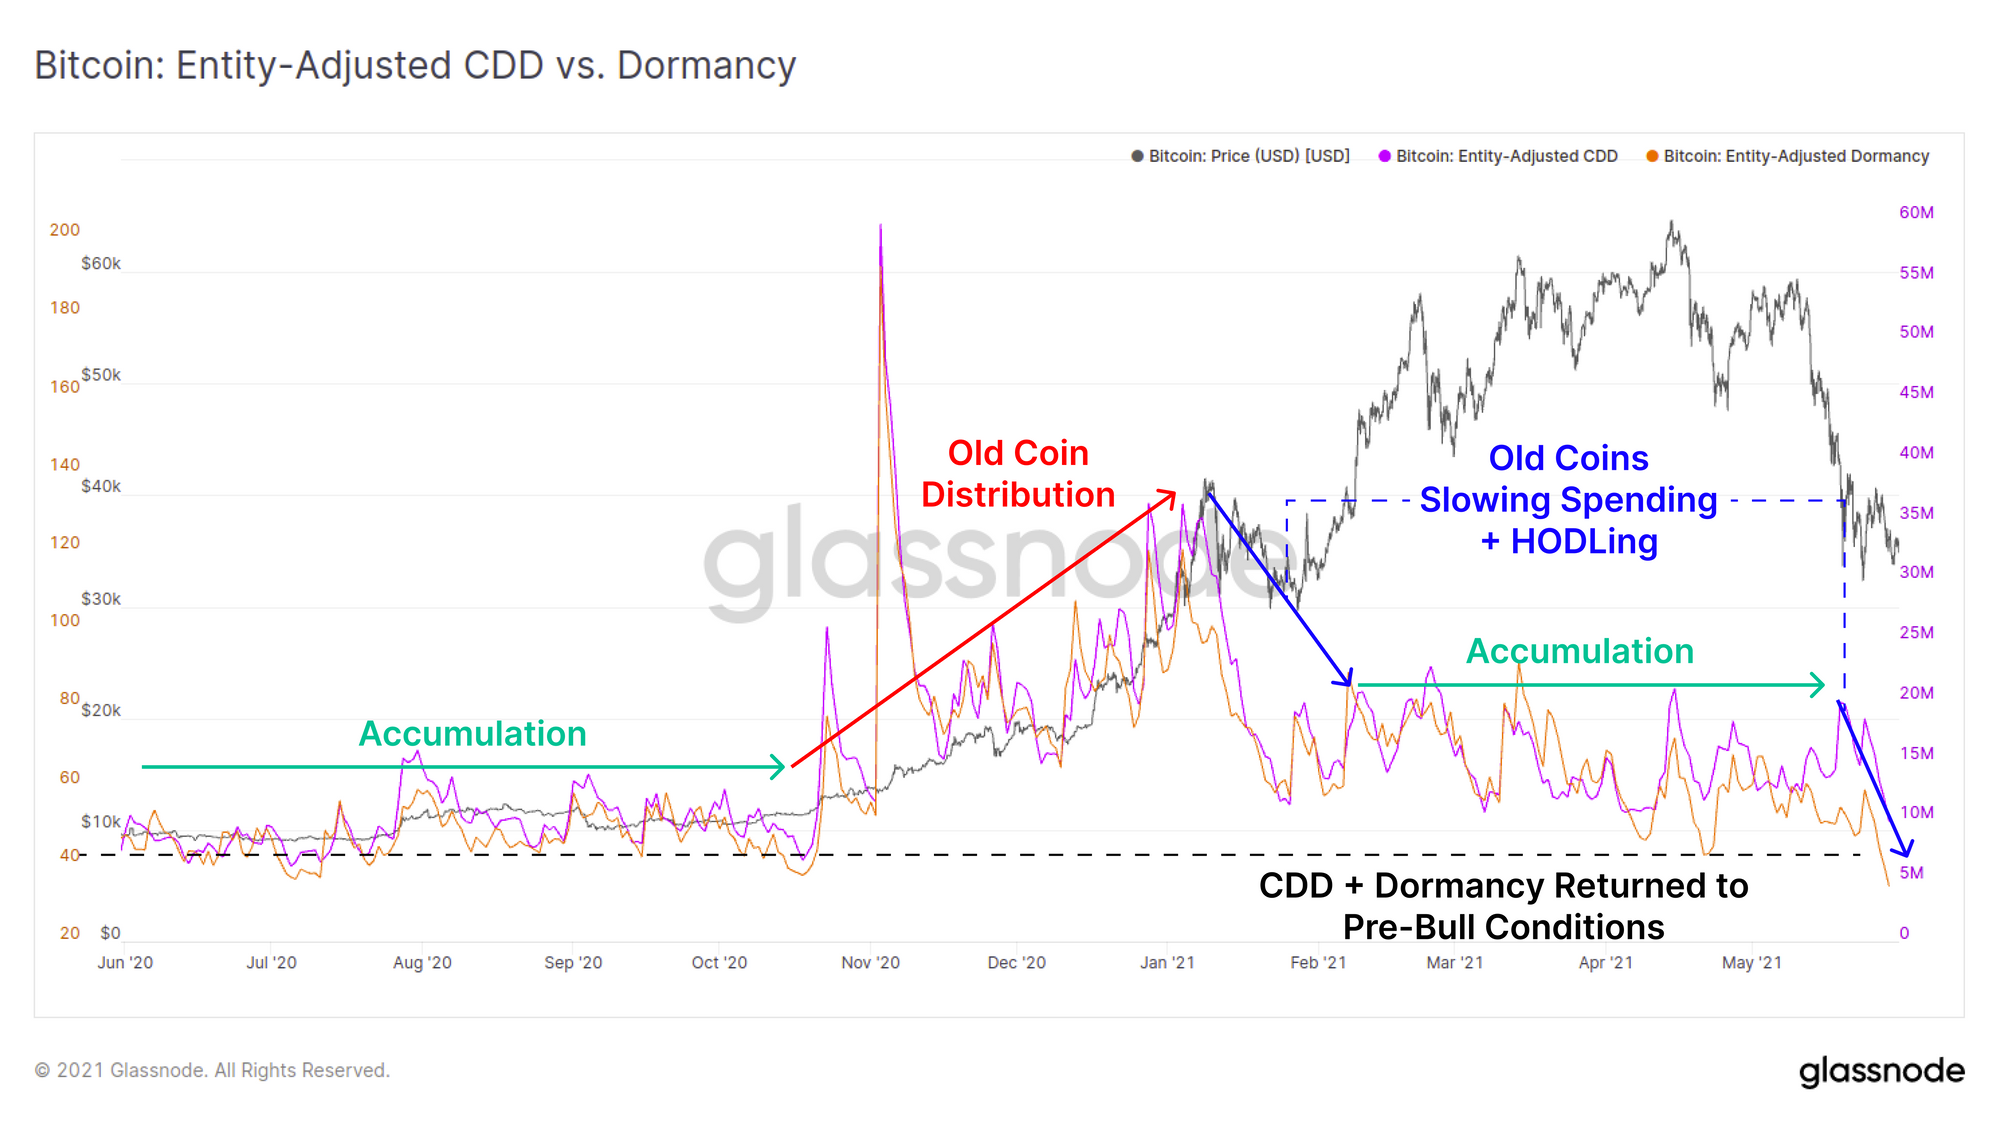
As seen in ASOL, the total amount of lifespan that is being spent has actually fallen at or below 2020 pre-bull market levels. This confirms that old coins are holding onto their stack, and the majority of spending is by holders of relatively young coins.
What these three metrics indicate is that older hands are not rushing for the exit. If ASOL/CDD/Dormancy continue to trend lower, it would be similar to previous accumulation ranges as old coins remain dormant and weak hands sell to strong hands. Conversely, if these metrics begin to trend higher, it may indicate older coins are being spent once again creating further sell pressure.
Note: We have recently released new video tutorials and Glassnode Academy entries for a number of metrics to aide analysts with interpretation. Video tutorials are available within Glassnode Studio for:
So Who is Selling?
So far we have established that old coins are spending less than usual. However price is falling and exchange balances are climbing. So the question is, who is the dominant driver of selling?
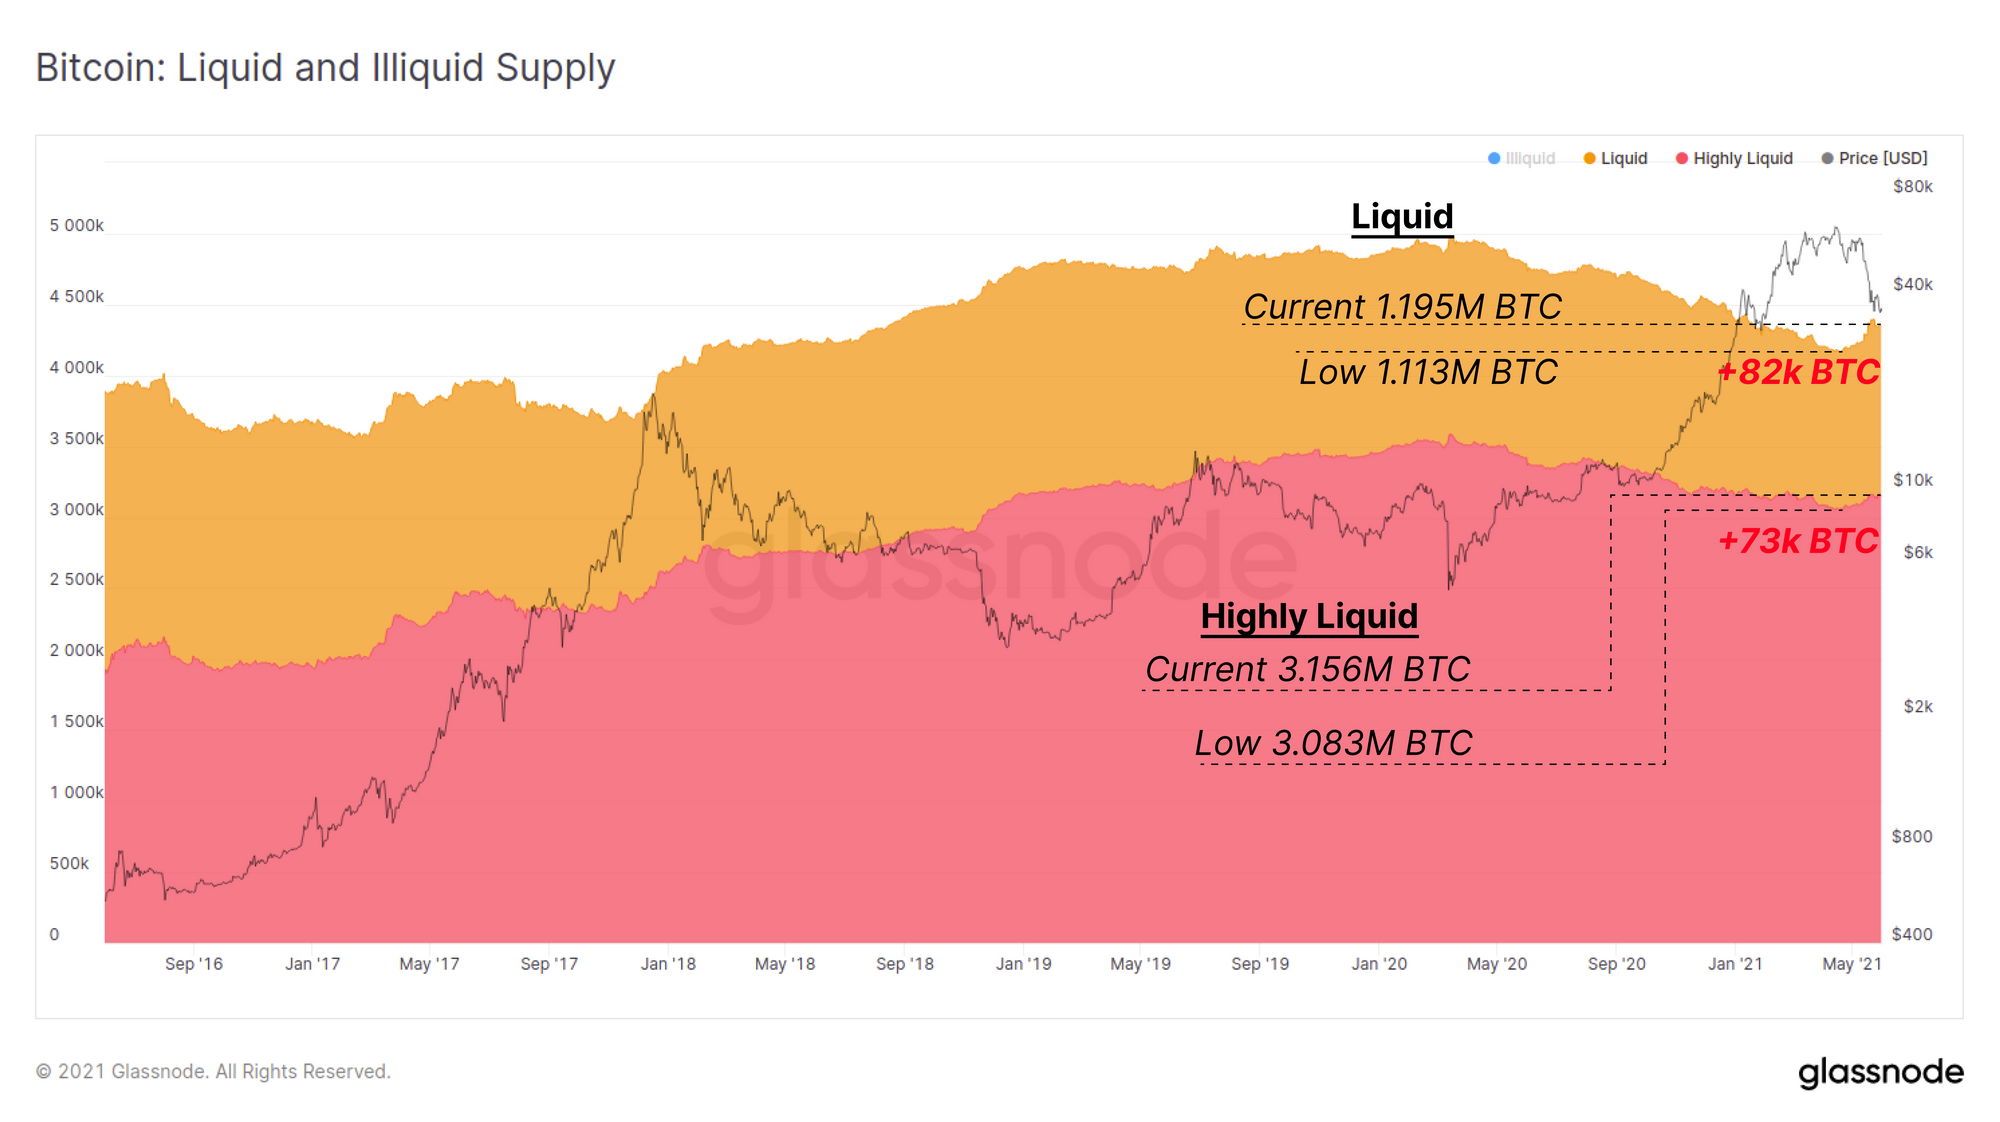
The Liquid and Illiquid Supply metric shows that throughout May, a total of 155k BTC have transitioned from an Illiquid state (HODLed) to Liquid or Highly Liquid state providing an estimate of the total 'sell pressure'. This will account for both LTHs and STHs who spent coins previously held by to wallets with heuristics similar to cold storage.
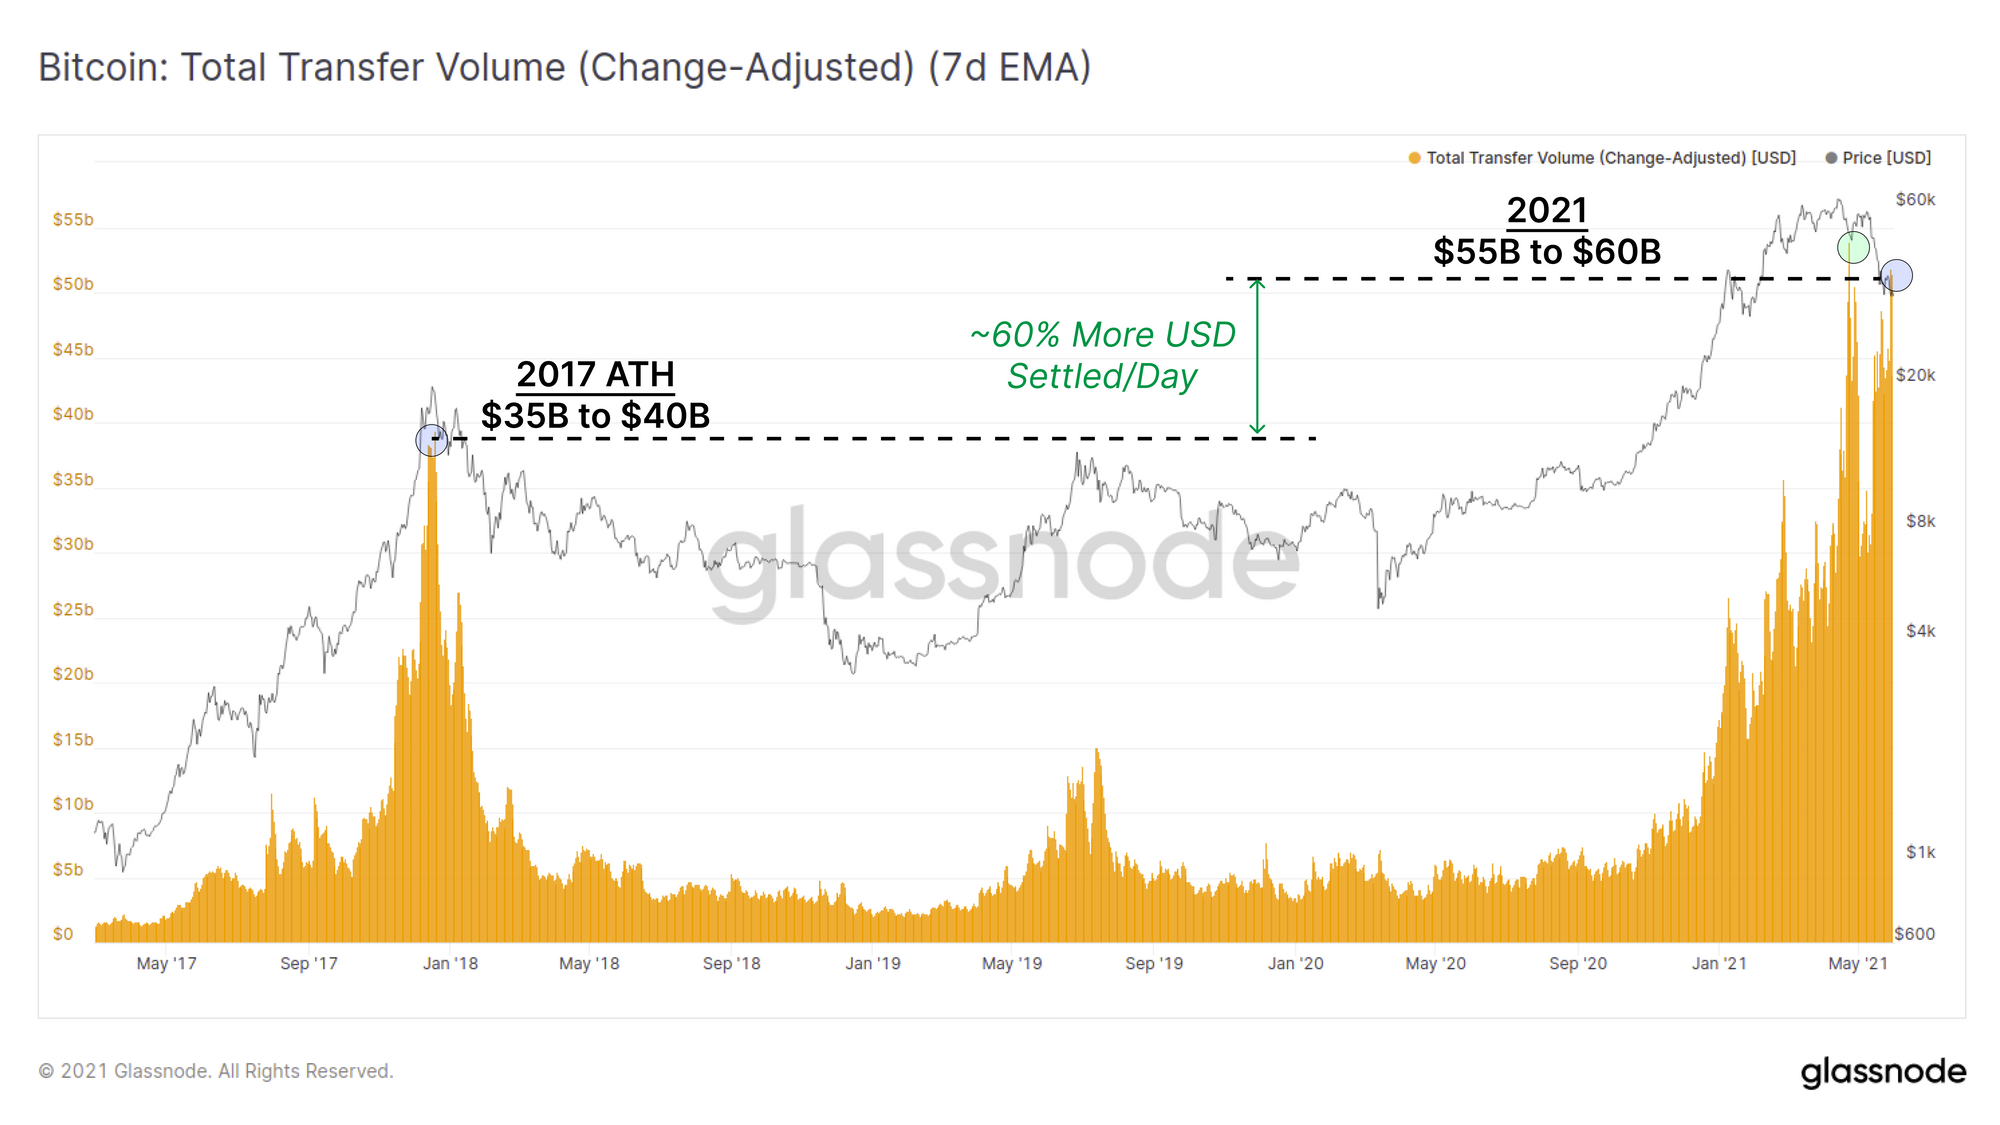
On-chain settlement in USD terms is also very close to ATH this week with over $55 Billion settled per day. This is 60% more volume than the 2017 peak. It is thus undeniable that a huge volume of coins are on the move.
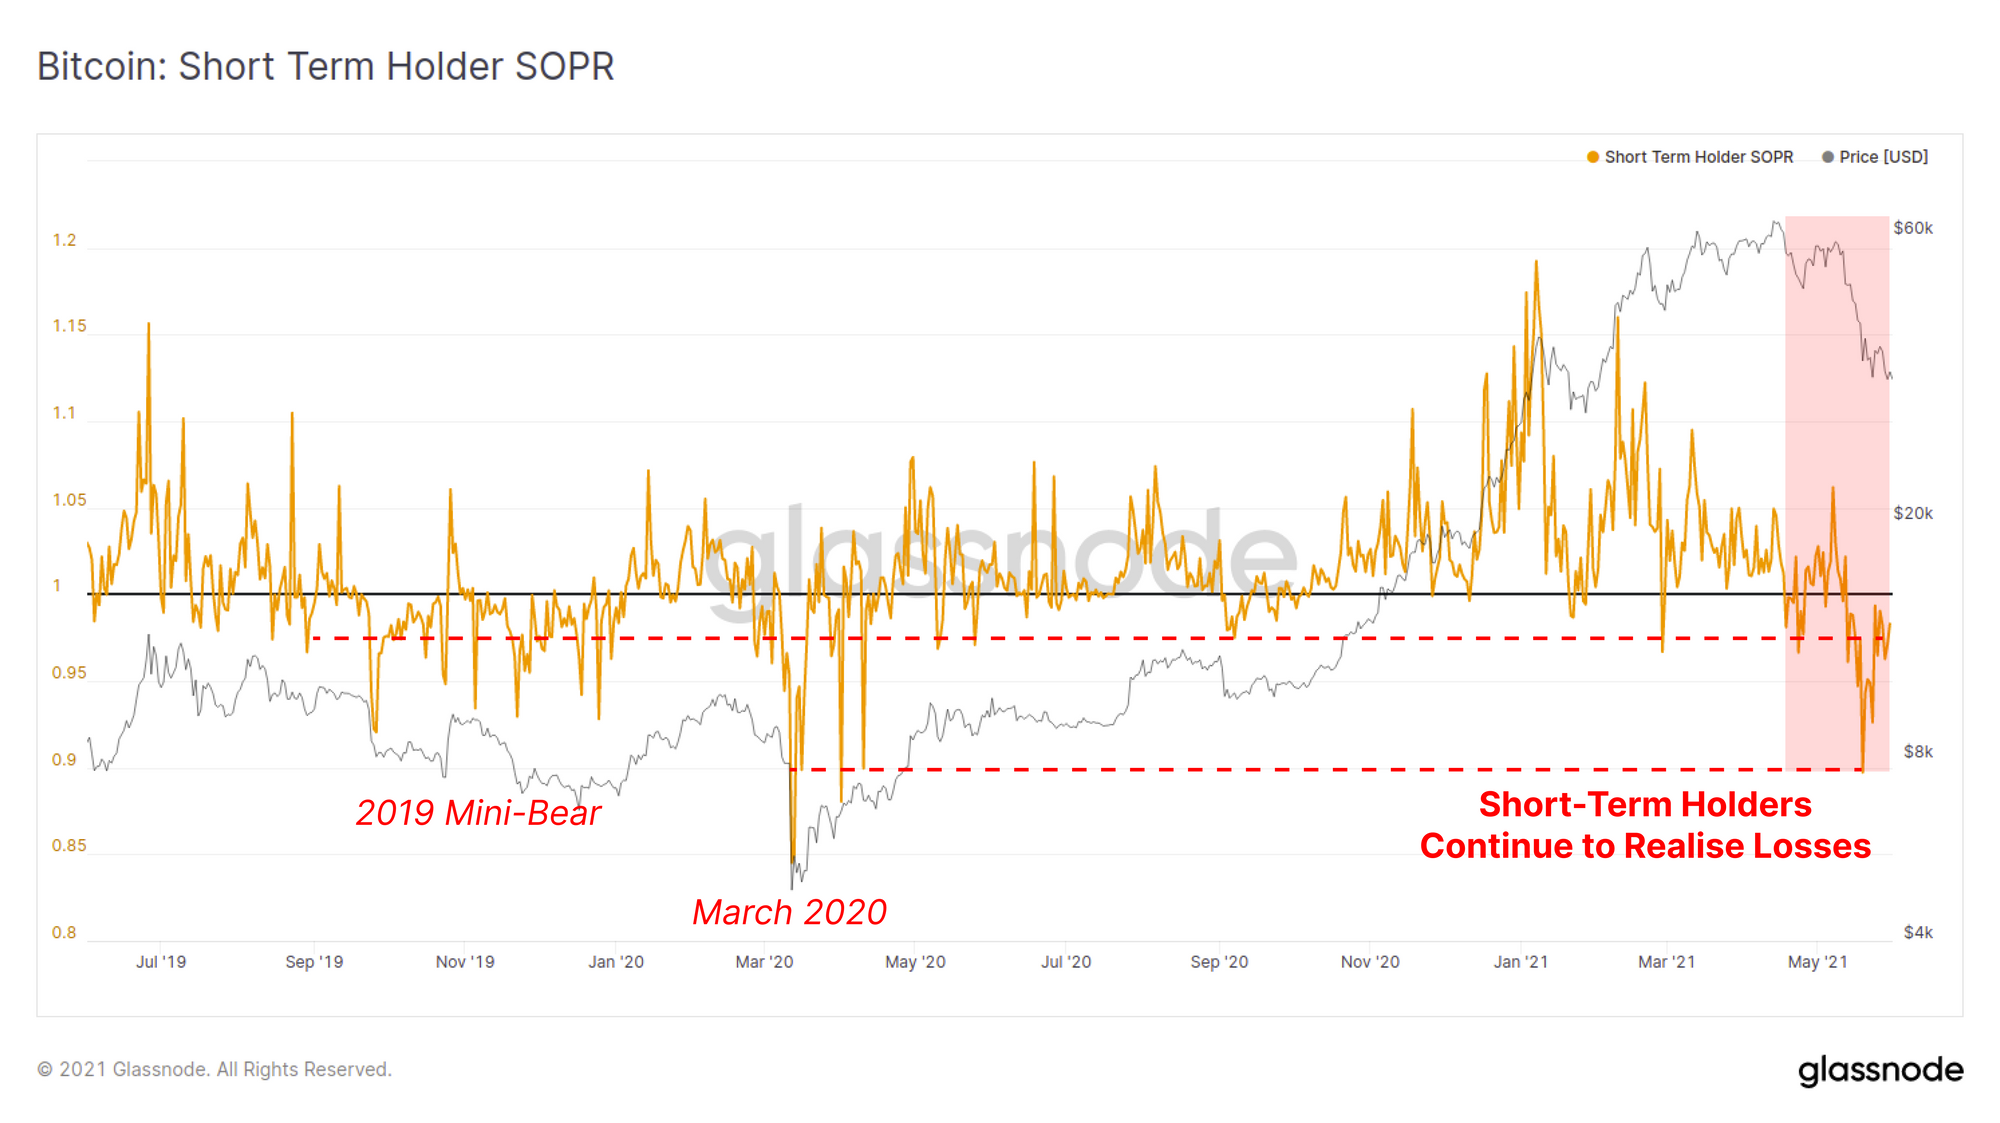
If we review the Spent Output Profit Ratio (SOPR) filtered for Short-Term Holders, we can see that STHs continue to realise losses by spending coins accumulated higher, at current, lower prices. This metric will persist below 1.0 for long periods when there is widespread capitulation. With this in mind, current market structure is comparable with the March 2020 capitulation event.
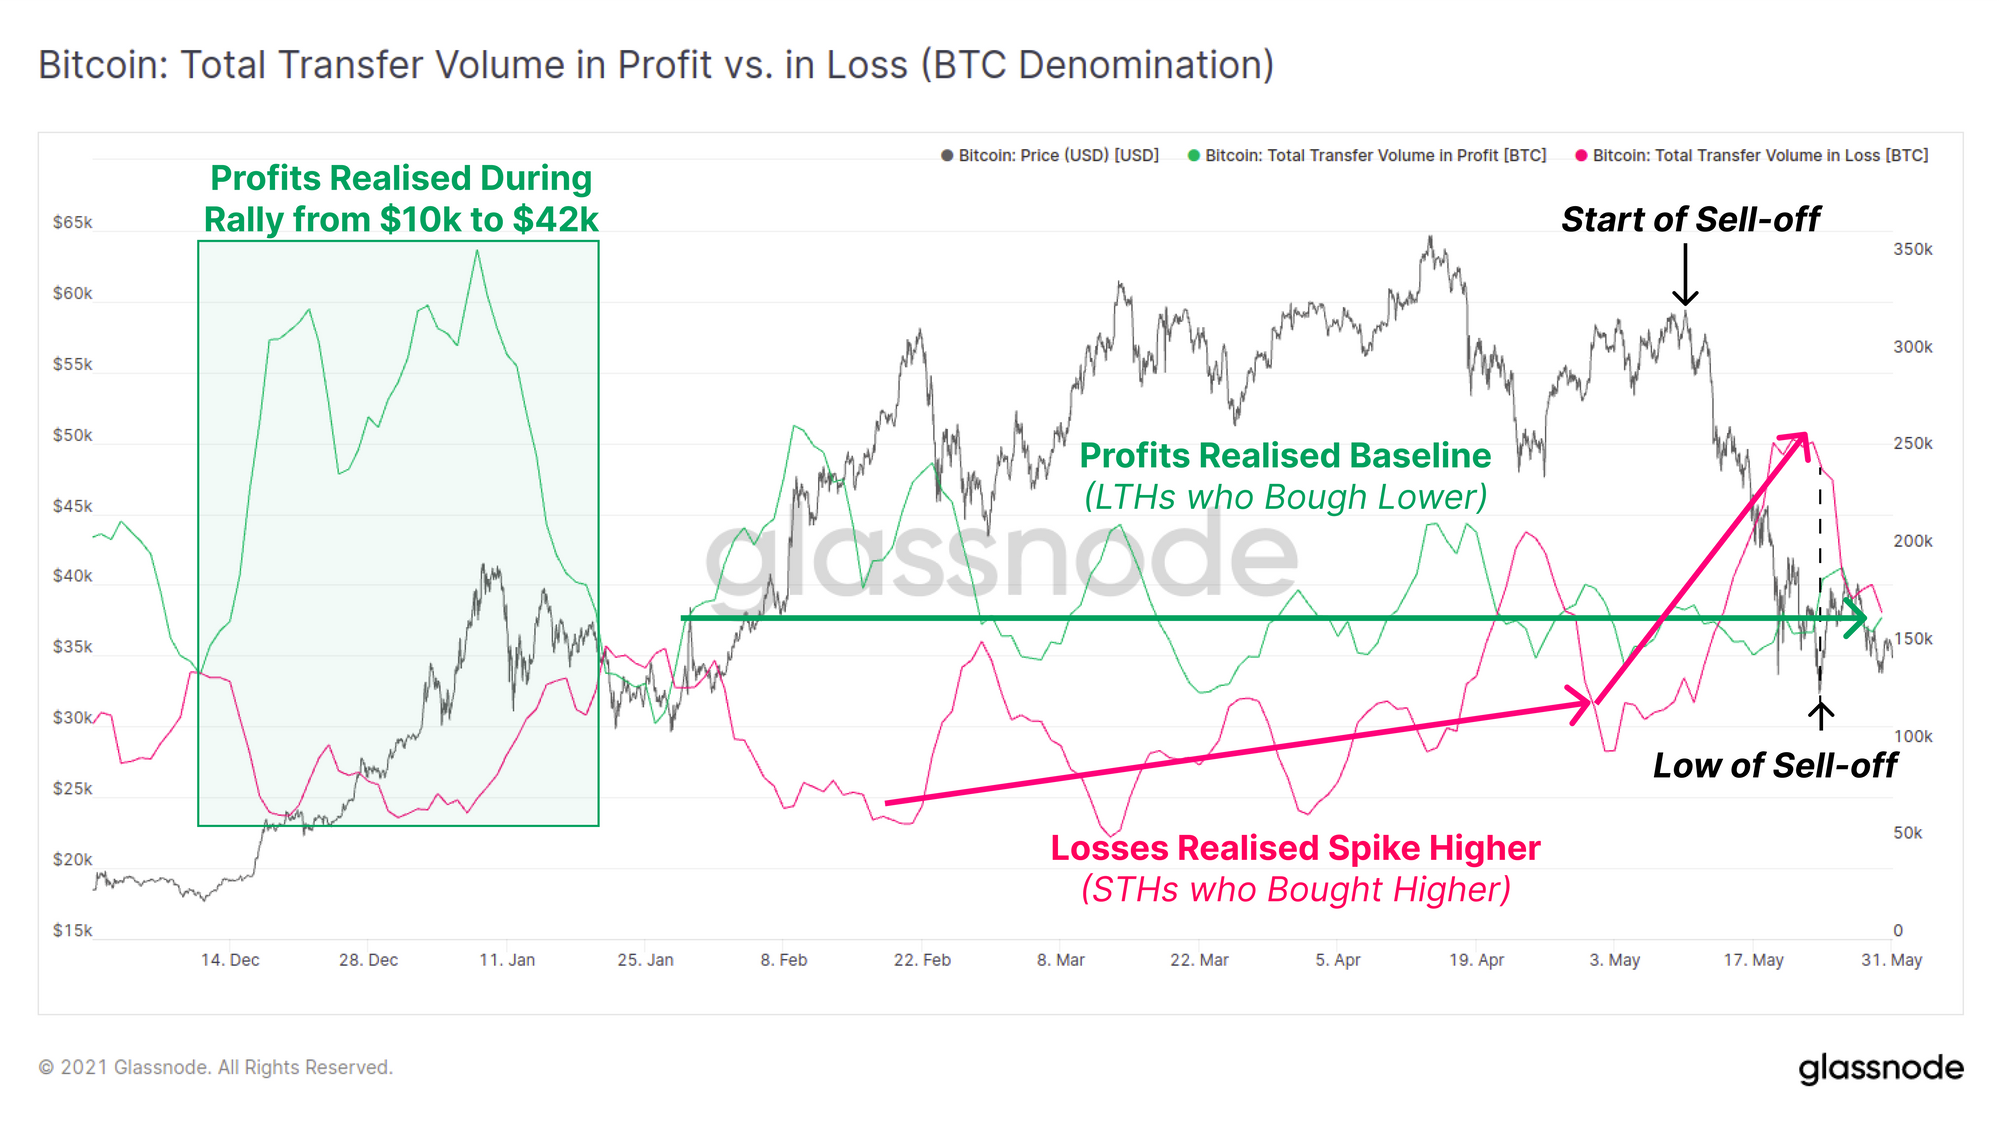
We can also review the amount of BTC transfer volume on-chain that is in profit (bought lower, LTHs) vs at a loss (bought higher, STHs). There are a number of key observations from the chart below which largely confirm the majority of spending and selling pressure is driven by short term holders:
- Long-Term holders clearly took profits during the early 2020 rally from $10k to $42k after which their spending reached a fairly stable baseline.
- Long-Term holder spending patterns appear unaffected by last weeks sell-off, and in fact the 'volatility' of spending volume has actually decreased. This indicates that LTHs are generally unwilling to liquidate coins at reduced prices.
- Short-Term holders on the other hand increased their spending by over 5x during this sell-off with the maximum spending occurring near the current local low of the market.
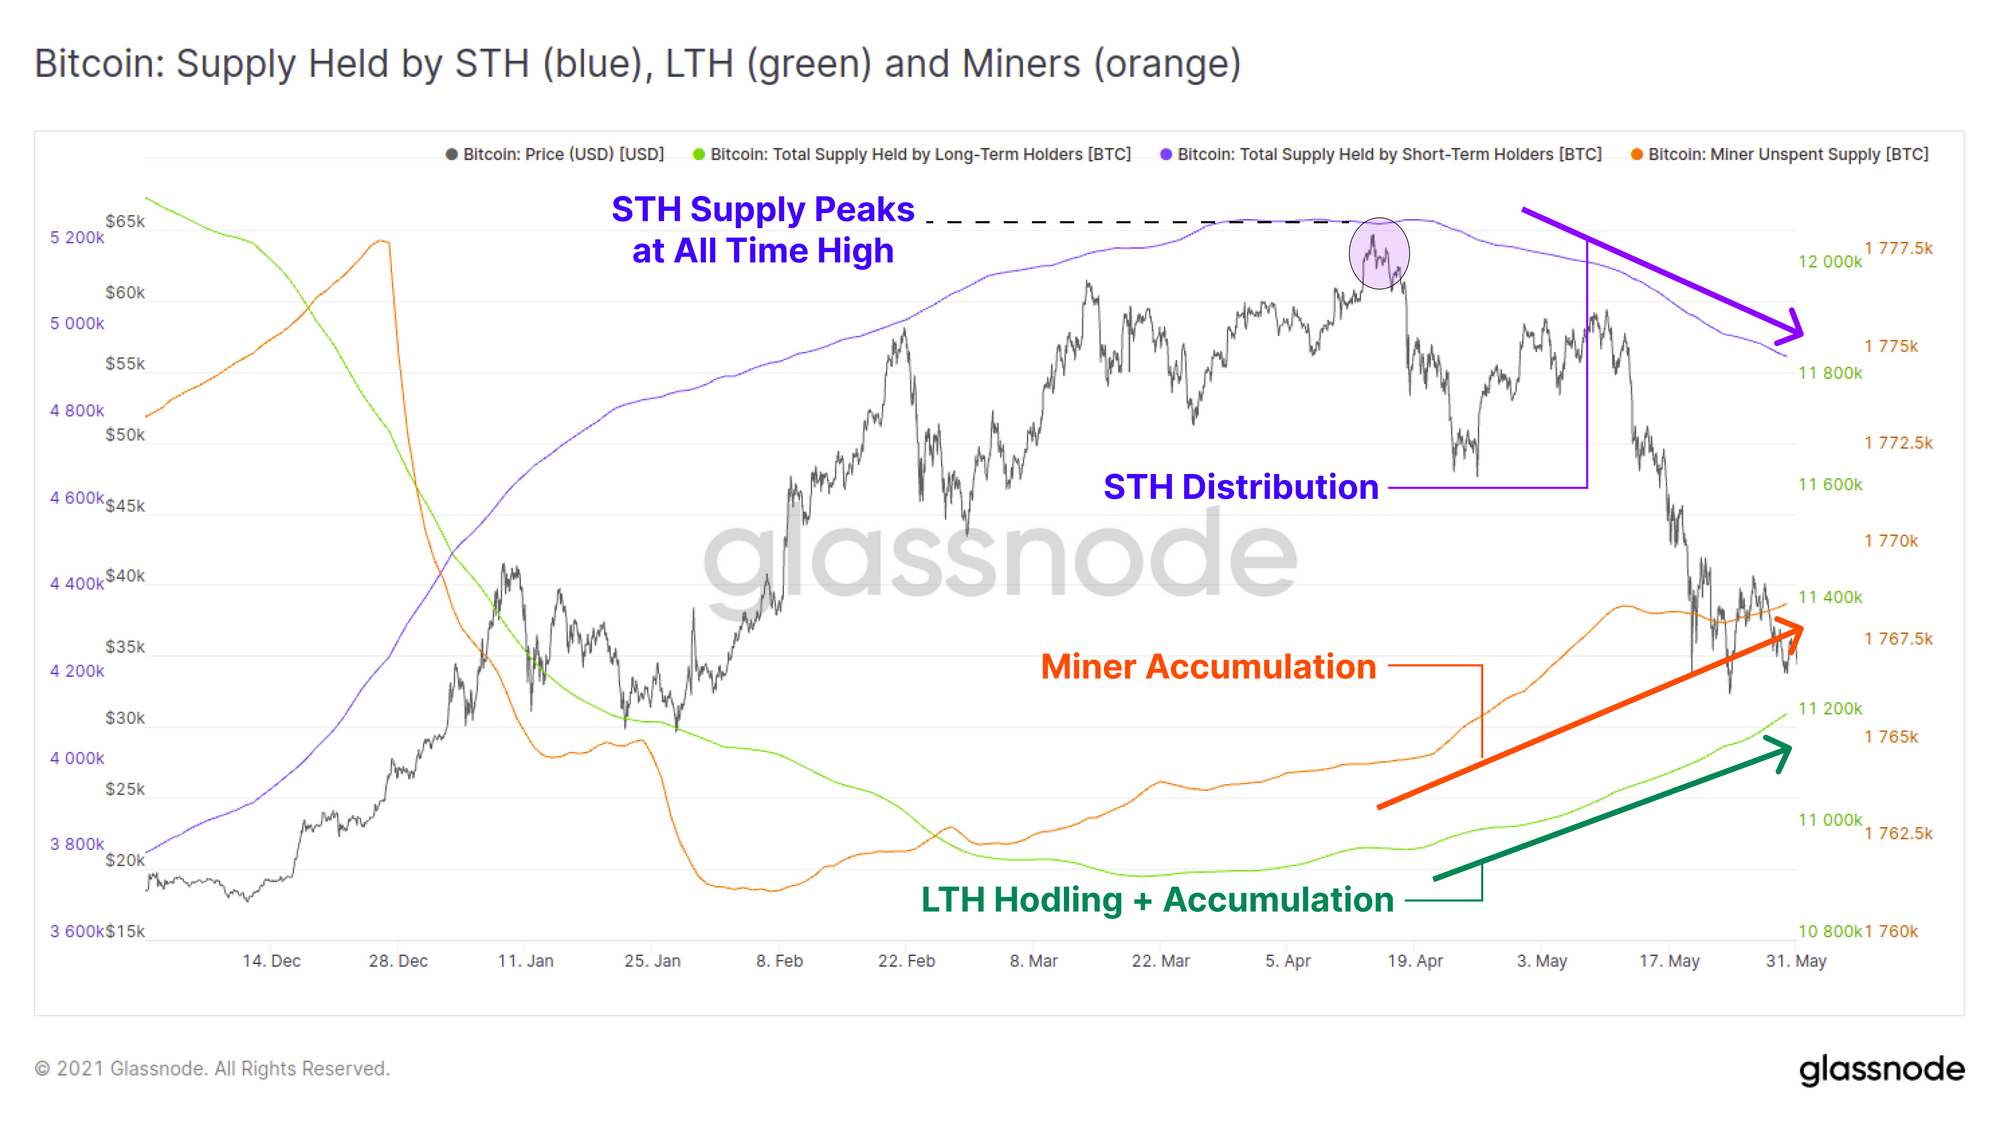
Finally, we can compare the supply held by three key parties: Short-Term Holders (blue), Long-term Holders (green) and Miners (orange).
- Short-Term holders are distributing.
- Long-Term holders are HODLing and accumulating.
- Miners are accumulating.
Without doubt, the current market structure is best described a battleground between the bulls and the bears with a clear trend forming between long term and short term investors. This is a battle of HODLer conviction and immediate buying power.
Week On-chain Dashboard
The Week On-chain Newsletter now has a live dashboard for all featured charts here.
New Glassnode Content
Surveying the May 2021 Sell-off
Last week we released a deep dive analysis into the before and after of last weeks sell-off. We analyse the early warning signs of weakness alongside early signals of recovery to assess bull and bear arguments.

DeFi Uncovered: Navigating the Crash
We have released a new content series focused on insights and analysis pertaining to the rapidly expanding DeFi sector. Our latest piece analyses and explores thew resilience and performance of the DeFi sector as prices were rapidly marked-down by over 50% across the board.
Check out the article here and to sign-up for more DeFi insights here.

Product Updates
Metrics and Assets
New video tutorials released inside Glassnode Studio for:

- Lesen Sie diesen Artikel jetzt auf Deutsch bei unserem offiziellen Partner Bitcoin2Go
- Follow us and reach out on Twitter
- Join our Telegram channel
- For on–chain metrics and activity graphs, visit Glassnode Studio
- For automated alerts on core on–chain metrics and activity on exchanges, visit our Glassnode Alerts Twitter