All-Time-High Buyers Capitulate

Amidst kinetic conflict in Ukraine, investors who purchased around the Bitcoin ATH have almost completely capitulated. On the flip-side, the cohort of HODLers continue to accumulate, seemingly unfazed by macro and geopolitical risks.

All-Time-High Buyers Capitulate

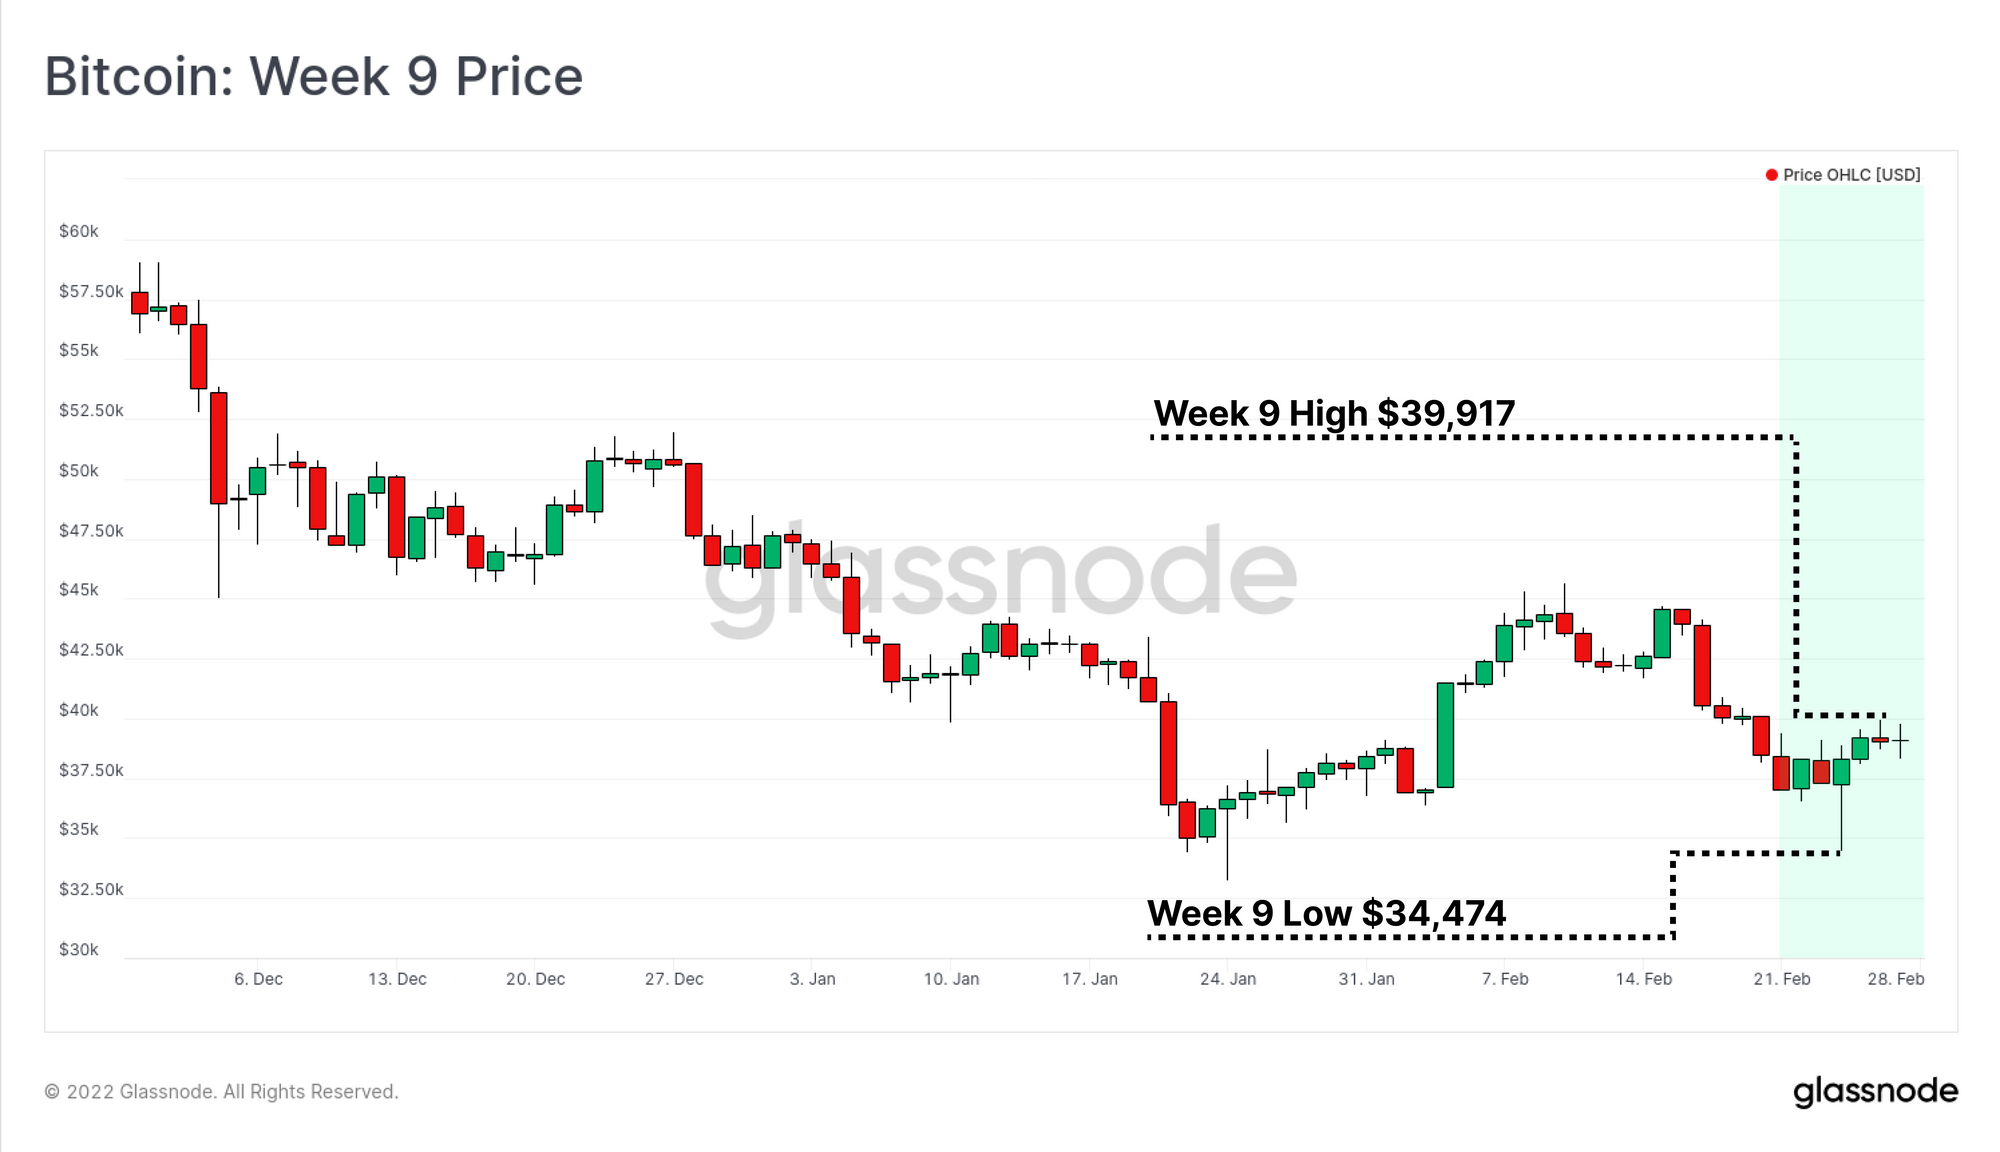
Global markets have faced a very sobering week, as armed conflict breaks out between Russia and Ukraine. As a global macro asset, and with markets that never close, the price of Bitcoin was quite volatile in response. This week the market traded down to a low of $34,474, before rapidly recovering to a high of $39,917.

Having now been in a drawdown from the November ATH for 138-days, the conviction of many Bitcoin investors, mostly those whom bought near the top, has been significantly challenged this week. In this edition, we will analyse what looks like a flush out of top buyers, and draw comparisons between current market structure and the May-July 2021 period.

What we will observe is that top buyers have almost completely capitulated now. However, the remaining distribution of holders appear to be of a far higher resolve, arguably reflecting the unwavering conviction of the buyers of last resort: Bitcoin HODLers.


Translations

This Week On-chain is now being translated into Spanish, Italian, Chinese, Japanese, Turkish, French, and Portuguese.

The Week Onchain Dashboard

The Week Onchain Newsletter has a live dashboard with all featured charts available here. This dashboard and all covered metrics are explored further in our Video Report which is released on Tuesdays each week. Visit and subscribe to our Youtube Channel, and visit our Video Portal for more video content and metric tutorials.


We will start this analysis with a deep dive on the URPD metric, which shows the distribution of coin supply at the price it last moved on-chain. What we wish to explore here are the similarities and differences between investor behaviour during this drawdown, to the similar scale one in May-July 2021.

We will analyse the URPD metric from four dates:

  1. 10-May-2021 just before the liquidation cascade sell-off event
  2. 20-July-2021 at the $29k low before the rally to ATH in late 2021
  3. 9-Nov-2021 at the current market all-time-high
  4. 27-Feb-2022 at the time of writing.

Starting with the May-July period, the coin distribution was skewed to be very top-heavy, with a large proportion of the coin supply held between $54k and $60k. Whilst this showed a degree of demand at higher prices, it also made for a fragile market with many 'top buyers' who would be sensitive to any major price correction.

Live Chart (10-5-2021)

What eventuated was a major market capitulation. Both spot and derivative markets were flushed of all exuberance, the on-chain activity on the Bitcoin network collapsed, and it can be reasonably argued that this was the start of the present bear market.

During this 2.5 month long period of consolidation, a great deal of supply was transferred by top buyers into exchanges for sale. This supply was then gradually soaked up by higher conviction buyers, with the cost basis of these coins becoming more heavily weighted between in the $29k to $40k price range.

This behaviour describes a broad scale weak hand to strong hand redistribution event.

Live Chart (20-July-2021)

Moving to the present market correction, and we can see a remarkably even distribution of the coin supply was established during the rally from July 2021, into the Nov ATH. This distribution indicates the following:

  • Many investors who accumulated in the May-July correction took profits on the way back up. This created volume nodes around $35k, $47k and $62k.
  • Buyers saw value and entered the market throughout the August to November rally. This is despite on-chain activity indicating that the majority of 'market tourists' had left, and only the HODLers remained.
Live Chart (9-11-2021)

This brings us to the present day, where we can see that much of this evenly distributed supply from November remains in place. Despite a 50%+ correction, these investors have not liquidated their positions.

Furthermore, the primary redistribution appears to be coming from investors who bought the $60k+ range around the all-time-high, which has found new owners around the current price range of $35k to $38k.

This spending behaviour describes a market dominated by price insensitive HODLers, who appear unwilling to liquidate their coins, even if held at a loss. Meanwhile top buyers have been significantly flushed out, and represent a far smaller proportion of the investor cohort when compared to May-July 2021.

Live Chart

Top Buyers May Have Already Capitulated

The news events of this week are world changing. If there was to be a time that Bitcoin investors would capitulate, especially those who see it as a risk-on asset, the break out of kinetic war would be a likely catalyst.

However, the degree of on-chain capitulation that occurred during this week's sell-off was lacklustre to say the least. In fact it exhibits similar characteristics to the 20-July-2021 sell-off to $29k (Point 3 below) which simply didn't have the bearish follow through to break prices down to new lows.

This week saw a net realized losses of $713M which is significantly less than the $2.0B+ capitulation events experienced earlier in the correction.

Live Chart

We have also seen a persistent decline in the number of investors depositing to exchanges (pink), falling from 74k /day at the Nov ATH, down to 41k/day today. Meanwhile, exchange withdrawals are holding very steady at around 40k to 48k/day, again indicative of a consistent pool of HODLers withdrawing rain, hail, or shine.

Live Workbench Chart

Of course the number of exchange deposits or withdrawals is only part of the picture, and it is the volume carried by each that helps establish the balance between of supply and demand.

The chart below shows a 30-day EMA of exchange net flows and we can see that since July, the market has favoured coin withdrawals (red, outflows). The trend in exchange outflows has softened over this time, however we still have not seen inflows anywhere close to that experienced in May-July last year, even with all the macro headwinds that are in play.

The current market does not appear to have lost confidence in Bitcoin as a macro asset.

Live Chart

We can also see this in the revived supply metric looking at the volume of coins older than 1yr that were spent this week. If there was widespread loss of conviction amongst the Bitcoin HODLer cohort, we would expect this metric to see a significant uptick.

However this has not eventuated yet, and revived supply remains below 5k BTC/day which is fairly typical of previous accumulation periods.

Live Chart

There is one cohort who have dominated on-chain spending to exchanges over the last few weeks; the investors who bought the dip, only to find out that there were many more dips to come. Investors with coins aged younger than 3months have dominated at loss spending over the last 30-days. The spending of these young coins have realized a collective loss of -0.05% of the market cap per day for the last month, commensurate with bear market lows through the first half of 2018.

With the exception of June-July last year, widespread market bottoms are usually characterised by a mass exit of both new and old investors, as broad scale fear takes hold.

Given we have not seen a similar long-term holder capitulation yet, perhaps Bitcoin HODLers are built differently this time? Or, perhaps there is yet another painful dip to come to flush absolutely all remaining sellers out of the market.

This is an early look at an unreleased chart from the Glassnode Engine Room.

Strong Hands Keep Stacking

With top buyers largely flushed out of the network, and evidence it is a HODLer dominated market, we will close out with three charts that help describe what this long-time horizon cohort may be doing.

First up is Illiquid Supply, which tracks the volume of coins held in wallets with little to no history of spending. These often represent cold storage and the wallets of HODLers who withdraw religiously whilst undertaking a dollar-cost average style strategy.

As a proportion of circulating supply, Illiquid Supply has now surpassed the May 2021 peak, reaching 76.3%. This has now returned to the same level as the 2017 market top, reversing a four year long increase in coin wallet liquidity. Note however that both of these instances preceded major sell-off events, an thus it remains to be seen if these coins are truly in cold storage.

Live Chart

Telling a similar story, the Realized Cap HODL wave bands older than 3mths are pushing to new local highs of 72%. This means that 72% of the USD value 'stored in Bitcoin', is held by coins 3mths and older.

This is typical of bear markets where long-term investors see value and simultaneously slow their spending (as was seen in Revived Supply above). Note that much of this recent uplift is driven by the 3m-6m old age band in orange at the bottom. These are coins that are in approaching or in process of crossing the Short-to-Long-Term Holder boundary of 155-days (~5mths).

Live Chart

And finally, to demonstrate just how much coin volume has been absorbed by HODLers over the last 3 months, we look at the coin volume crossing the 3mth+ age threshold over the last 30-days.

At present, over 335k BTC are maturing to 3mth+ ages per 30-days, which is 12.2x the daily coin issuance to miners. A similar magnitude of HODLing behaviour was observed in mid-2020, and Jun-Sept 2021, both of which preceded powerful upside moves.

Live Chart

Summary and Conclusions

The current market is extremely interesting from both an on-chain, and a macro perspective. Given the enormous magnitude of uncertainty and risk that a kinetic conflict introduces, must be prudent with an expectation of further de-risking, investor panic, and capitulation events. So far however, we have not seen a widespread capitulation event, with exception of very short-term holders whom purchased the ATH or premature dips during this drawdown. Keep note that many signals of 'hype demand' remain well below bull market levels (covered last week).

Despite this very uncertain macro and geopolitical backdrop, the behaviour of Bitcoin HODLers maintain a remarkably bullish conviction. Coins continue to be withdrawn from exchanges, are moving into increasingly illiquid wallets, and are maturing into increasingly senior age bands at a high rate. These look like Long-Term Holder coins in the making.

It is now key to watch in case these coherent trends begin to reverse, which may signal broad-scale loss of confidence. However in lieu of such a reversal, these observations continue to paint a favourable and constructive future for Bitcoin, somewhere over the horizon.


Product Updates

All product updates, improvements and manual updates to metrics and data are recorded in our changelog for your reference.


Disclaimer: This report does not provide any investment advice. All data is provided for information purposes only. No investment decision shall be based on the information provided here and you are solely responsible for your own investment decisions.