Short-Term Pain, But Long-Term Gain?

The Bitcoin market has traded back below $40k, as weakness continues to pressure prices lower. However, under the surface, a deep, and widespread capitulation event appears to have been absorbed by persistent, robust and quiet demand.

Short-Term Pain, But Long-Term Gain?

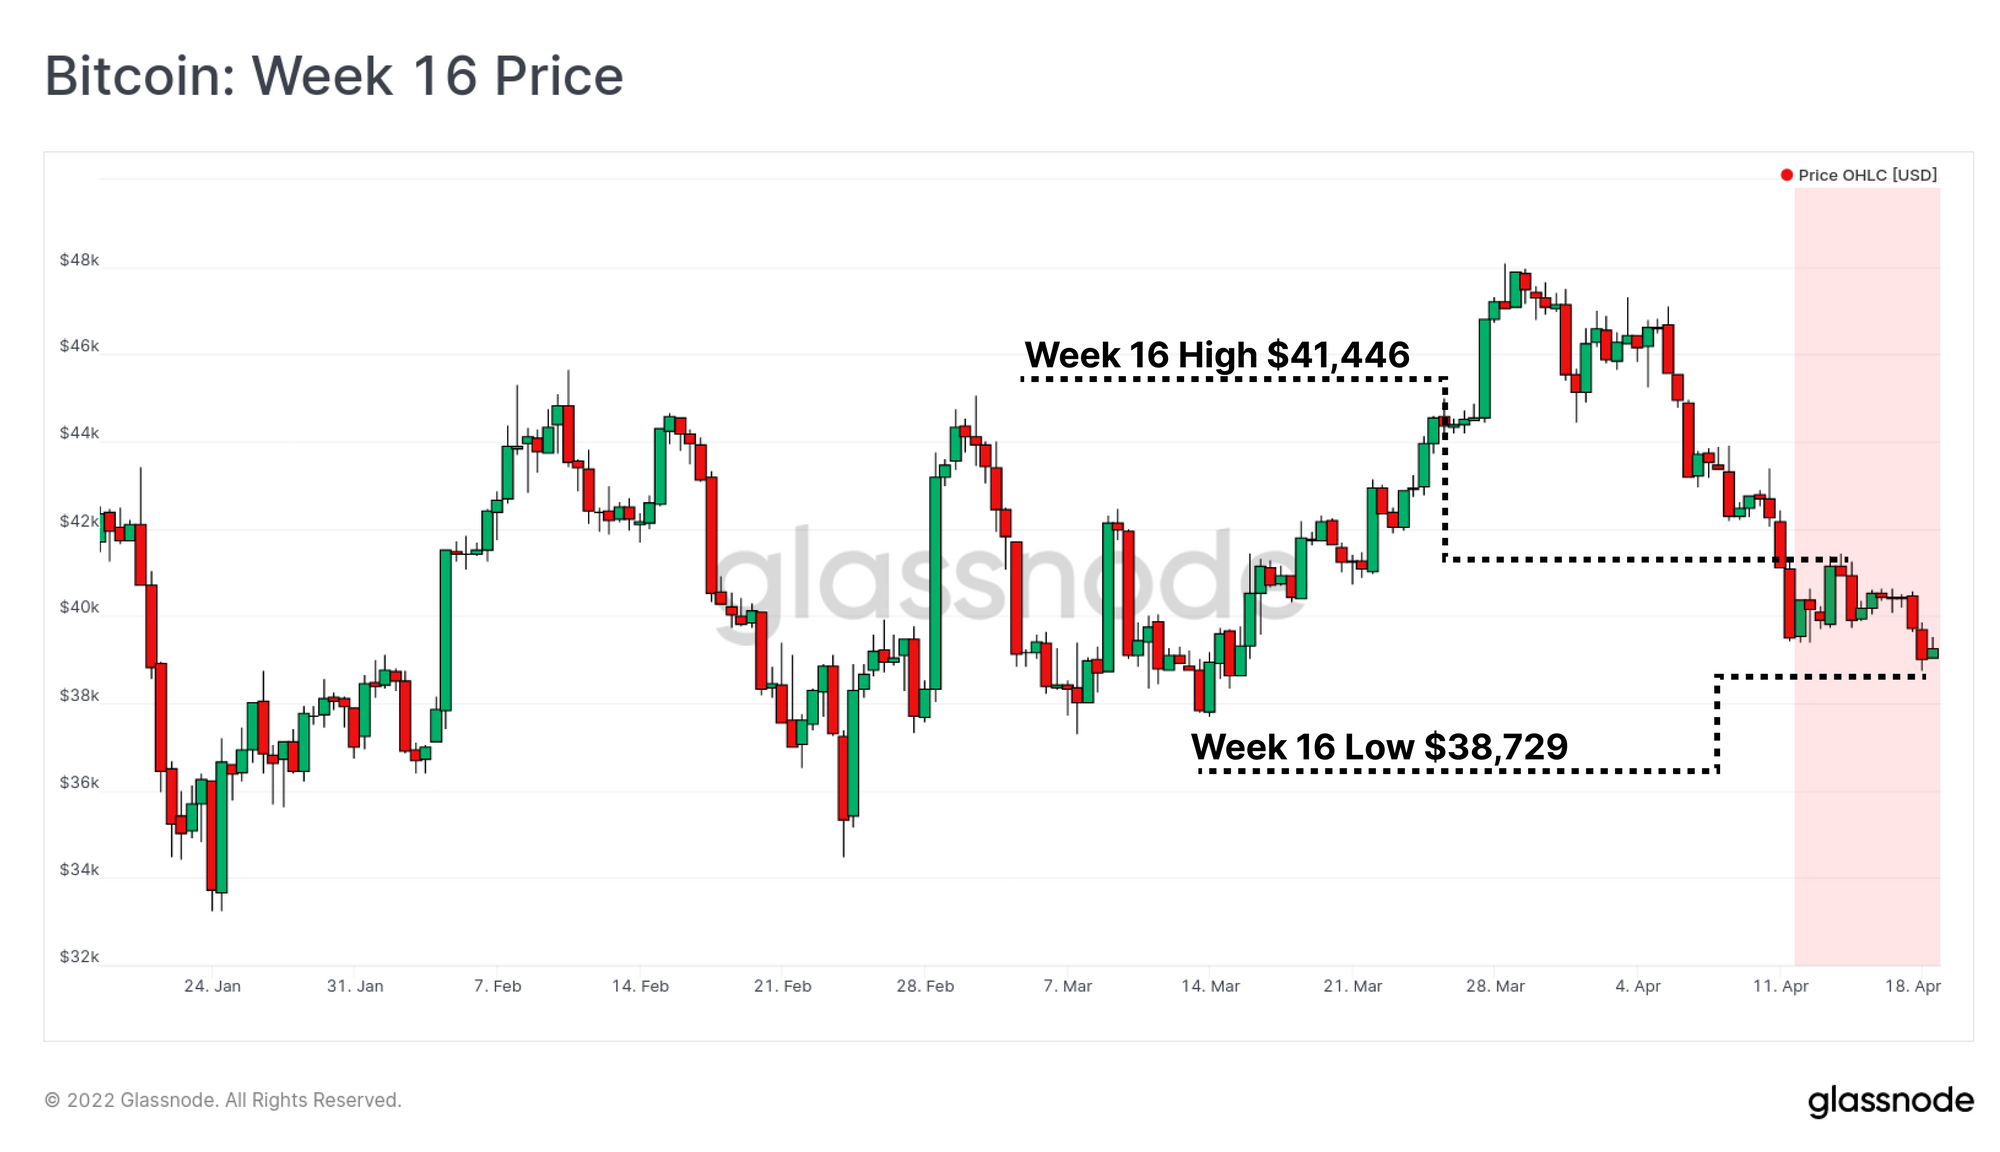
Bitcoin investors have weathered another weak week, with prices briefly trading back below $40k, completely retracing the March rally. Prices peaked at a high of $41,446 early in the week, before sliding to set a new local low of $38,729.

The Bitcoin market remains strongly correlated with traditional equity markets, which themselves have struggled to catch any serious or sustained bid, running up against numerous macro headwinds. The current broader market environment is one of rapid change, with a wide array of commodity markets breaking to new highs, bond yields trading strongly higher, and a seemingly ever worsening supply chain disruptions and headline inflation. As a relatively new, globally traded, and persistently active market, it is unsurprising that the Bitcoin price often reacts to a very wide scope of market forces.

Absorbing information across so many market segments is exceptionally challenging. However, if we consider Bitcoin to be an asset that appears to increasingly respond to broad market forces, then a study of its holding behaviour can provide a somewhat distilled view into the investment decisions and sentiment of other market participants.

In this edition we will deep dive into two important cohorts of Bitcoin holders, which we have defined based in their statistical likelihood of spending coins; the Long and Short-Term Holders. By analysing these two groups, we can identify holding patterns, capitulation potential, and whether risks and opportunities can be identified via the study of their aggregate behaviour.


Translations

This Week On-chain is now being translated into Spanish, Italian, Chinese, Japanese, Turkish, French, Portuguese, and Farsi.

The Week Onchain Dashboard

The Week Onchain Newsletter has a live dashboard with all featured charts available here. This dashboard and all covered metrics are explored further n our Video Report which is released on Tuesdays each week. Visit and subscribe to our Youtube Channel, and visit our Video Portal for more video content and metric tutorials.


Investor Value Zone

In the last few newsletter editions, we have explored how the $35k to $42k price zone for Bitcoin has seen fairly significant investor demand inflows, with a large number of coins changing hands in this price range. What we have yet to see is a follow on impulse of demand to break free of this range, and as a result, it continues to act as a source of gravity on the market.

In the first two charts, we will explore how the price distribution of coin supply has changed between the $33k low set on 22-Jan, and today.

The current price low of $33k was set on 22-Jan, putting a pause on the 2.5 month price decline from the ATH set in early November. On the 22-Jan, the range of prices at which the Bitcoin supply had last transacted was relatively well distributed between $35k and $63k (think of this as an on-chain volume profile in technical analysis).

This shows a relatively consistent demand was in place for BTC both on the way up (Aug-Nov) and on the way back down (Nov-Jan).

Live Chart

If we compare this (blue) to the current coin price distribution, we can identify the following insights:

  • A large amount of coin supply has been re-accumulated between $38k and $45k, which is the primary price range of the current market consolidation.
  • Blue: Much of the volume profile from 22-Jan remains intact. Despite an additional 2.5 months of sideways consolidation, a large proportion of the market appears unwilling to spend and sell their coins, even if their coins are held at a loss. This suggests price insensitive HODLers hold much of the supply > $40k.
  • Green: Coins that have been redistributed at a profit since the $33k low appear to come mainly from dip buyers ($32k and $36k), as well as a sizeable volume of ~60k BTC from the $3k to $4k price range.
  • Red: pockets of redistribution at a loss have occurred as buyers who purchased after the Nov ATH realised that the dip was not over, and realised losses on the way down.

The overall takeaway observation is that the pattern of both profits and losses realised over the last 2.5 months suggest that investors continue to see the $35k to $42k range as a value zone for accumulation.

Live Chart

We define the threshold between Short and Long-Term Holders as 155-days, which at the time of writing, is positioned just after the Nov ATH. In simple terms:

  • Almost everyone who purchased after the ATH is a Short-Term Holder. This cohort is the most likely to spend their coins in reaction to market volatility.
  • Almost everyone who purchased before the ATH is a Long-Term Holder. This cohort are the least likely to spend their coins, preferring to accumulate in anticipation of the next macro bull market.

The chart below presents the current volume profile, however broken into LTH (blue) and STH (red) cohorts. We can draw the following conclusions:

  • Short-Term Holders (red): Very few remain between $50k and $60k, suggesting most 'top buyers' have likely already capitulated. Conversely, a huge amount of new STH demand is clustered between $38k and $50k, affirming that investors continue to see value in this price range (new buyers).
  • Long-Term Holders (blue): LTHs currently hold 15.2% of the coin supply at a loss, with coins held even at prices above $60k. These investors have weathered significant volatility, yet continue to hold. This supports the notion that these investors are a relatively price insensitive bunch, and remain the least likely to exert sell-side pressure.
An unreleased metric from the Glassnode Engine Room

Historic Growth in Unrealized Losses

Now that we have profiled the various price ranges that investors hold their coins, we can dive deeper into the potential risk profile of additional sell-side pressure. The chart below presents the proportion of coins held by LTH (blue) and STH (red) that are at a loss.

We can see an approximately even split of 15.2% LTH : 15.0% STH, with a total of 30.2% of the coin supply held in loss.

The current market profitability is significantly better off than it was in the 2018 or 2020 bear markets. Back then, LTHs alone held more than 35% of the coin supply at loss. Furthermore, we can see a macro increase in coins held by the less price sensitive LTHs (black arrows). This is the result of accumulation and LTHs making value acquisitions, whilst also being willing to weather any price drawdowns that follow.

We can however see that compared to the May-July 2021 period, market profitability is in a worse position, with LTHs in particular holding significantly more supply at a loss compared to this period.

Live Chart

We can construct an oscillator (Z-Score) for the rate of change for LTH coins held in loss. Here, we are attempting to see how quickly the profitability of the market is changing.

In simple terms:

  • This oscillator will be positive when lots of LTH coins are returning to profit. This will be the result of prices rallying, after heavy LTH accumulation.
  • This oscillator will be negative when lots of LTH coins fall into a loss. This will be the result of prices falling, and LTHs being caught by surprise by a correction.

What we can see is that the recent correction pushed a historically significant volume of LTH coins into an unrealised loss. This means that the amount of buying between August and November, which has now become underwater HODLing, is some of the most significant of all time.

Lots of LTHs were caught off-side by this correction. Previous instances of such high readings have usually been in late stage bear markets, most of which preceded a final capitulation shake-out event.

Live Workbench Chart

If we shift our focus to the Short-Term Holders, we can see a similar pattern is in effect. The massive positive value reached in October is very similar to the 2019 rally, where a large proportion of the market returned to profitability in a relatively short timespan (A).

What followed in both instances (B) was a long and painful drawdown that plunged all buyers who believed the bear market was over, back into an unrealized loss. Both the 2019, and current bear market trends are historically significant by this metric.

The takeaway from this study is that a historically large volume of investors who were active between August 2021, and January 2022 have seen the market price plunge below their cost basis, which has catalysed a large scale redistribution of the Bitcoin supply to new hands.

Live Workbench Chart

Have We Capitulated Yet?

The notion of an investor capitulation is widely understood and talked about in markets, and they usually precipitate the end of a bear market trend. Capitulation events are typically characterised as a complete and total loss of confidence, large scale sell-pressure, and high volume, that effectively exhausts any and all remaining bears from the market.

To quickly recap so far, we have established:

  • A great majority of investors who currently hold coins purchased above $40k are Long-Term Holders (pre-ATH), and have weathered significant volatility. This suggests they are price insensitive HODLers, and less likely to apply sell-side pressure.
  • The majority of Short-Term Holders who purchased after the ATH, and above $50k have already capitulated and redistributed their coins. This sell-side is largely exhausted.
  • Investors continue to see value between $35k and $42k, with accumulation trends remaining very constructive in this region, albeit lacking the momentum to break higher (or lower) just yet.
  • The rate at which both LTH and STH coins fell into an unrealized loss during this correction has been historically significant, suggesting the confidence and conviction of Bitcoin investors has been thoroughly tested.

The question now becomes, with such significant financial pain already weathered by the market, what will it take to precipitate a final capitulation flush out?

If we look at the rate of decline of the Short-Term Holder realized cap (cost basis, Z-Score), we can see that it has fallen by yet another historical margin. The magnitude of STH realized losses has only been at a similar magnitude twice in the past, both occurring in the worst phases of the 2018 bear market.

By this metric, a STH capitulation has already occurred, and it is twice as severe as during the July 2021 bottom at $29k.

Live Workbench Chart

And finally, when we perform the same study for Long-Term Holders, we see something even more impressive. The degree to which the Long-Term Holder realized price (currently trading at $14.6k) has declined is the deepest in history, and is without an equal.

There are only three mechanisms by which the LTH realized cap can decline:

  1. Large volumes of coins are crossing the 155-day age threshold, and have a much lower acquisition price than the aggregate. This is common after periods of heavy accumulation. Given the 155-day threshold is at the November ATH, this mechanism cannot be the primary contributor as coins maturing of late will have much a higher cost basis than $14.6k.
  2. Existing LTHs are adding to their balance at prices that are lower than their personal average cost basis. This is a plausible mechanism for class of 2021 LTHs whom have a cost basis > $40k. However, this mechanism is a weak contributor given the aggregate LTH Realized price is much lower at $14.6k.
  3. LTH held coins that were held at a cost basis much higher than the aggregate ($14.6k) are capitulating. They are leaving the LTH cohort, and redistributing their coins to new STH buyers. This effectively removes high cost basis coins from the aggregate, giving coins with much cheaper cost bases (such as coins from previous cycles) more weight.

Point 3 is by far the most probable mechanism, signalling that many LTHs who were caught by surprise by the current correction, have now capitulated out of the market...right into the hands of buyers who see value between $35k and $42k.

Live Workbench Chart

Summary and Conclusions

The Bitcoin market is global, and trades 24/7, making it highly responsive to macroeconomic conditions, shocks, and correlation to traditional assets like equities and bonds. With the current environment having its fair share of headwinds, analysis of Bitcoin market participants on-chain can provide insight into the sentiment and decisions of a cohort of contrarian investors.

What we have seen over the last 5-months is a 50%+ correction that appears to have significantly reshuffled the ownership structure of BTC. A great many Long-Term Holders with coins above $50k appear completely unfazed, whilst others have been totally shaken-out, at a historically significant rate.

Many investors are awaiting a complete and total capitulation of of the market, which may well be around the corner given the volume of coins held at a loss, and weak price structure. However under the surface, it appears as though a huge swathe of the market has already capitulated, in a statistically significant manner, and a resilient inflow of demand between $35k to $42k range has quietly absorbed this sell-side in its entirety.


Product Updates

All product updates, improvements and manual updates to metrics and data are recorded in our changelog for your reference.

  • Feature Release: Workbench Charts are now available in Dashboards
  • Bug Fix: Fixed bybit related futures perpetual metrics. Previously we were not properly dividing these between futures and perpetual contracts.
  • Uncharted Newsletter Edition #13 released.

Disclaimer: This report does not provide any investment advice. All data is provided for information purposes only. No investment decision shall be based on the information provided here and you are solely responsible for your own investment decisions.