Rate Hikes Drive Markets Lower

Bitcoin bulls remain under pressure this week, as prices fall back to $33.8k, and network profitability falls by ~10%. Weakness has appeared across ETF product flows, stablecoin supply contraction, and in investor urgency to deposit coins to exchanges, largely in response to downside volatility.

Rate Hikes Drive Markets Lower

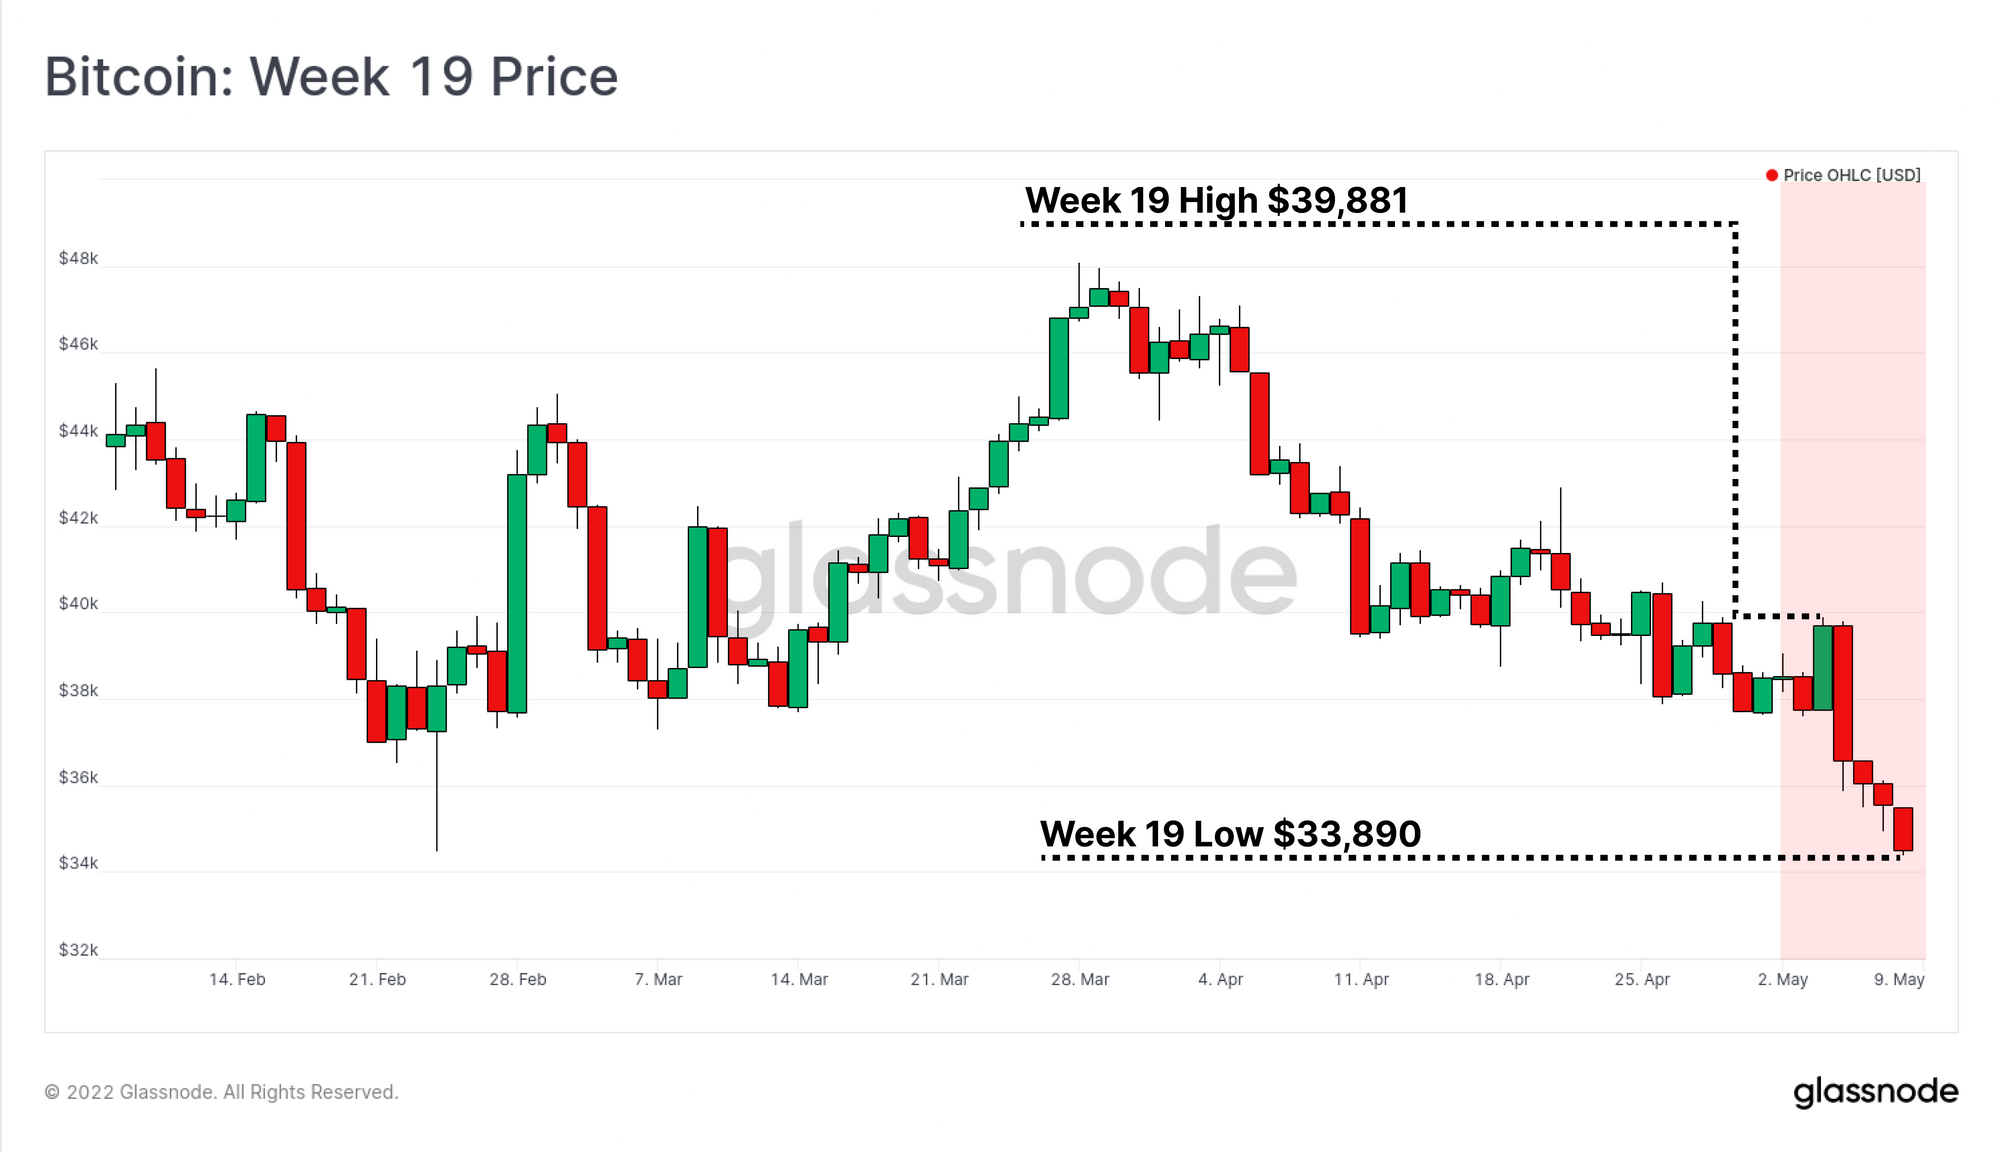
Markets experienced high volatility and further downside this week, as the market responded to the Federal Reserve's decision to hike rates by 0.5%. Markets initially responded well to the news on Wednesday, with Bitcoin rallying to the weekly high of $39,881. However, the positive momentum was short-lived, with markets selling off heavily on Thursday, and Bitcoin trading down -13.8% to close the week at $33,890.

In this edition, we will first assess the state of network profitability, and how it has changed relative to the 'bear market pain threshold' case study we proposed last week. Then we will take a holistic view and observe the market reaction to the recent price weakness across a number of market sectors:

  • On-chain transaction space and urgency in the mempool.
  • Exchange inflow and outflows as a gauge for capital flows.
  • Futures markets and liquidations to assess deleveraging risk.
  • Fund flows into exchange traded ETFs in Canada.
  • The first major stablecoin supply contraction in recent years.

Translations

This Week On-chain is now being translated into Spanish, Italian, Chinese, Japanese, Turkish, French, Portuguese, and Farsi.

The Week Onchain Dashboard

The Week Onchain Newsletter has a live dashboard with all featured charts available here. This dashboard and all covered metrics are explored further on our Video Report which is released on Tuesdays each week. Visit and subscribe to our Youtube Channel, and visit our Video Portal for more video content and metric tutorials.


Bitcoin Bulls Under Pressure

As Bitcoin prices trade lower, the bulls remain under serious pressure to establish a floor of support, as network profitability continues to decline. The Bitcoin market is now -49.5% below the November all-time-high.

Whilst this represents a significant drawdown, it remains modest when compared to the ultimate lows of prior Bitcoin bear markets. July 2021 reached a drawdown of -54.2%, and the bear markets of 2015, 2018 and March 2020 capitulated at lows between -77.2% and -85.5% off the ATH.

Live Chart

In last weeks edition, we established a potential case study for a further decline of 10% in overall network profitability (defined as a drop in the percent of addresses, entities and/or supply in profit). In that case study, we estimated that prices would need to fall to around $33.6k to reach a similar 'pain threshold' to previous bear markets, and drop overall profitability to around 60% of the network.

As prices hit $33.8k week, we have now seen this scenario largely play out, and an additional 10% of the Bitcoin network did indeed fall into an unrealized loss. All three metrics declined from ~72% to between 60% and 62% in profit. These levels are coincident with profitability seen in the late-2018, and late 2019-20 bear markets. However it should be noted that both instances were prior to the final capitulation flush out event.

As such, further downside remains a risk, and would be within the realm of historical cycle performance.

Live Workbench Chart

Given these three metrics tend to move in tandem, we can calculate a simple change in the average network profitability over the 30-days. This provides us with an indication of the rate of change in 'financial stress' for Bitcoin investors. Over the last month, the percent of the Bitcoin network that has fallen into an unrealized loss is 15.5% on average.

This decline in profitability is the fourth most severe over the last 3-years. This is compared with July, and December 2021, which both saw profitability declines of -18.1% to -19.1%. March 2020 remains the the most significant in recent history, with -35.4% of the Bitcoin network falling into the red over just a few days.

Live Workbench Chart

The On-chain Reaction

Bitcoin markets have become increasingly dynamic over the recent years, with a holistic analysis now requiring a view of on-chain coin movements, exchange related volumes, off-chain investment vehicles (e.g. ETFs, ETPs), derivatives markets, and stablecoins. With this in mind, we will now assess the market reaction across these various venues.

The Bitcoin accumulation trend score indicator has seen a notably softer month, returning values less than 0.2 since mid-April. This generally signals more distributive behaviour, and less accumulation has been in play, and is coincident with weaker market prices.

Live Chart

We can further dissect this into wallet cohorts, where we see that across the board, most wallet cohorts from shrimp to whales, have greatly softened in their onchain accumulation trends. Very large entities with balances > 10k have been a particularly significant distributive force over the last few weeks, as can be seen by the large red values returned. Smaller investors (< 1BTC) are the strongest accumulators, however their accumulation is notably weaker than it was in February and March.

Unreleased metric from the Glassnode Engine Room

During times of volatility and market stress, it is typical to see an influx of 'urgent' transactions enter the Bitcoin mempool, as investors seek to de-risk, sell, or re-collateralise their margin positions. As the market sold off this week, we did see an burst of 42.8k transactions enter the Bitcoin mempool. This is the highest influx in transaction activity since mid-October 2021 (when we started tracking mempool activity).

Live Chart

We can also see that there was a high degree of urgency associated with these transactions, as the total value of all on-chain transaction fees paid reached 3.07 BTC. This is higher than was seen during the 4-December deleveraging event, at which time the market dropped -34.5% in one day (covered in Week 49, 2021), and is again the largest value in our data-set to date.

Live Chart

The dominance of on-chain transaction fees associated with exchange deposits also signalled urgency, reaching the second highest value in history. This further supports the case that Bitcoin investors were seeking to de-risk, sell and/or add collateral to margin in response to market volatility.

15.2% of all on-chain transaction fees paid were associated with exchange deposit transactions, which is higher than the at the apex of the 2017 bull-run (12.1%), and surpassed only by the May 2021 sell-off (16.8%).

Live Chart

On any given day, large volumes of BTC flow both into, and out of exchanges. Exchange flows of well over $750M (in both directions, $1.5B+ total) have been a typical lower bound for the 2021-22 market cycle.

During the sell-off this week, over $3.15B in value passed in or out of exchanges, with a net bias towards inflows, which accounted for $1.60B (50.8%). This is the largest aggregate exchange related volume peak since the market was made all-time-highs in Oct-Nov last year. It is also equivalent to the inflow/outflow levels at the 2017 bull market peak.

The scale of recent history, when compared to last cycle, demonstrates just how much larger typical USD denominated capital flows are across the Bitcoin network.

Live Workbench Chart

Assessing the Off-chain Response

As noted above, the Bitcoin market has become increasingly dynamic, requiring a view of both on-chain and off-chain dynamics to establish likely drivers of price movements, market momentum, and investor sentiment.

Over the last two years, numerous spot ETF products have come to market, with three of these investment vehicles trading on Canadian exchanges. Whilst inflows to these products have generally been strong since November, the last two weeks have seen this trend reverse significantly.

On a 7-day change basis, over 6.66k BTC has flowed out of these instruments per week, which has largely corresponded with recent weakness in price.

Live Workbench Chart

In the derivatives space, Futures Open Interest has been relatively quiet given the magnitude of volatility this week. In the days leading up to the Federal Reserve announcement of rate hikes, approximately $1B in open interest entered Bitcoin futures markets.

However, much of this leverage was quickly closed out, and total open interest actually stabilised after the sell-off on Thursday, holding at around $14.3B.

Live Chart

We can see the initial whipsaw action leading up to the Federal Reserve announcement in the 1-day change of futures open interest. Open interest increased by a total of 30.4k BTC on 3-May, before 25.48k BTC in value was closed out the following day.

Whilst these values are non-trivial in size, they remain relatively small in comparison to the major deleveraging events over the last 12-months. As such, it appears less likely that excessive futures leverage was a core driver of price action this week.

Live Chart

We can add further confidence to this assessment by looking at the total liquidations occurring in futures markets. Generally speaking, during a futures market deleveraging event, we expect a large relative volume of positions being forced closed via liquidations.

However this week, at the peak of the sell-off, a maximum value of $135M in futures positions were liquidated. This represents less than 0.2% of traded futures volume. As expected, long positions took the brunt of the damage, with a 61.5% dominance of all positions liquidated. Overall, it seems that much of the recent weakness in price action is driven more by poor investor sentiment, capital outflows, and de-risking, rather than a futures driven de-leveraging.

Live Chart

Lastly, to establish a gauge on capital flows into the market, we can look to the stablecoin market. Stablecoins have been one of the primary areas of explosive growth in the industry over the last few years, and represent a primary vehicle for capital inflow and outflow.

Since the March 2020 sell-off, the aggregate supplies of the major stablecoins (USDT, USDC, BUSD and DAI) has increased from $5.33B, to over $158.25B. This is an astonishing growth of 2,866% in just over two years. USDT remains the dominant asset, accounting for 52.6% of the major supplies, and is followed by USDC at 30.8% dominance.

However since the start of April, the aggregate stablecoin supply has plateaued, and now contracted by $3.285B. This is coming off an ATH supply of $161.53B. The majority of stablecoin redemption are being driven by USDC which has declined by $4.77B since the start of March. USDT on the other hand has seen its supply continue to expand, increasing by $2.50B over the same period.

Live Workbench Chart

The chart below shows the 30-day change in aggregate stablecoin supply (blue) alongside the contribution by USDC (red).

It can be seen that particularly since May 2021, USDC has been a major contributor to total stablecoin supply growth. We can also see that this recent stablecoin supply contraction is a rare event, with the total supply contraction hitting a rate of -$2.9B per month. USDC is the primary stablecoin asset that is experiencing redemption, and this signals a degree of net capital outflow is occurring from the cryptocurrency industry at large.

Overall, there are a number of signals of net weakness in the space, many of which indicate that risk-off sentiment remains the core market position at this time.

Live Workbench Chart

Summary and Conclusions

As the Bitcoin market matures, and more institutional capital enters the space, it has become increasingly apparent that the market responds to macroeconomic shocks, and tighter monetary conditions. Wider markets responded in a volatile manner to the Federal Reserve announcement of further rate hikes, which whilst expected, does confirm increasingly tight liquidity across markets.

This week we sought to take a holistic view of the market, assessing the response both on- and off-chain. There appears to be aggregate weakness across almost all sectors, however it does appear to be primarily driven by poor investor sentiment, and a risk-off mentality, rather than a derivatives led deleveraging. Furthermore, a significant contraction in stablecoin supplies, particularly USDC, suggests capital a net outflow from the space is underway. This supports our recent observation of net capital outflows from derivatives markets as available yields compress towards 2% to 3%.

Bitcoin remains highly correlated to the broader economic conditions, which suggests the road ahead may unfortunately be a rocky one, at least for the time being.


Product Updates

All product updates, improvements and manual updates to metrics and data are recorded in our changelog for your reference.


Disclaimer: This report does not provide any investment advice. All data is provided for information purposes only. No investment decision shall be based on the information provided here and you are solely responsible for your own investment decisions.