A Bear of Diminishing Returns

Price performance over the last 12 months has been nothing short of lacklustre, putting a dent in long-term CAGR rates for Bitcoin and Ethereum. This is supported by a dwindling demand for both chains blockspace, as expressed in on-chain fee markets.

A Bear of Diminishing Returns

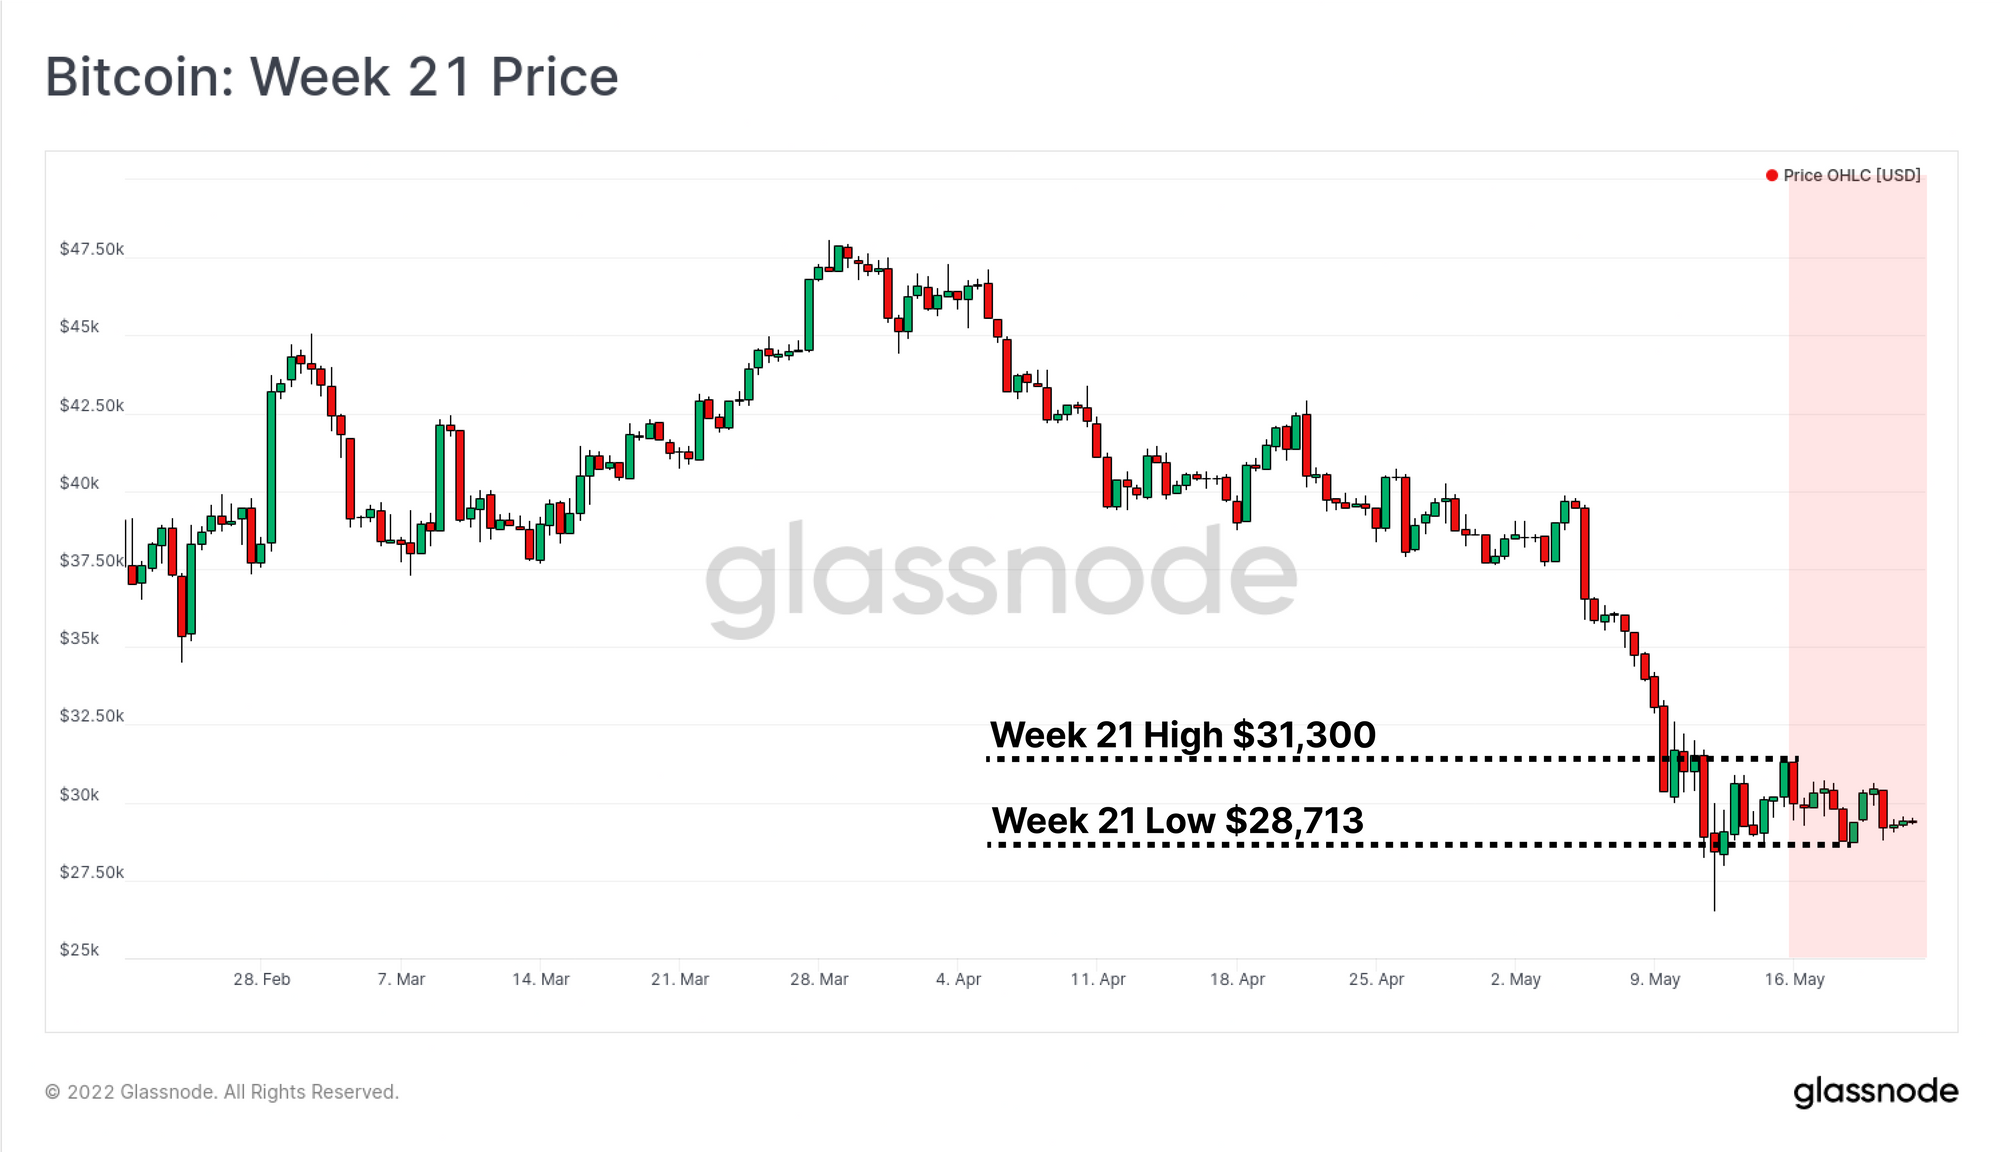
After the industry-wide sell-off alongside the collapse of LUNA and UST last week, markets have entered a period of consolidation. Bitcoin prices traded within a relatively tight range between a high of $31,300 and a low of $28,713.

The Bitcoin market has now traded lower for eight consecutive weeks, which is now the longest continuous string of red weekly candles in history. This week we will look towards the return profile on both a short-term (monthly) and long-term (4yrs) basis for both Bitcoin and Ethereum. From this, we can see that the current drawdown has put a notable dent in the market performance of the asset-class as a whole.

Furthermore, an assessment of derivative markets suggests fear of further downside remains the outlook, at least for the next three to six months. Looking on-chain, we can see that both Ethereum and Bitcoin blockspace demand has fallen to multi-year lows, and the rate of burning of ETH via EIP1559 is now at an all-time-low.

Coupling poor price performance, fearful derivatives pricing, and exceedingly lacklustre demand for block-space on both Bitcoin and Ethereum, we can deduce that the demand side is likely to continue seeing headwinds.


Translations

This Week On-chain is now being translated into Spanish, Italian, Chinese, Japanese, Turkish, French, Portuguese, Farsi, Polish, and Greek.

The Week Onchain Dashboard

The Week Onchain Newsletter has a live dashboard with all featured charts available here. This dashboard and all covered metrics are explored further on our Video Report which is released on Tuesdays each week. Visit and subscribe to our Youtube Channel, and visit our Video Portal for more video content and metric tutorials.


Are Returns for BTC and ETH Diminishing?

There has been a general consensus formed that with growing market valuation, the return profiles for Bitcoin can generally be expected to diminish. This reflects a number of factors that include (but not limited to):

  • Larger market sizes requiring more capital to move in either direction.
  • Introduction of institutional capital, more advanced trading strategies, and derivatives for hedging and capturing volatility.
  • Compression of information asymmetries, and a better appreciation of risk, performance, correlations and cycle behaviour.

Bitcoin has historically traded within an approximately 4yr bull/bear cycle, often associated with the halving events. The chart below plots out the rolling 4yr Compound Annual Growth Rate (CAGR) for Bitcoin.

We can now visualise this long-term compression of returns, with CAGR having declined from 200%+ in 2015, to less than 50% today. In particular, we can see the marked decline in 4y-CAGR following the May 2021 sell-off, which we have argued was likely the genesis point of the prevailing bear market trend.

Live Workbench Chart

In the shorter term, we can also see that the Monthly Return profile for Bitcoin has been underwhelming, with a negative performance of -30%. In effect, Bitcoin has lost 1% of its market value every day over the last month.

This negative return is now marginally worse than it was during the 4-Dec deleveraging, but not quite as severe as in May-July. Periods of time with monthly returns this lacklustre are relatively infrequent, however are almost always associated with high volatility drawdown events such as the beginning, and ends of bear markets.

Live Chart

We can see a very similar return profile for Ethereum over recent months, although with relatively poorer performance of -34.9%. This demonstrates that correlation of performance between these two assets remains strong, despite numerous differences in their fundamental properties.

Live Chart

Further to this, we can see an interesting coupling between Bitcoin and Ethereum CAGR performance, specifically during bearish trends. In the post March 2020 period of uncertainty, and again since the bear began in May 2021, the CAGR profiles of both assets have converged. Ethereum appears to also be experiencing a diminishing return profile over time.

ETH has generally outperformed BTC during bullish trends, however these divergences do appear to be getting weaker over time (lower upwards divergences). In more bearish trends, it can be seen that the ETH CAGR often tends to underperform BTC.

Over the last 12-months, the 4yr CAGR for both assets has declined from around 100%/yr to just 36%/yr for BTC, and 28%/yr for ETH, highlighting the severity of this bear.

Live Workbench Chart

Whilst Bitcoin remains the largest digital asset by market valuation, it exists within an ever evolving ecosystem of blockchains, coins, protocols, and tokens. Ethereum, being the second market leader for many years now, is often viewed as a bell-weather of market appetite for rest of the digital asset risk curve.

A popular tool for tracking this relative performance and sector rotation is 'Bitcoin Dominance'. The dominance variant below considers only the relative performance of Bitcoin and Ethereum Market Caps. This attempts to distil this macro 'sector rotation' into very specific large-cap relative performance metric. From this we can make a few observations:

  • Declining BTC Dominance Divergence (green arrows) is typical of early-mid stage bull markets, as investors start moving further out on the risk curve.
  • Rising BTC Dominance Divergence (red arrows) is typical of earlier stage bear markets where risk appetite declines, and Bitcoin tends to outperform.

In the current market, and following the Nov ATH, we have seen a developing divergence in favour of BTC dominance. Given the negative attention drawn to the digital asset risk curve by the collapse of LUNA and UST, this trend may be one to keep track of. It should be noted that Ethereum dominance has remained higher for longer relative to the 2018 bear market, suggesting an improved market appreciation of ETH with age and maturity.

Live Workbench Chart

Derivatives Expecting Further Downside

Moving over to the derivatives markets, we can see another coupling between BTC and ETH exists, this time in futures cash-and-carry yields. Throughout the 2020-22 cycle, an approximately equal 3M rolling yield could be obtained from both assets, with very few periods of divergence. This is another data-point suggesting traders are taking advantage of any and all yield available in the market, wherever liquidity and trade volume allow it.

At present, the 3M rolling basis yield is around 3.1% for both assets, which is historically very low. However, this is now higher than the US 10yr Treasury yield of 2.78%, which may start giving capital a reason to re-enter the space.

Live Workbench Chart

That said, options markets continue to price in near-term uncertainty, and downside risk, especially over the next three to six months. Implied volatility experienced a significant increase last week during the market sell-off. Short-dated at-the-money options saw IV more than double, from 50% to 110%, whilst 6-month dated option IV jumped to 75%. This is a break higher from what has been a long period of very low implied IV levels.

Live Chart

With such a heavy bear market in play, and with such poor price performance, it is no surprise that the market has a notable preference for Put options. The Put/Call Ratio for open interest has increased from 50% to 70% over the last two weeks, as the market seeks to hedge further downside risk.

Live Chart

Looking out to the end of Q2, we can see a heavy preference for Put options, with key strike prices of $25k, $20k, and $15k. The pool of open Call options is significantly lower, with open interest mostly concentrating around the $40k strike price.

This suggests that at least out to the middle of the year, the market has a strong preference for hedging risk, and/or speculating on further downside price action.

Live Chart

However on a longer-term basis, options open interest at the end of the year is notably more constructive. There is a clear preference for call options, with concentration around strike prices of $70k to $100k. Furthermore, the dominant put option strike prices are at $25k and $30k, which are at higher price levels than the mid-year.

Thus, based on the spread of options open interest, it appears that the market is quite uncertain about the immediate term (2-3months) in particular. Speculators do however seem to be taking advantage of lower implied volatility, and taking on a more constructive view out to years end.

Live Chart

On-chain Ghost-towns

Perhaps in strong confluence with the near term fear expressed in derivatives markets, the on-chain activity of both Bitcoin and Ethereum remains unimpressive. Ultimately, high demand for blockspace and utilisation of a network generally manifests as network congestion, and transaction fees spiking. Whilst Bitcoin did see a 2x bump in total fees paid last week during the volatility, it has been languishing around 10-12BTC per day since May 2021.

Note, we covered more of the nuance leading to a low Bitcoin on-chain fee regime in Week 15, although a lack of demand for blockspace remains a primary driver.

Live Chart

Despite having a fairly lively blockchain ecosystem, Ethereum too has seen blockspace demand dry up significantly. Whilst the network sports a great many applications, financial protocols, and tokens, mean gas prices on Ethereum have still fallen, now at just 26.2 Gwei.

With the exception of a few spikes during high profile NFT mints, and the sell-off last week, Ethereum gas prices have been in a structural downtrend since December. Mean gas prices this low are at levels coincident with the May-July 2021 lows, and the post March 2020 uncertainty period.

Live Chart

A knock on effect of lower demand for Ethereum blockspace is a net reduction in the number of ETH coins burned via the EIP1559 protocol implementation. After hitting an ATH of 38,940 ETH/day burned during the Bored Ape Yacht Club 'Otherside' NFT mint, the burn rate is now at an all-time-low.

This week, 2,370 ETH were burned, which is a 50% reduction compared to the start of May, and represents a burn rate of 18.4% of the minted supply (i.e. 81.6% of minted ETH is entering circulation). Whilst burning 18.4% is more than 0%, it is possible additional coins entering the supply, during weakened incoming demand can be a headwind for prices.

Live Workbench Chart

To close out on the relative demand for Ethereum blockspace, we can review the on-chain activity associated with popular DeFi tokens; AAVE, COMP, UNI and YFI. The charts below shows the number of active addresses interacting with these tokens, and the USD denominated volume transferred in each. These are relatively simple metrics and comparisons, however the relationships to price performance are quite apparent.

What we see is a strong correlation between on-chain activity and DeFi token price performance, and at present both remain fairly uninspiring across the board. There was a slight uptick in activity last week, but it remains to be seen if this is a reversal of trend, or a flash in the pan.

Live Dashboard

Summary and Conclusions

Bear markets can take their toll, and this particular bear has done just that. Until the market approaches some form of sustained bottom, bears usually get worse before they get better. What we have observed in the sections above is a relatively cohesive story of poor price performance, diminishing long-term returns, fear being priced into near-term derivative markets, and a side of lacklustre on-chain activity.

This effect is relatively universal across the digital asset market, with both Bitcoin and Ethereum seeing dramatically lower utilisation and demand relative to the bull market. For DeFi tokens, even more so. There are signals that internal capital rotation is towards BTC at this time, perhaps punctuated by the LUNA and UST collapse last week. Such a rotation is a historical characteristic of bear markets, as investors move towards perceived safer assets.

With that said, the last 12-months of price performance of the industry relative to the US Dollar remains unfortunate, and this bear has made a non-trivial dent in long-term return profiles.

Nevertheless, bear markets do have a way of ending, perhaps just not right now. As the saying goes however, 'bear markets author the bull that follows'.


Product Updates

All product updates, improvements and manual updates to metrics and data are recorded in our changelog for your reference.


Follow us and reach out on Twitter

Disclaimer: This report does not provide any investment advice. All data is provided for information purposes only. No investment decision shall be based on the information provided here and you are solely responsible for your own investment decisions.