Is Bitcoin Back?
After one of the least volatile months in history, Bitcoin has seen an explosive rally back above $21k. This puts the average BTC holder, and mining operation back into the black, making this rally stand out from all those seen in 2022.


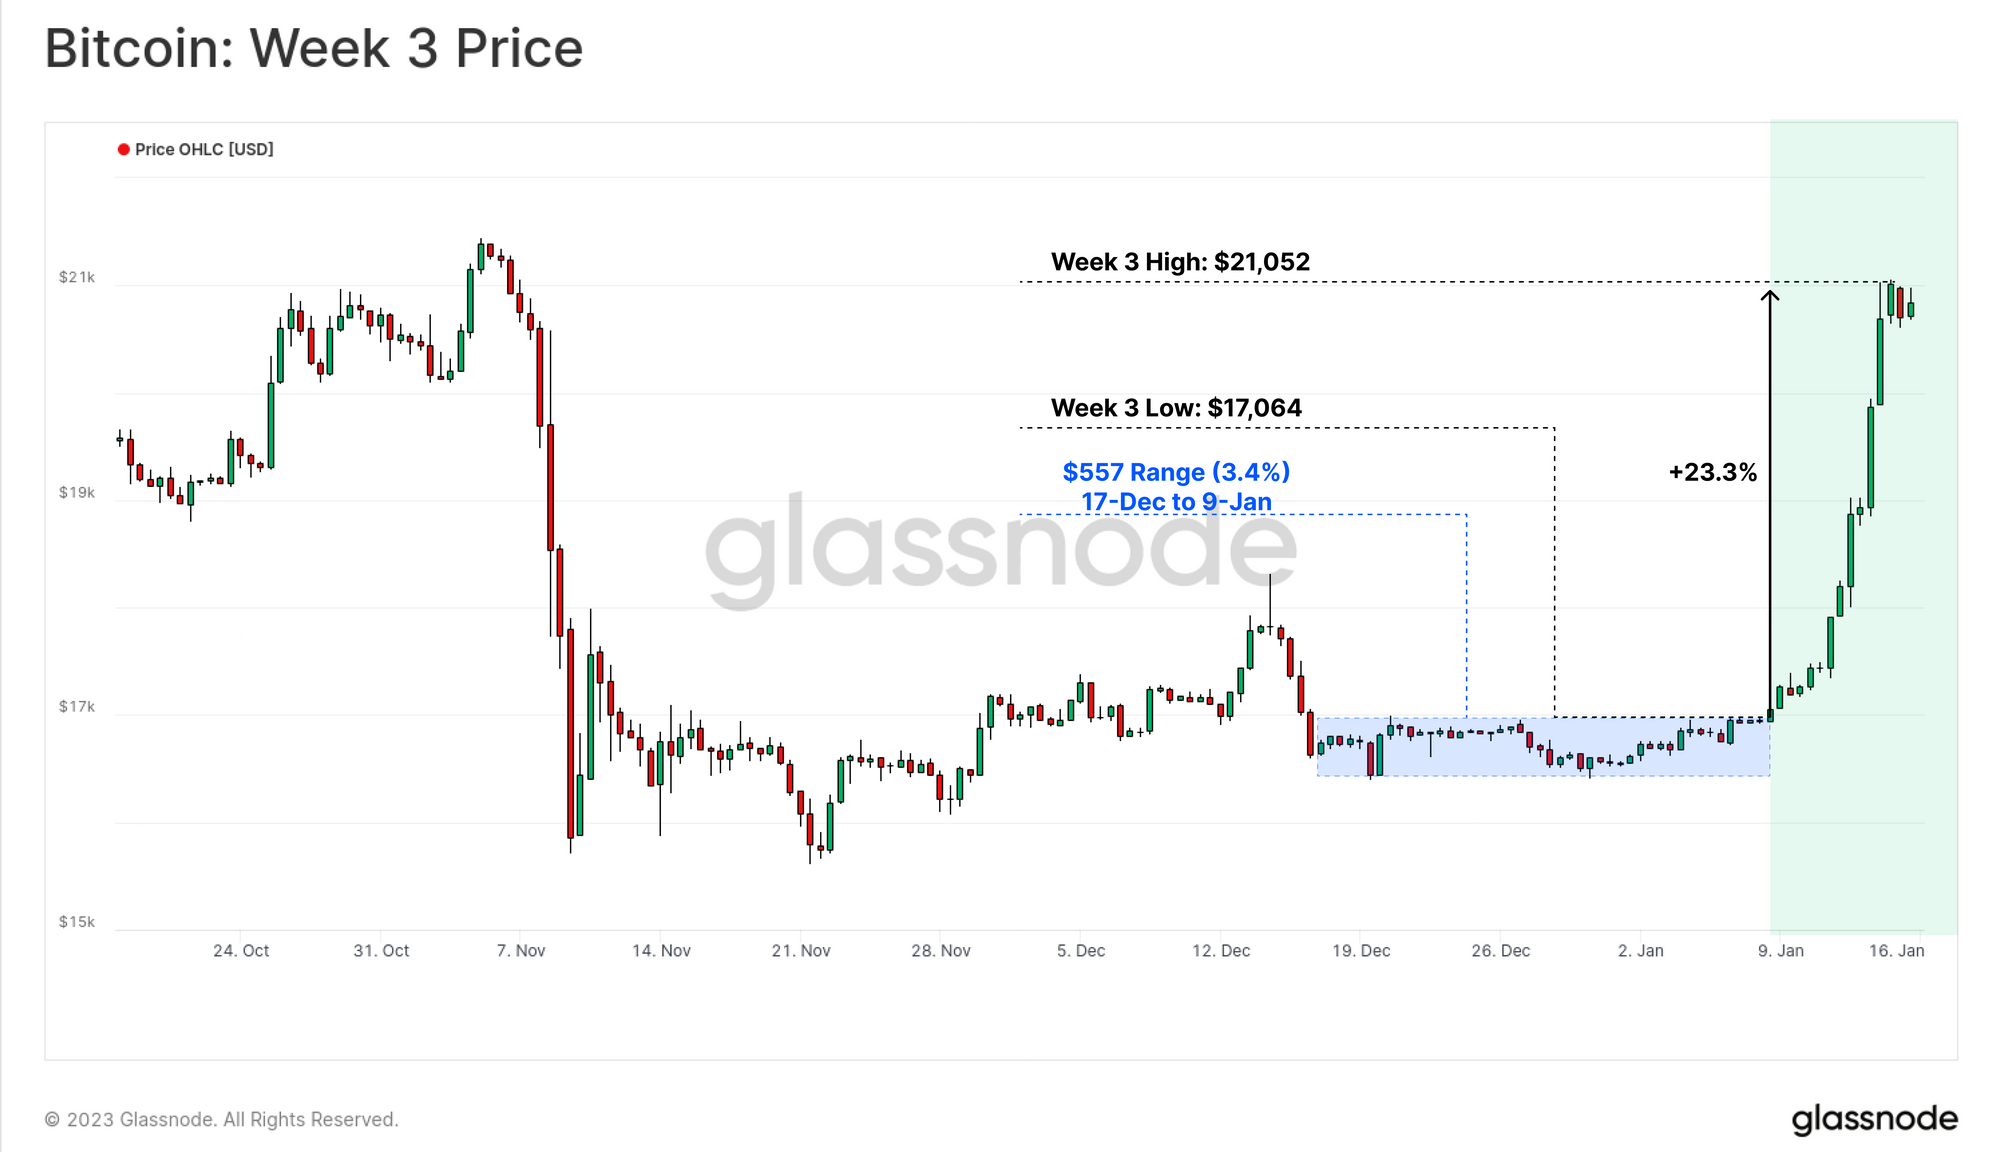
After one of the least volatile periods in Bitcoin history (WoC 2), the market pulled off a remarkable and explosive 23.3% rally this week. BTC prices rallied from a weekly low of $17k to over $21k, breaking through several widely observed technical and on-chain pricing models. Many of these models tend to act as significant psychological resistance levels during bear markets, which makes this particular event noteworthy.
In this edition, we will cover a variety of pricing models that seek to describe Bitcoin price action, and the underlying fundamentals, including:
- Key technical and on-chain levels, such as the 200D-SMA, and the Realized Price for various investor cohorts.
- Estimated points of stress for the average miner, potentially signalling a reduction in acute income stress for the industry.
- Fair value models based on network volume throughput, which attempt to gauge an implied value based on settlement activity.
- Recovery of short term realized profits, which have historically shown to be a key indicator of shifting investor behavior patterns.
🪟 View all charts covered in this report in The Week On-chain Dashboard
🔔 Alert Ideas presented in this edition can be set within Glassnode Studio.
️🏴☠️ The Week On-chain is translated into Spanish, Italian, Chinese, Japanese, Turkish, French, Portuguese, Farsi, Polish, Arabic, Russian, Vietnamese and Greek.
📽️ Visit and subscribe to our Youtube Channel, or visit our Video Portal for more video content and metric tutorials.
Back in the Black
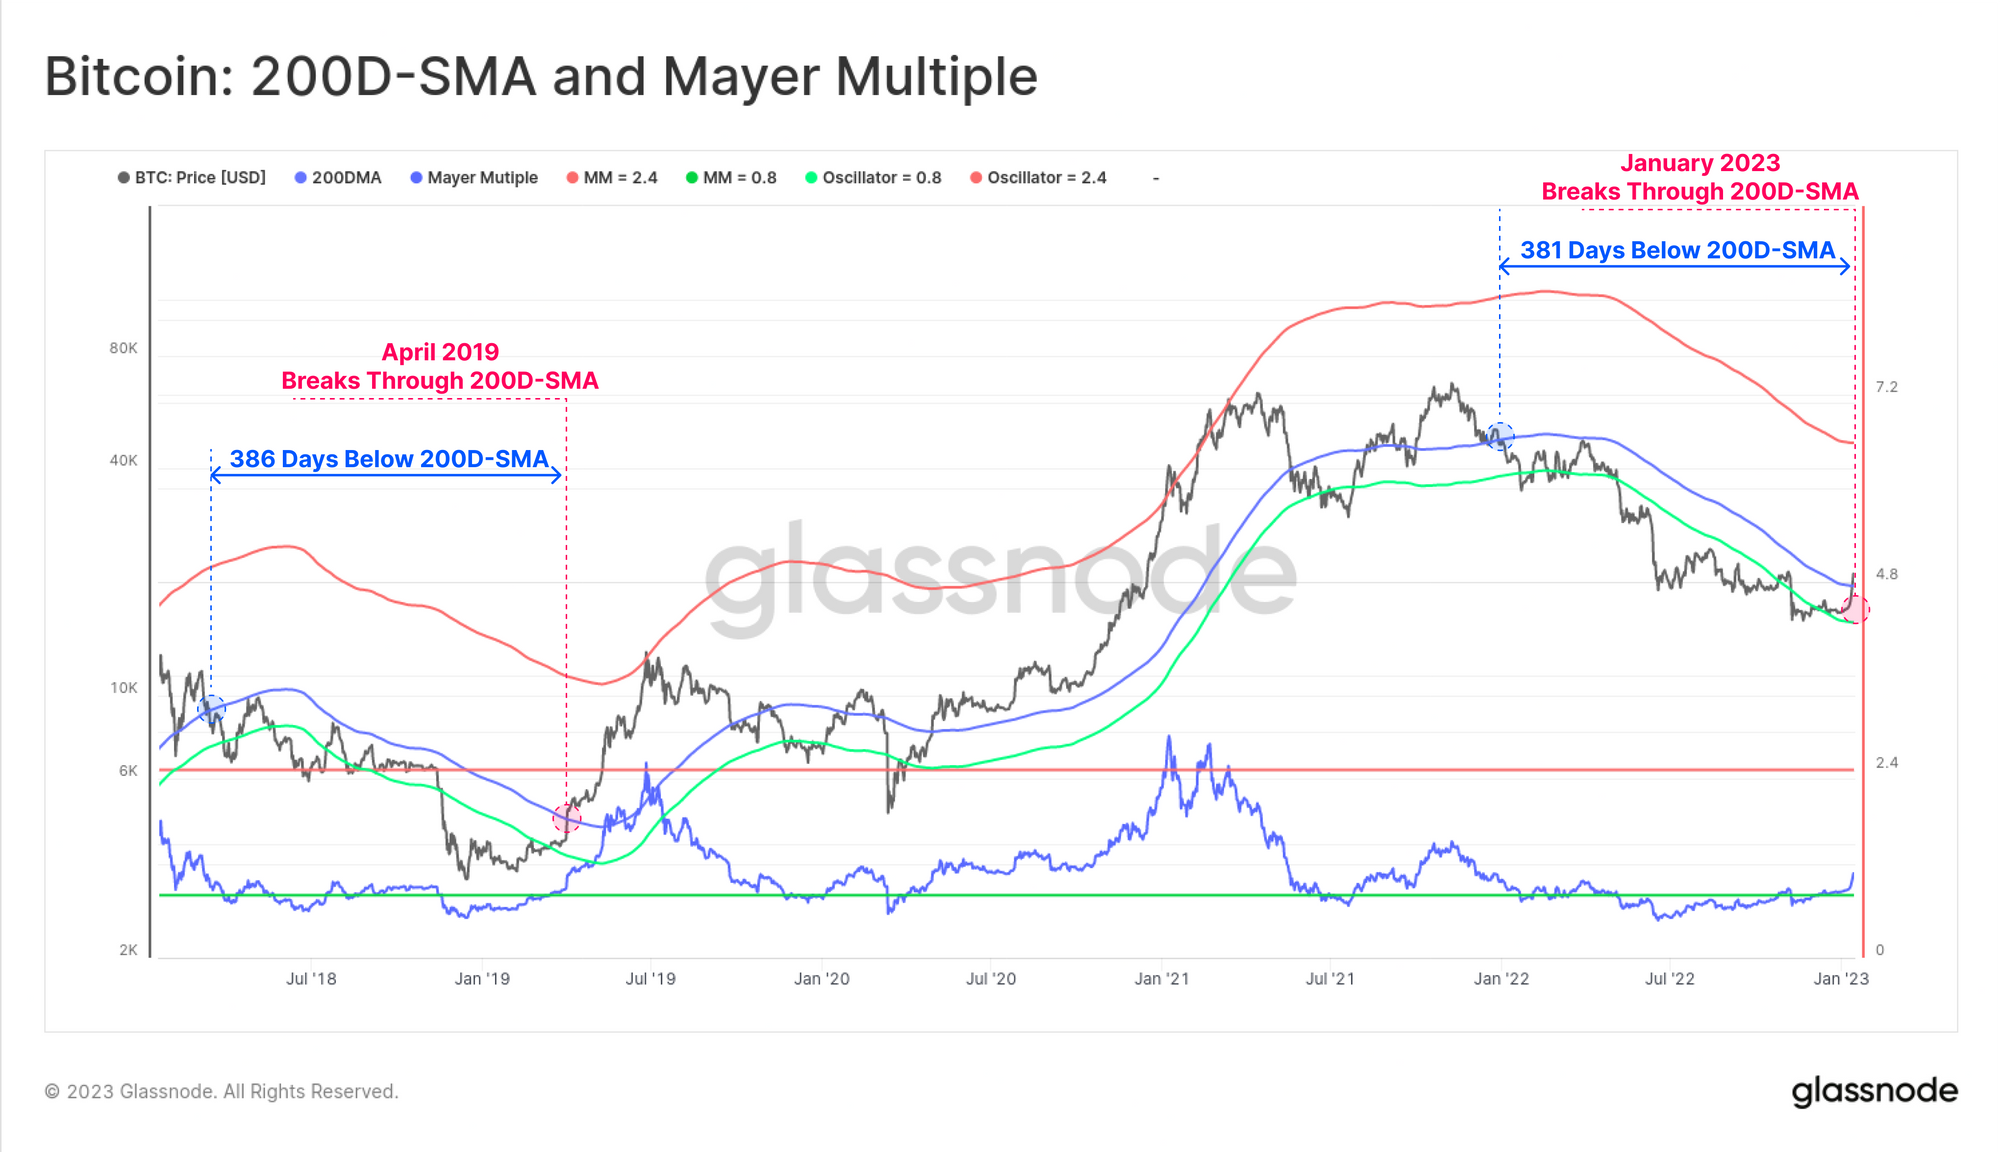
The 200D-SMA remains one of the most widely used technical analysis tools across all asset classes, often finding application as a litmus test for macro market trends. This has proven true over the years for Bitcoin, where a simple check of whether price is above or below the 200D-SMA tending to correlate with a macro bullish, or bearish trend, respectively.
With this weeks powerful rally, the market overcame this psychological level at $19.5k. Bitcoin markets often express a strangely consistent cyclical behavior, with this cycle trading below the 200D-SMA for 381-days, which is just 5-days shy the 2018-19 bear market at 386-days.
🔔 Alert Idea: Price breaking below $19.5k would reflect a fall back below the 200D-SMA, which may indicate market weakness worth paying attention to.
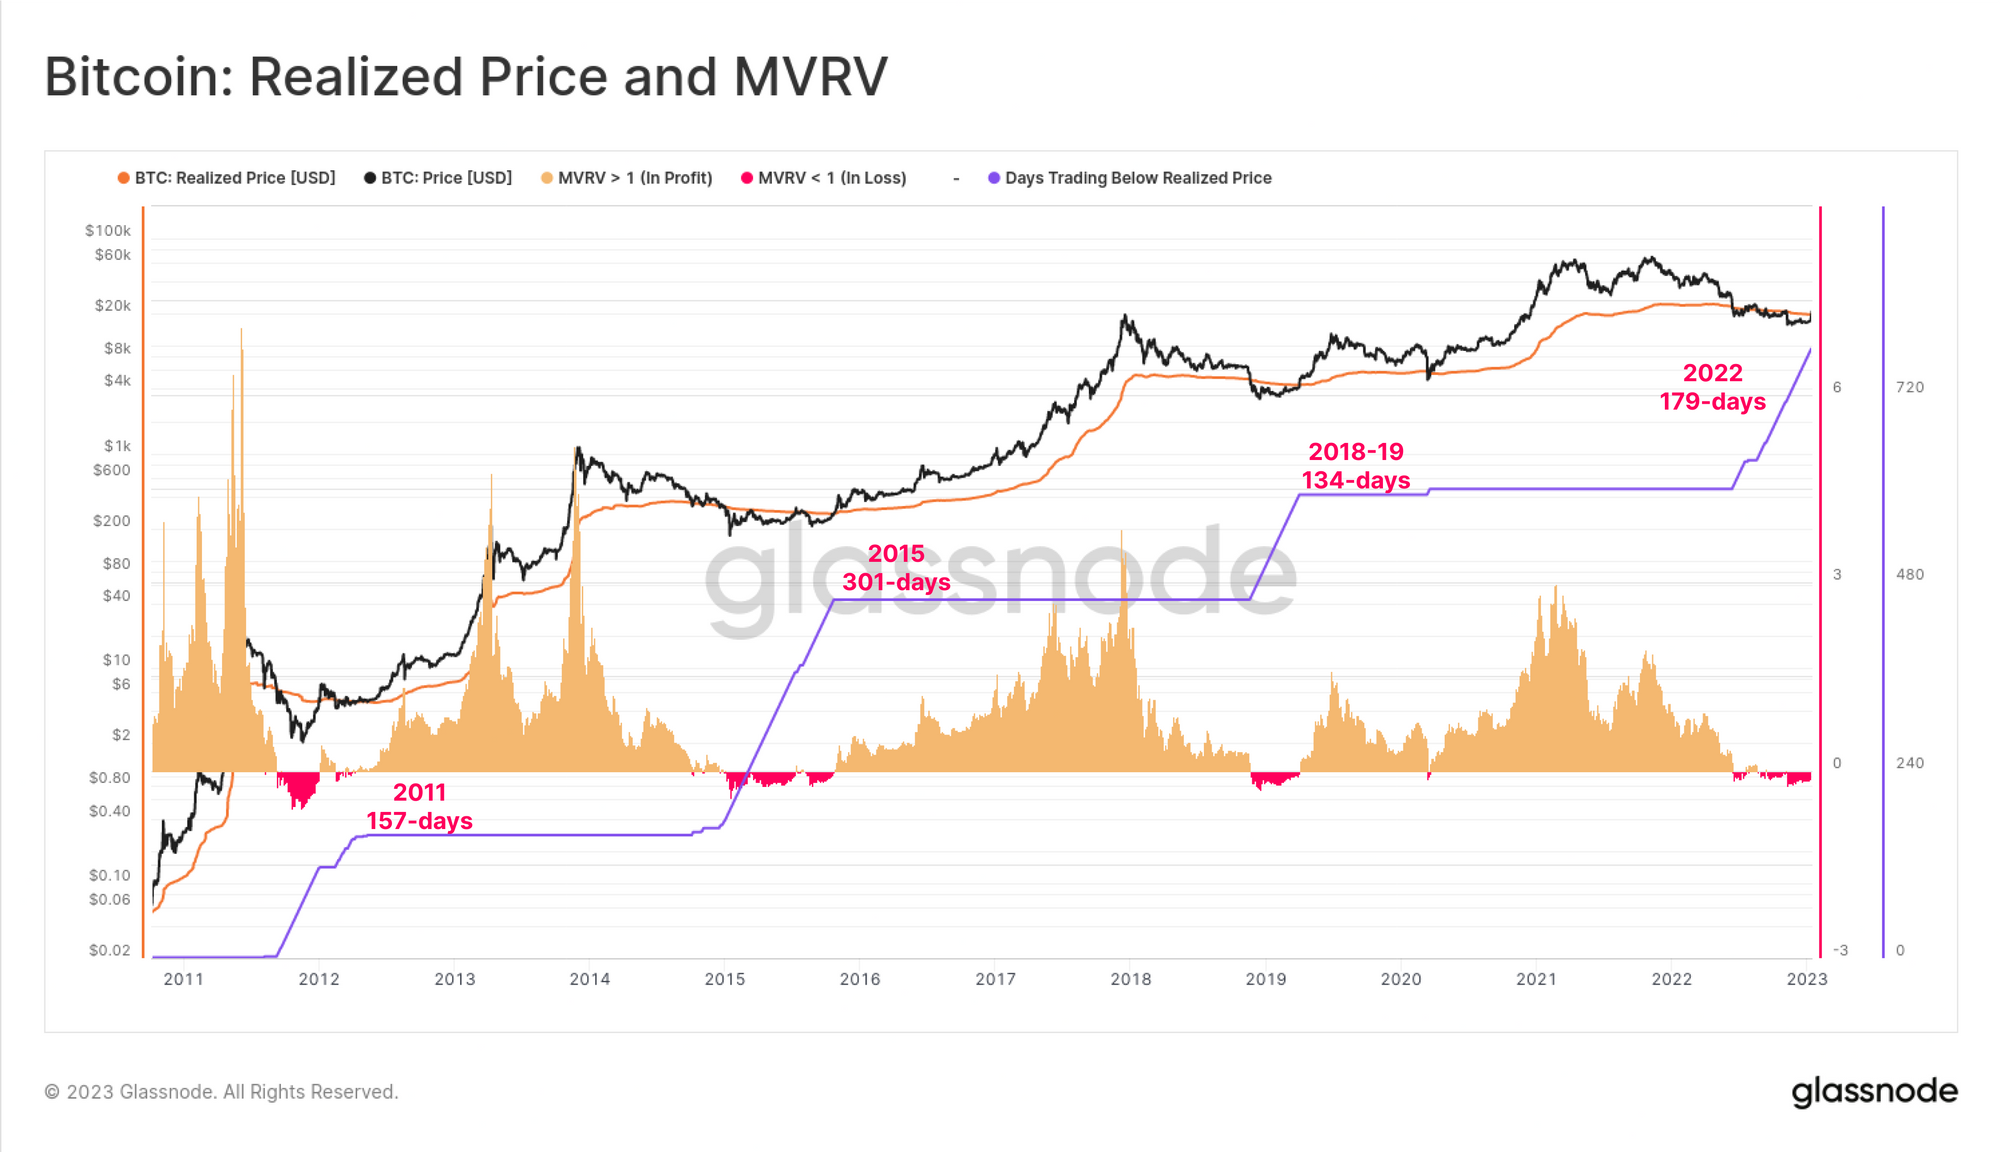
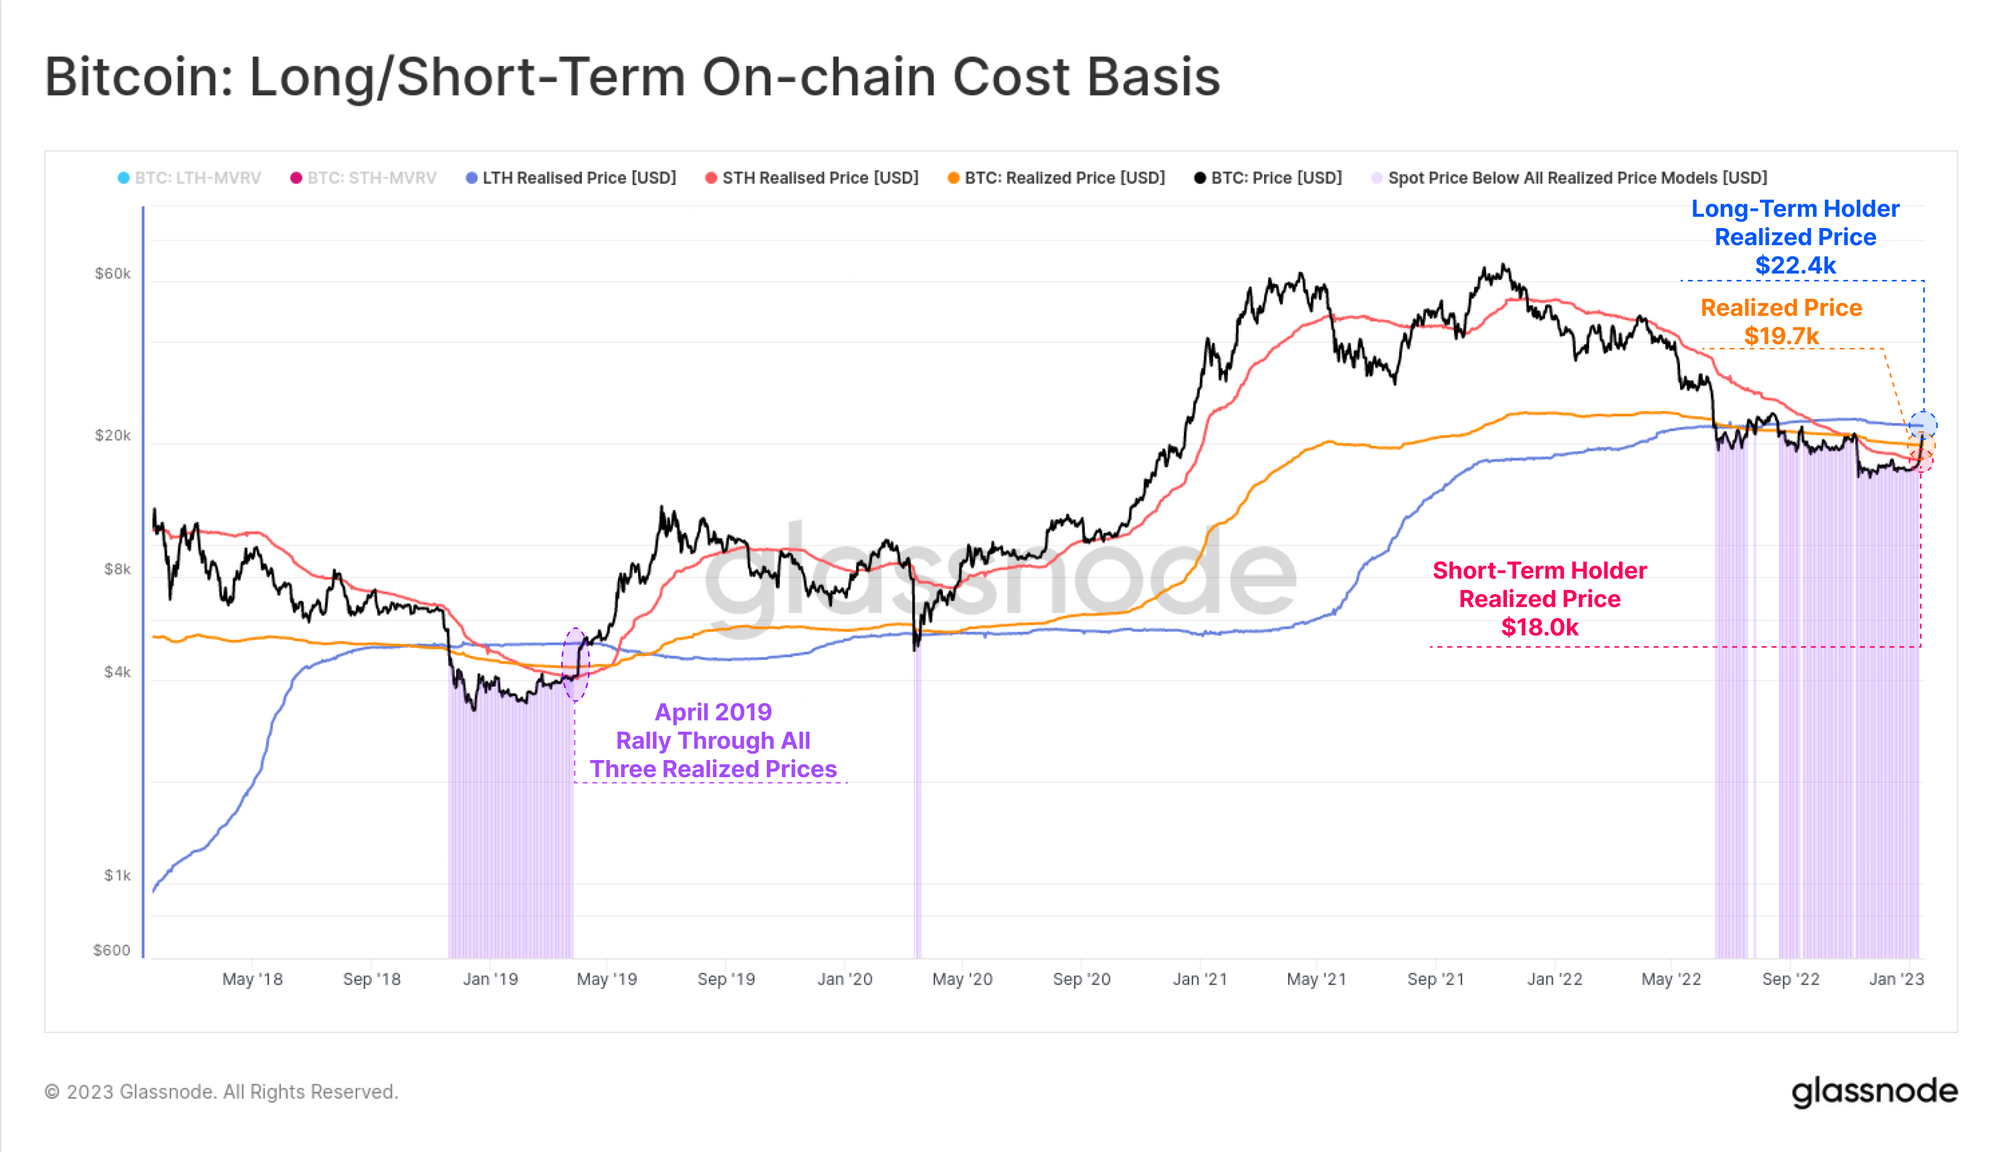
Sitting just above the 200D-SMA was the Realized Price at $19.7k. Within the world of Bitcoin, this psychological cost basis model is also widely observed. With prices now convincingly above this price model, it indicates that the average BTC holder is back in a net unrealized profit.
To date, the 2022-23 bear market has spent 179-days below the Realized Price, making it the second longest duration across the last four bear cycles.
The chart below presents three variants of the Realized Price, split into cohorts:
- 🔴 Short-Term Holder Realized Price ($18.0k), the average of coins that changed-hands in the last 155-days.
- 🟠 Realized Price ($19.7k), being the average of all coin holders.
- 🔵 Long-Term Holder Realized Price ($22.4k), the average of coins which have been held for at least 155-days.
There are several key observations from this model:
- There is a notable similarity in market strength to that observed in April 2019, albeit the current market is yet to breach the LTH-Realized Price.
- In both the 2018-19 and 2022-23 bear markets, all three realized prices converged, indicating a return to a homogeneous holder base (where the average BTC holder carries an approximately equivalent cost basis, regardless of holding time).
- The Short-Term Holder Realized Price is lower than the others, reflecting a major capitulation style event after FTX collapsed, indicating a significant volume of coins changed hands afterwards.
🔔 Alert Idea: Price breaking above $22.4k would reflect a rally above the LTH-Realized Price, putting the average holder in all cohorts back into profit.
Estimating Fair Value
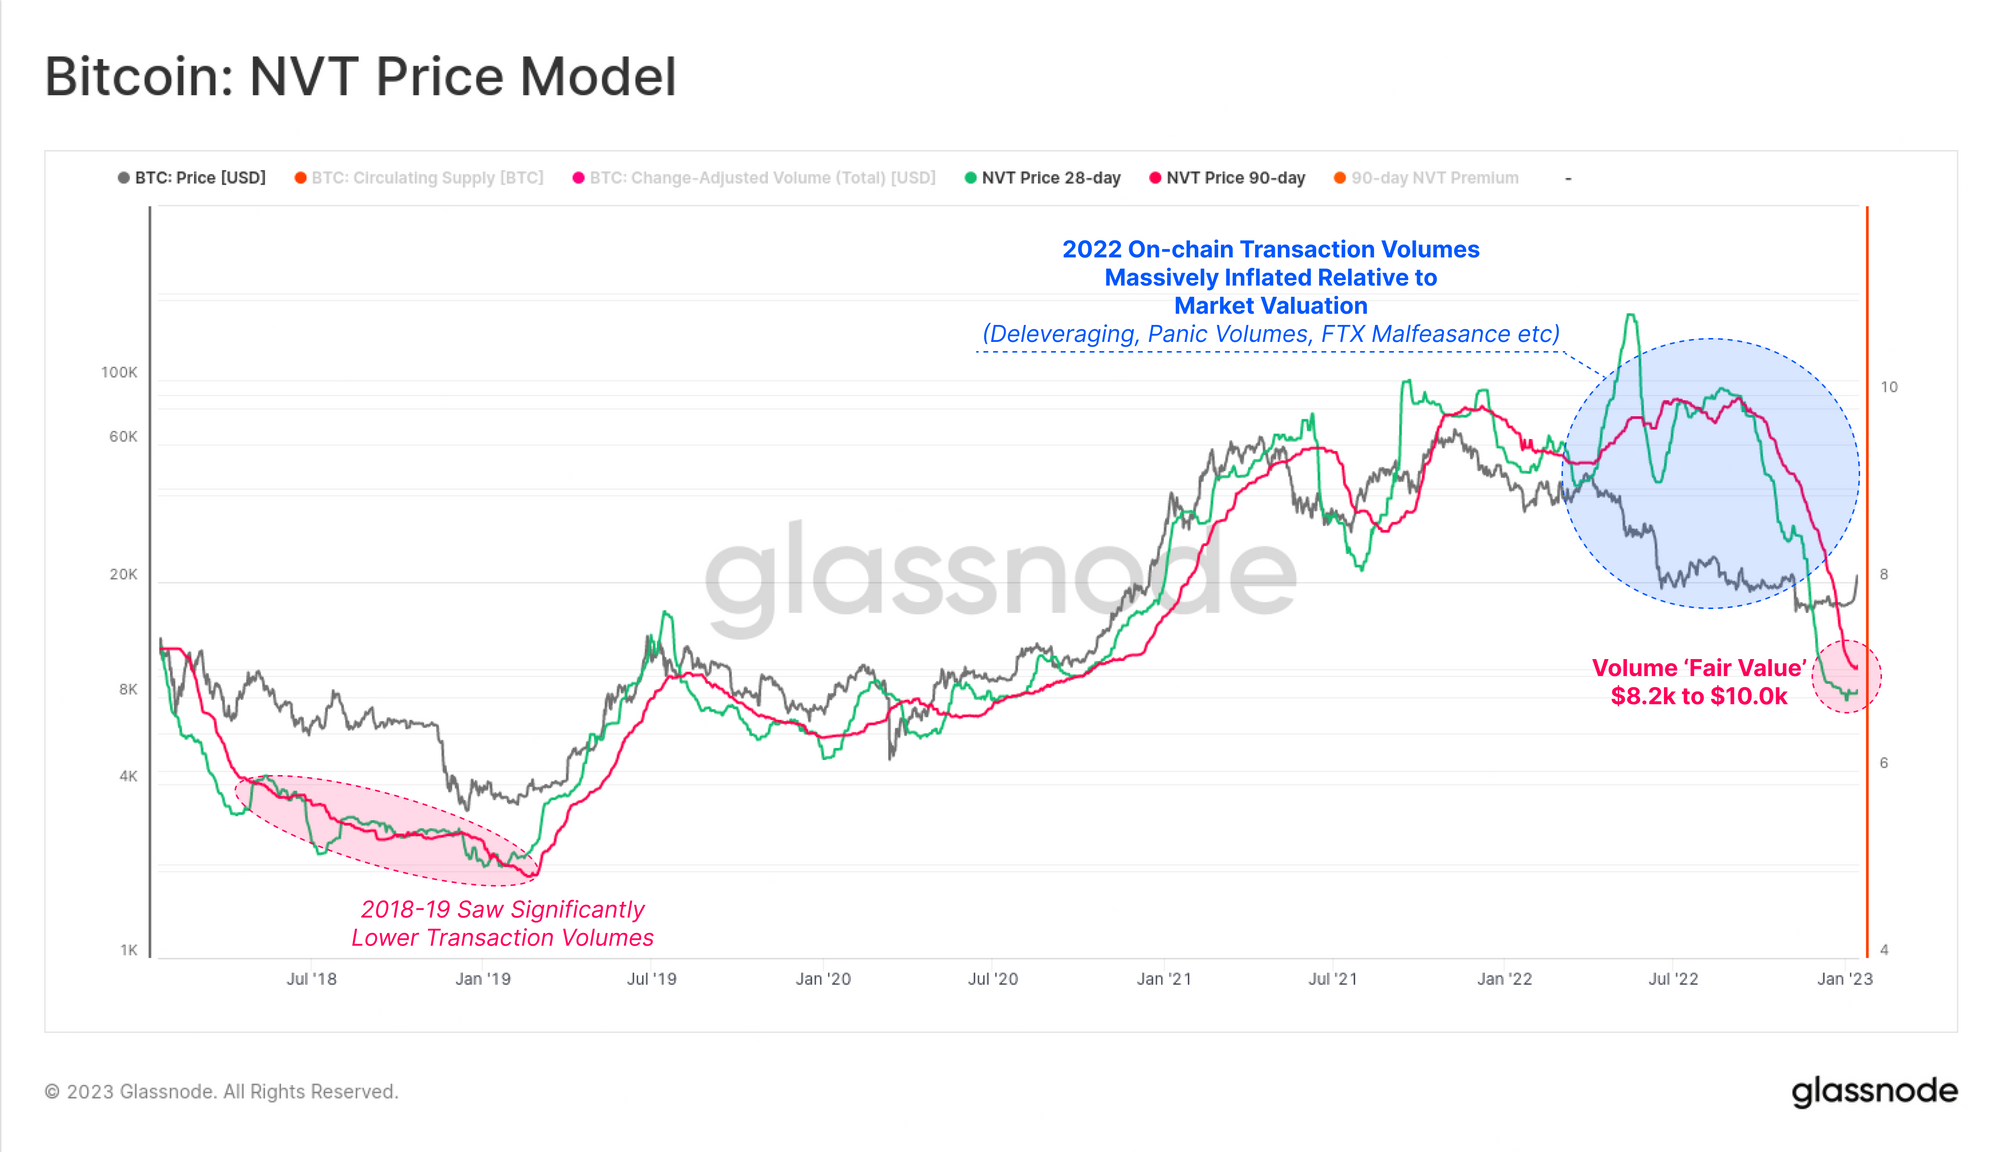
The goal of estimating a fair present, or future value for Bitcoin has been the subject of countless modelling attempts and iterations. One such model was first presented by Willy Woo, and is derived from transaction volumes, and the NVT ratio.
This model uses a look-back at the last two years of settlement volume, and then derives an estimated 'implied fair value' based on network value throughput. The variant below uses our Change-Adjusted volume, which filters transfers using industry standard heuristics. There are two notable observations over the last 12-months:
- The model greatly over-estimated Bitcoin fair value in 2022. In hindsight, this is likely a result of volumes sourced from large entities undergoing massive deleveraging events, but also with an unfortunate component of wallet (mis)management by the FTX/Alameda entities in their final days.
- This model has collapsed in line with the huge reduction in transfer volumes covered last week, suggesting a fair value between $8.2k and $10.0k.
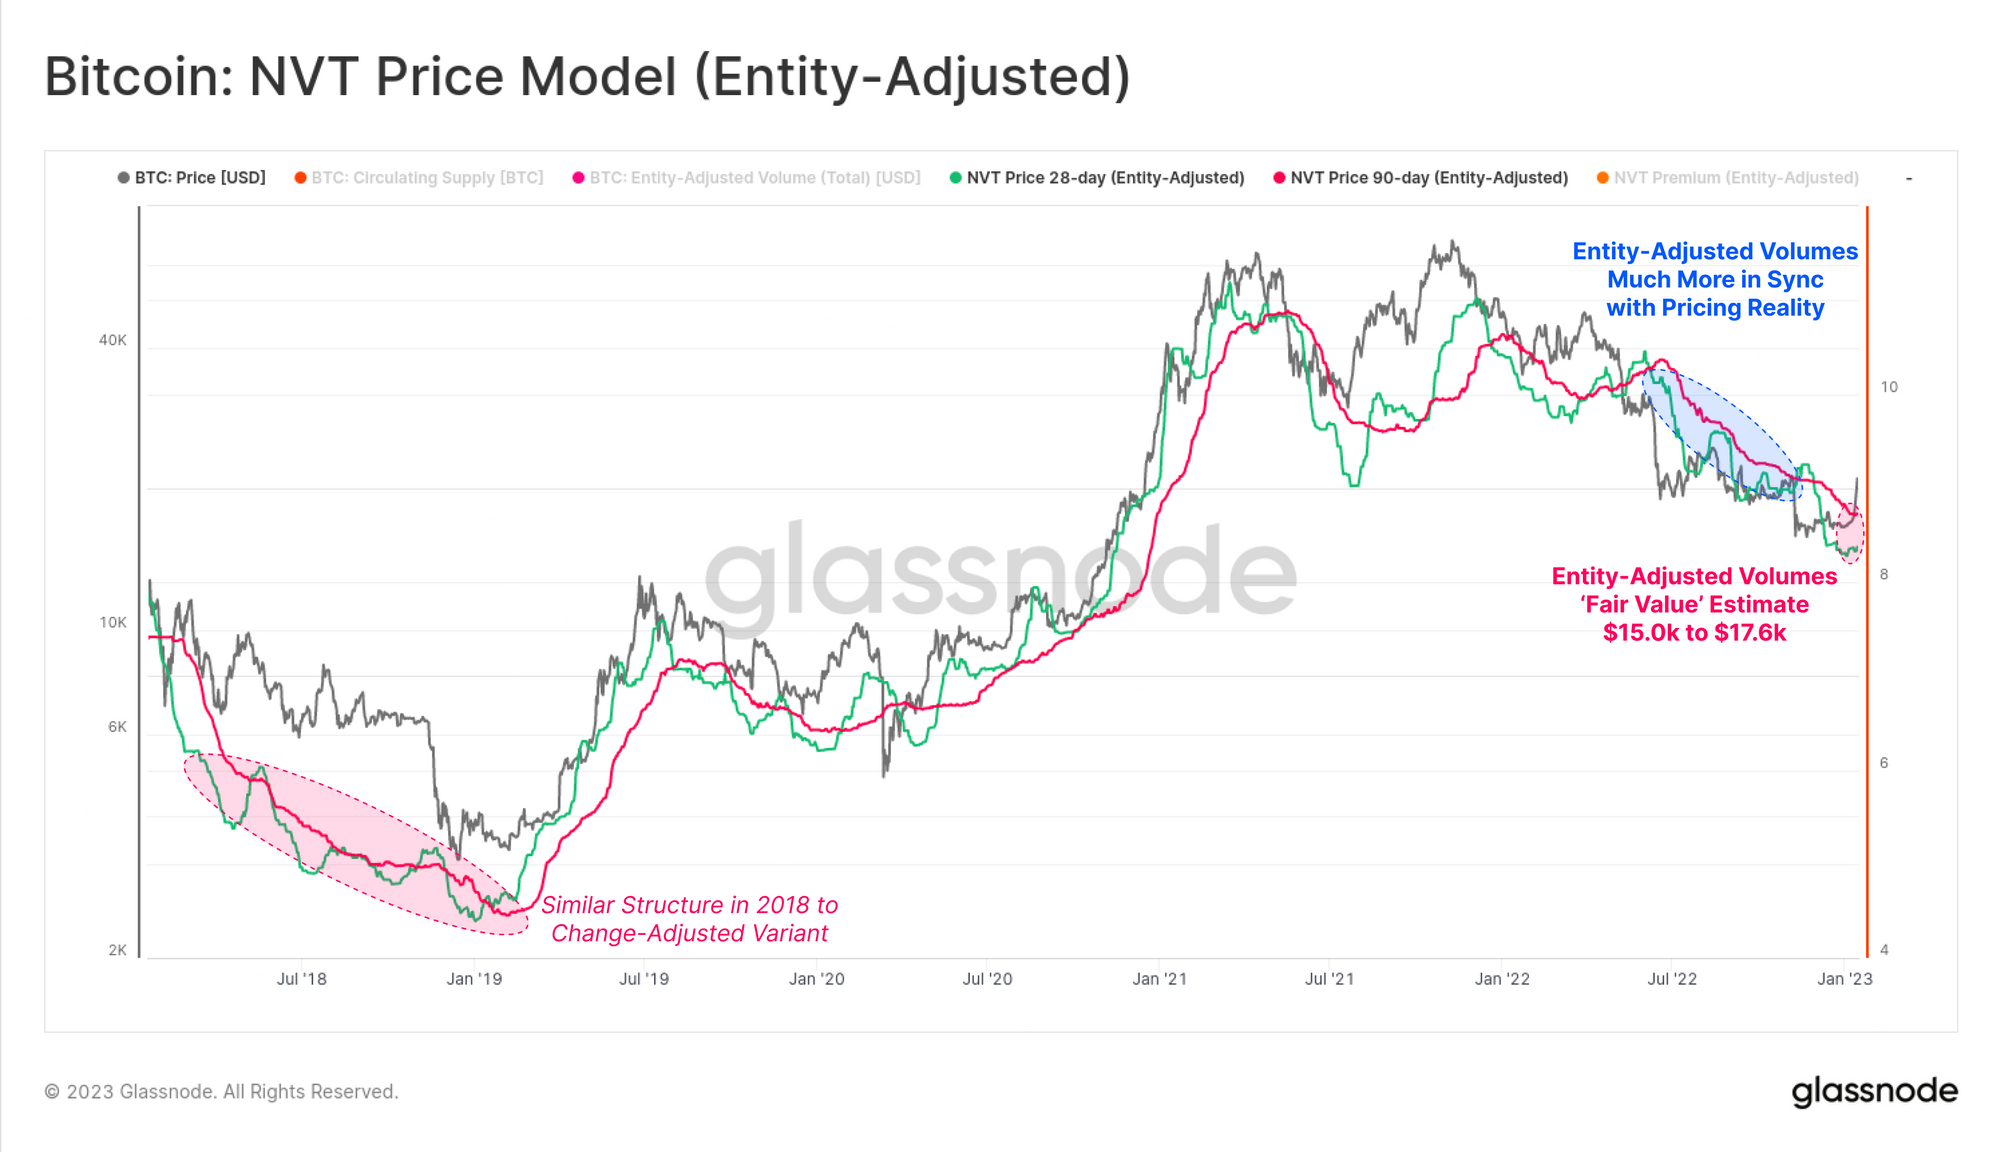
However, with the benefit of glassnode's entity-adjustment algorithms, we can achieve a more accurate representation of true economically meaningful transfer volume, and thus derive a much cleaner NVT Price model, with a visibly stronger relationship to price.
This variant estimates a 'fair value' for Bitcoin between $15.0k and $17.6k based on our best estimate of economical value settled. This is closely aligned with the price range held over the prior month.
Relief For Miners
One of the sectors hit the hardest over the last 12-months has been Bitcoin miners. This was especially visible this cycle as publicly traded companies saw major hits to their valuations, and thus stock prices.
The model below estimates the average cost of BTC production at $18,798, under the assumption that Difficulty reflects the ultimate 'price' of the mining sector.
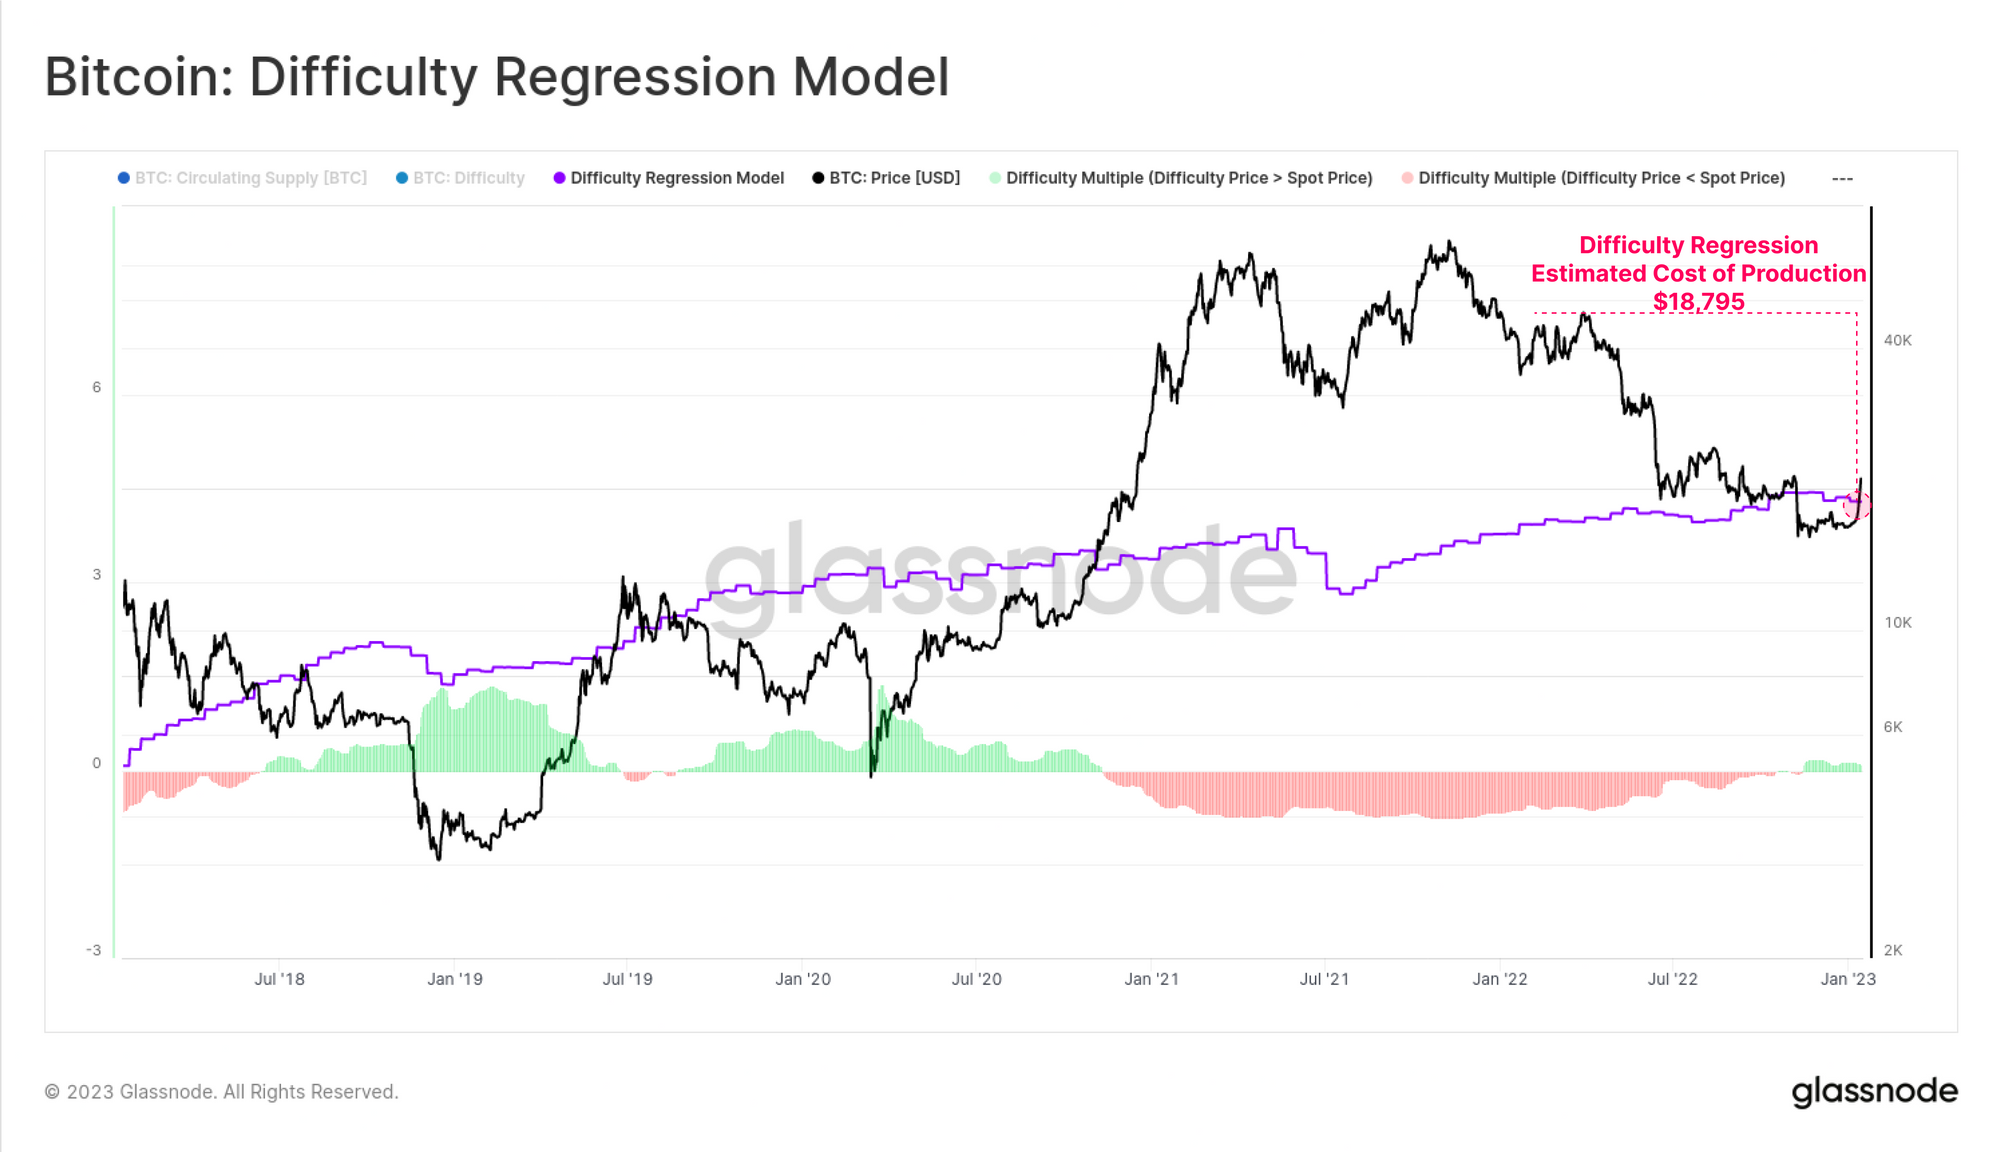
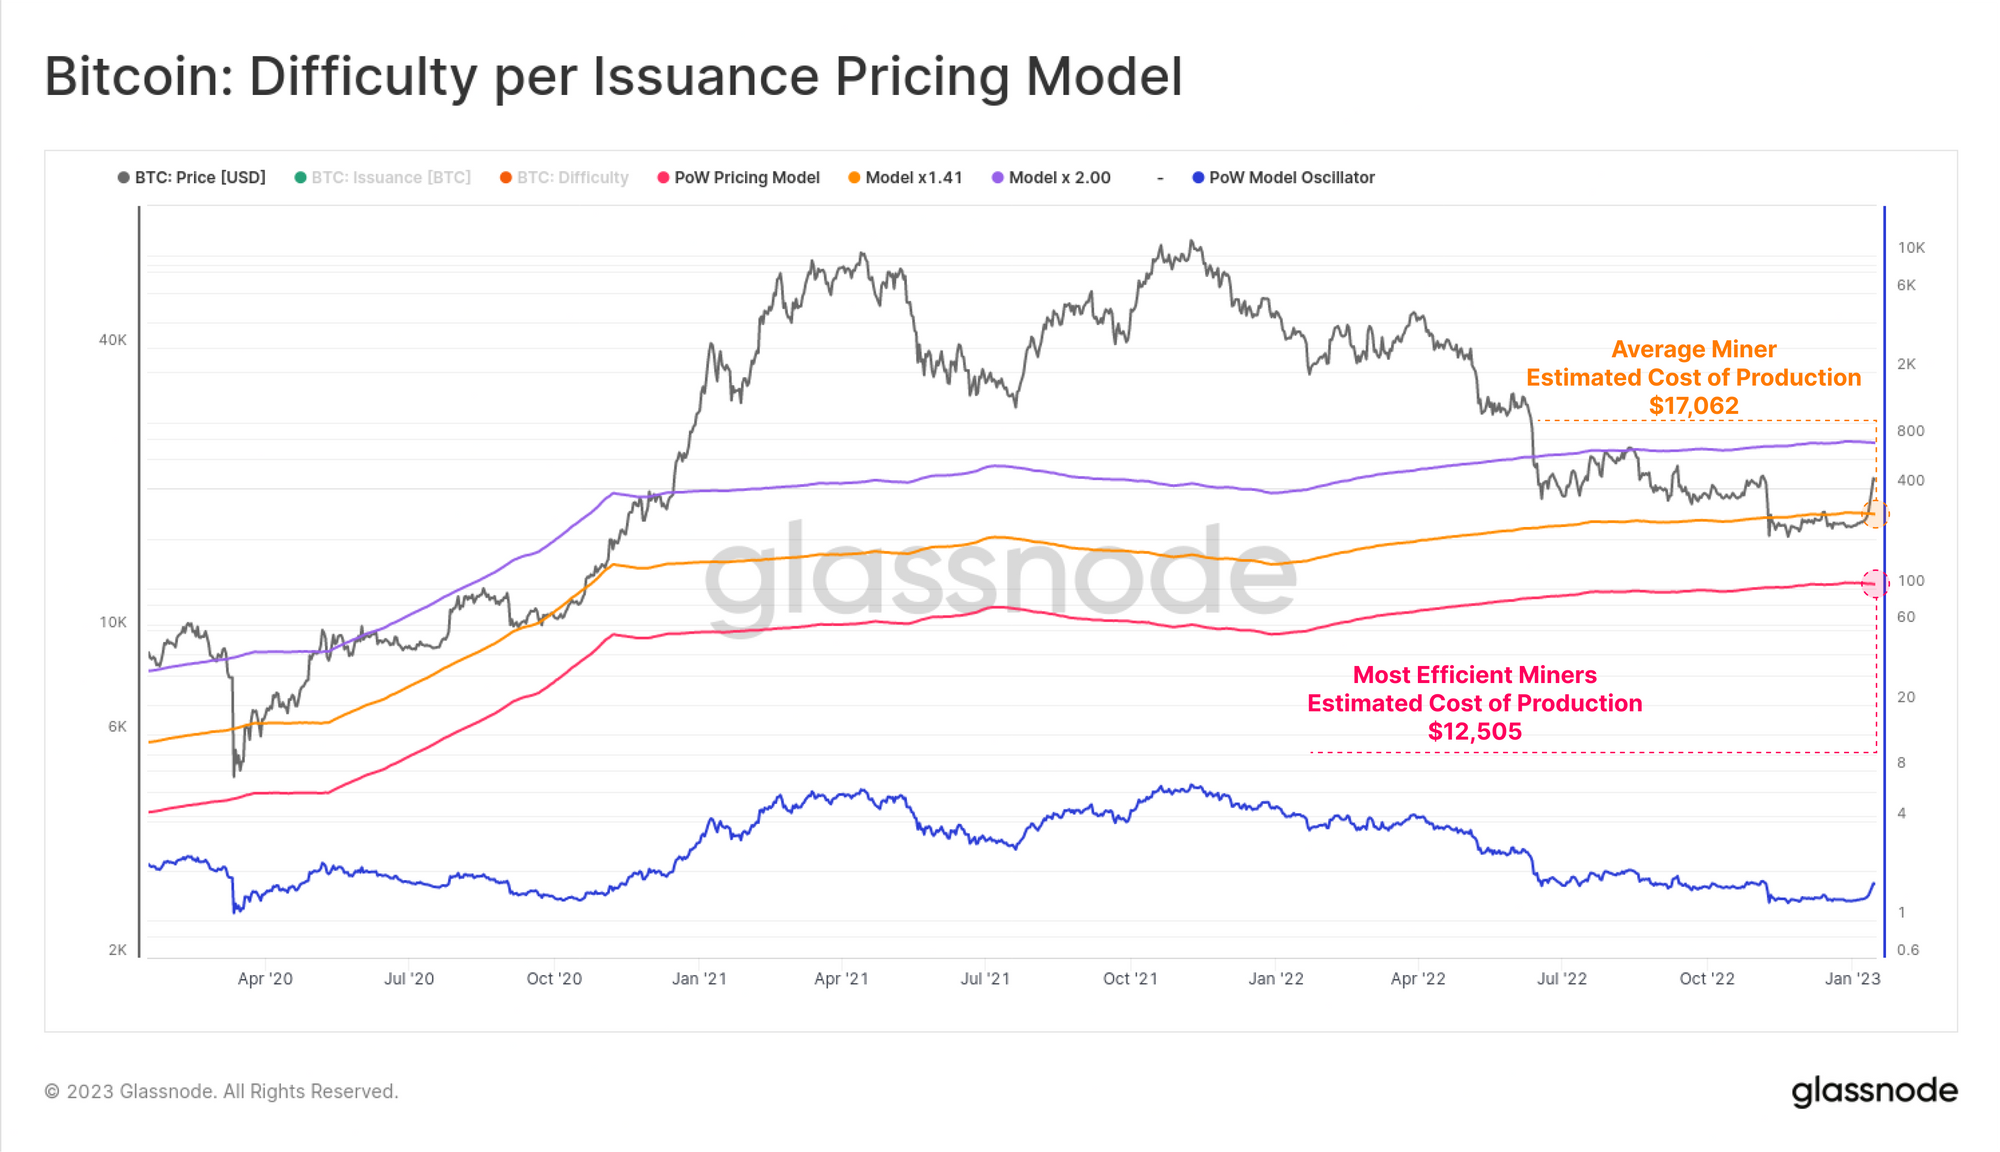
An alternative cost of production model equates Difficulty to the rate of coin Issuance, and develops three bands representing:
- 🔴 The most efficient miners
- 🟠 The average miners
- 🟣 The least efficient miners.
The average production cost is estimated to be $17,062, which is similar, but slightly below the model above ($18.8k). Based on both tools, it is likely that miners across the board are seeing more favourable financial conditions ahead, with the market providing some much needed relief (assuming it holds up).
🔔 Alert Idea: Price breaking below the $17.0k would reflect a fall back below both cost of production models, which may put the mining sector back into acute financial stress.
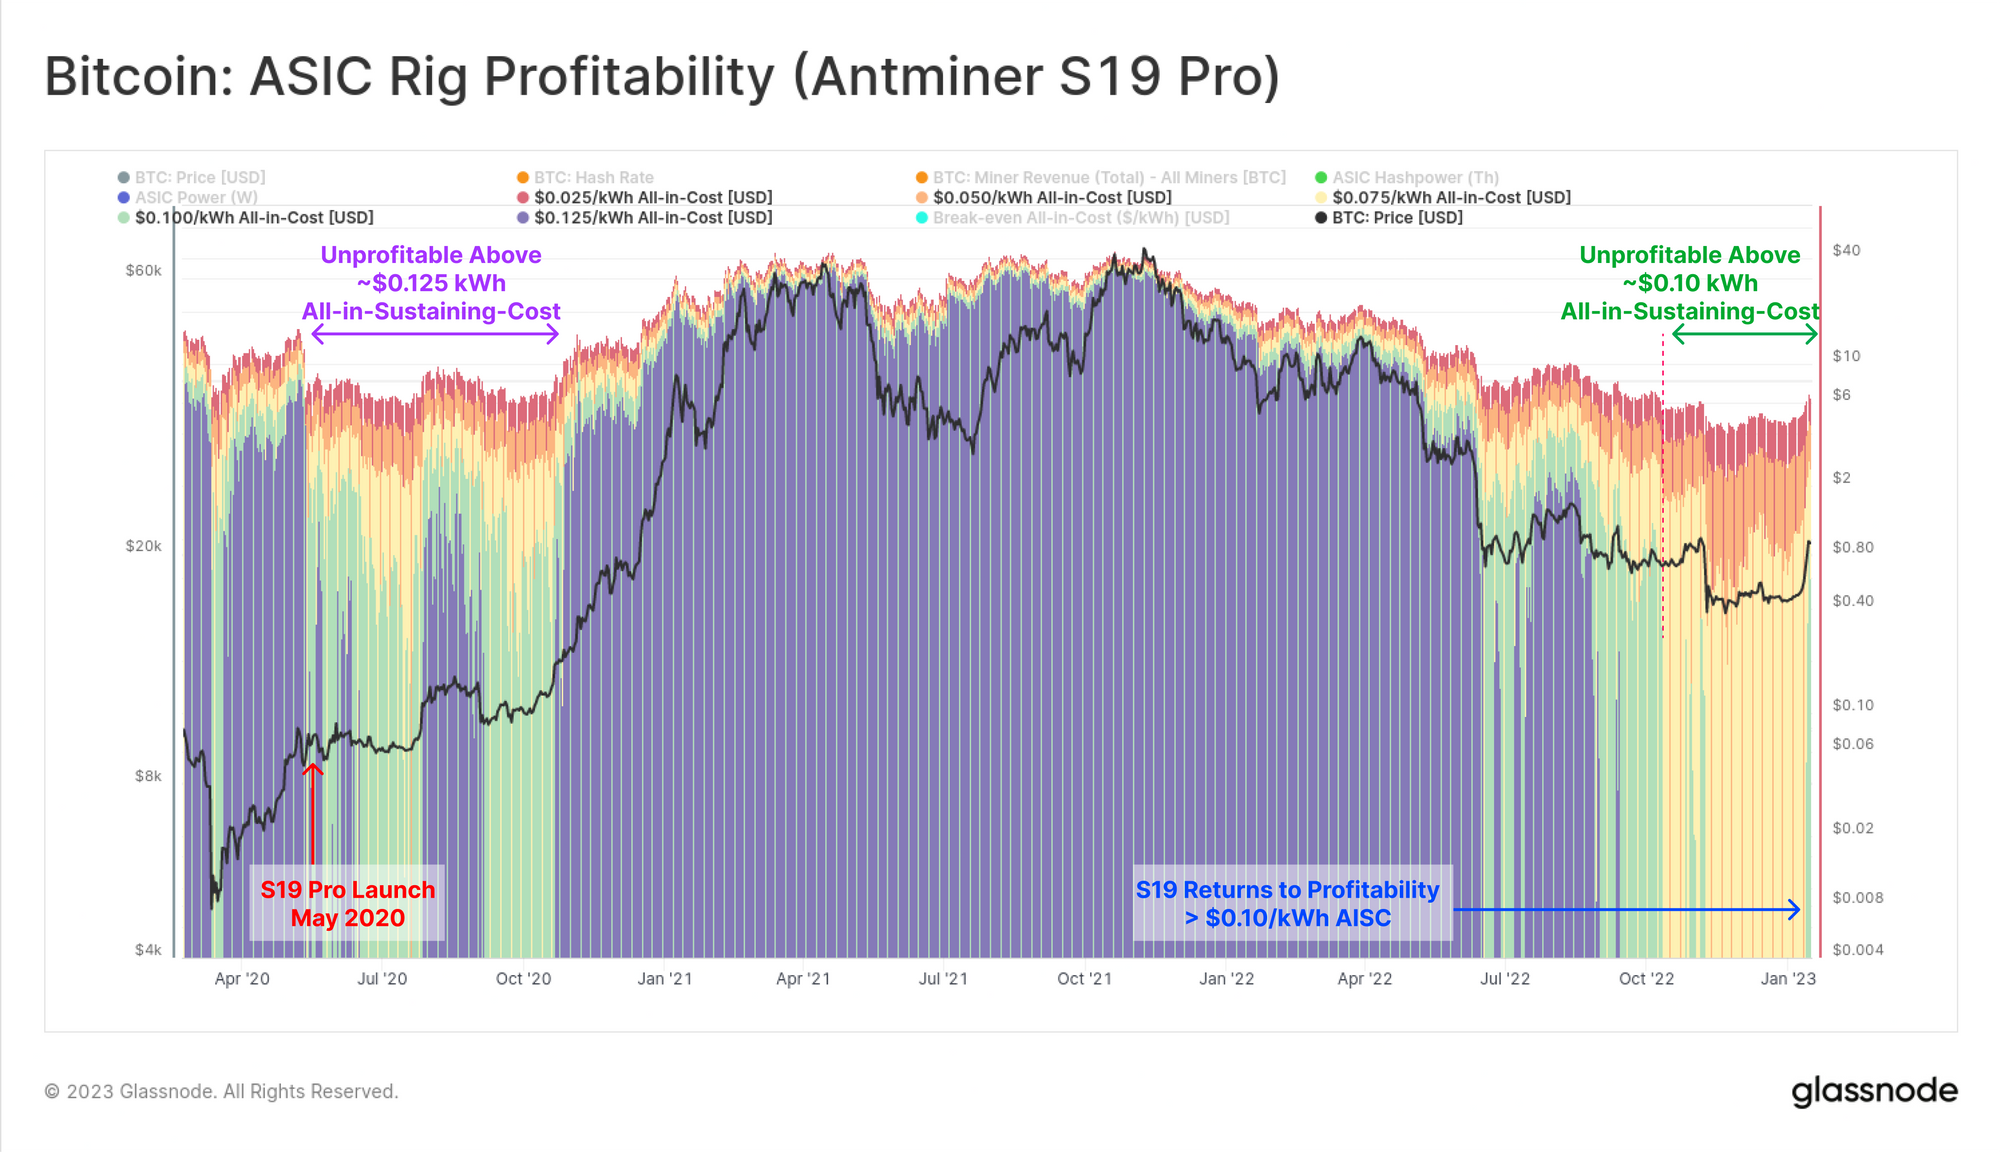
To illustrate this point, the chart below reflects the profitability of the Antminer S19 Pro, released circa May 2020, and until very recently, one of the flagship operational rigs. The colored zones in the chart below reflect estimated profitability levels for this rig under various all-in-sustaining-cost (AISC) assumptions ($/kWh). Note, AISC, not to be confused with ASIC!
- 🟣 $0.125/kWh
- 🟢 $0.100/kWh
- 🟡 $0.075/kWh
- 🟠 $0.050/kWh
- 🔴 $0.025/kWh
With the chart shown in log-space, periods where this rig is estimated to be unprofitable will show up as gaps in the relevant color plot. Two such periods are clear, being May to Oct 2020 (immediately after the rig release, and halving event), and again from July 2022 until this week. Via this model, the S19 Pro is estimated to have been unprofitable for any miner operating at an AISC over ~$0.10/kWh for the last seven months.
🪟 A suite of metrics related to ASIC rig profitability, power consumption, and revenue output can be found in our live dashboard: Mining ASIC Fleet.
Profits Return
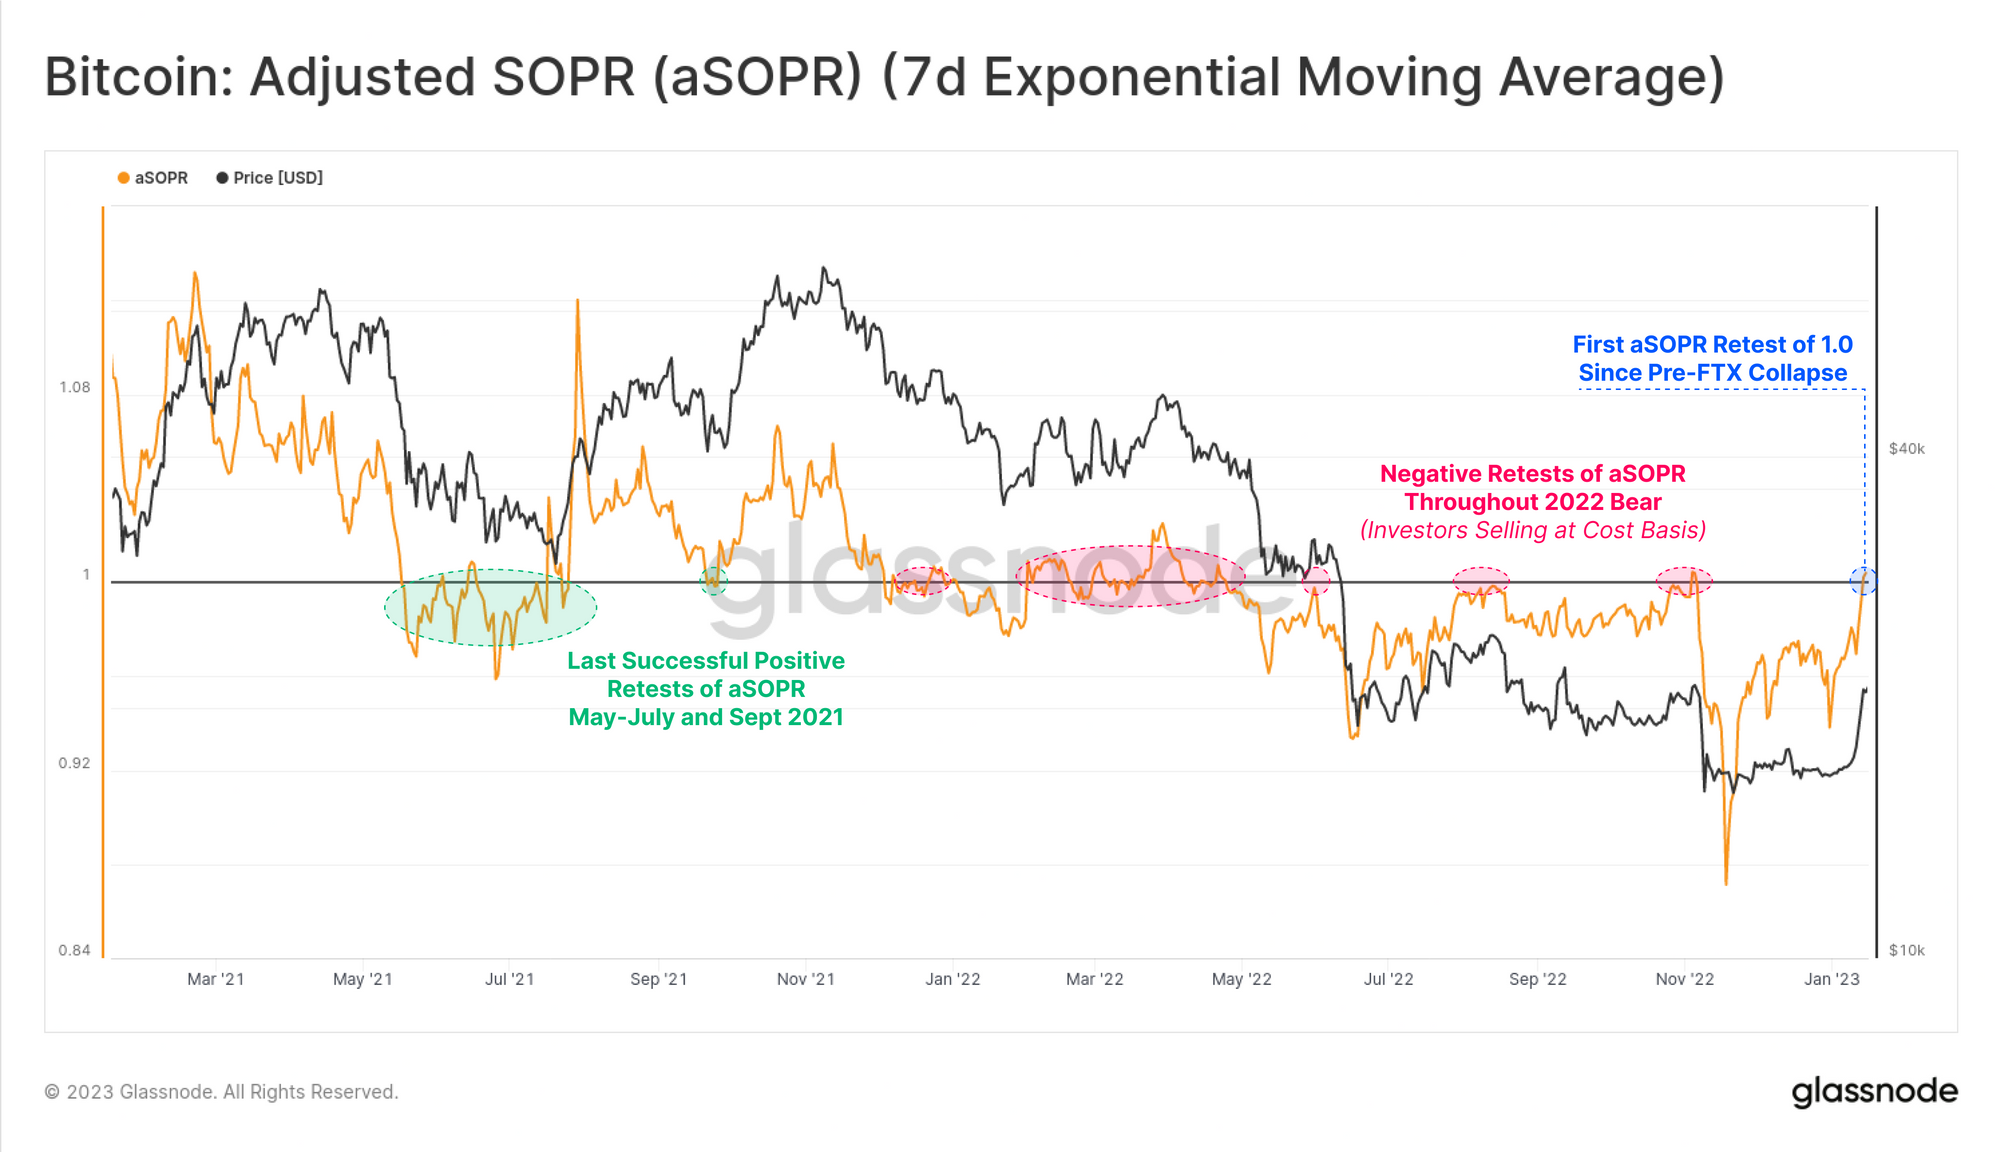
The final topic of interest is the return of profitable transactions on-chain. The aSOPR model is in the process of retesting a value of 1.0 from below, which has proven to be a key resistance level throughout the bear market.
An aSOPR break above, and ideally a successful retest of 1.0 has often signalled a meaningful regime shift, as profits are realized, and sufficient demand flows in to absorb them.
🔔 Alert Idea: aSOPR (30DMA) breaking above 1.0 indicates a wider-scale return of profitability to transactions, and tends to signal macro market strength.
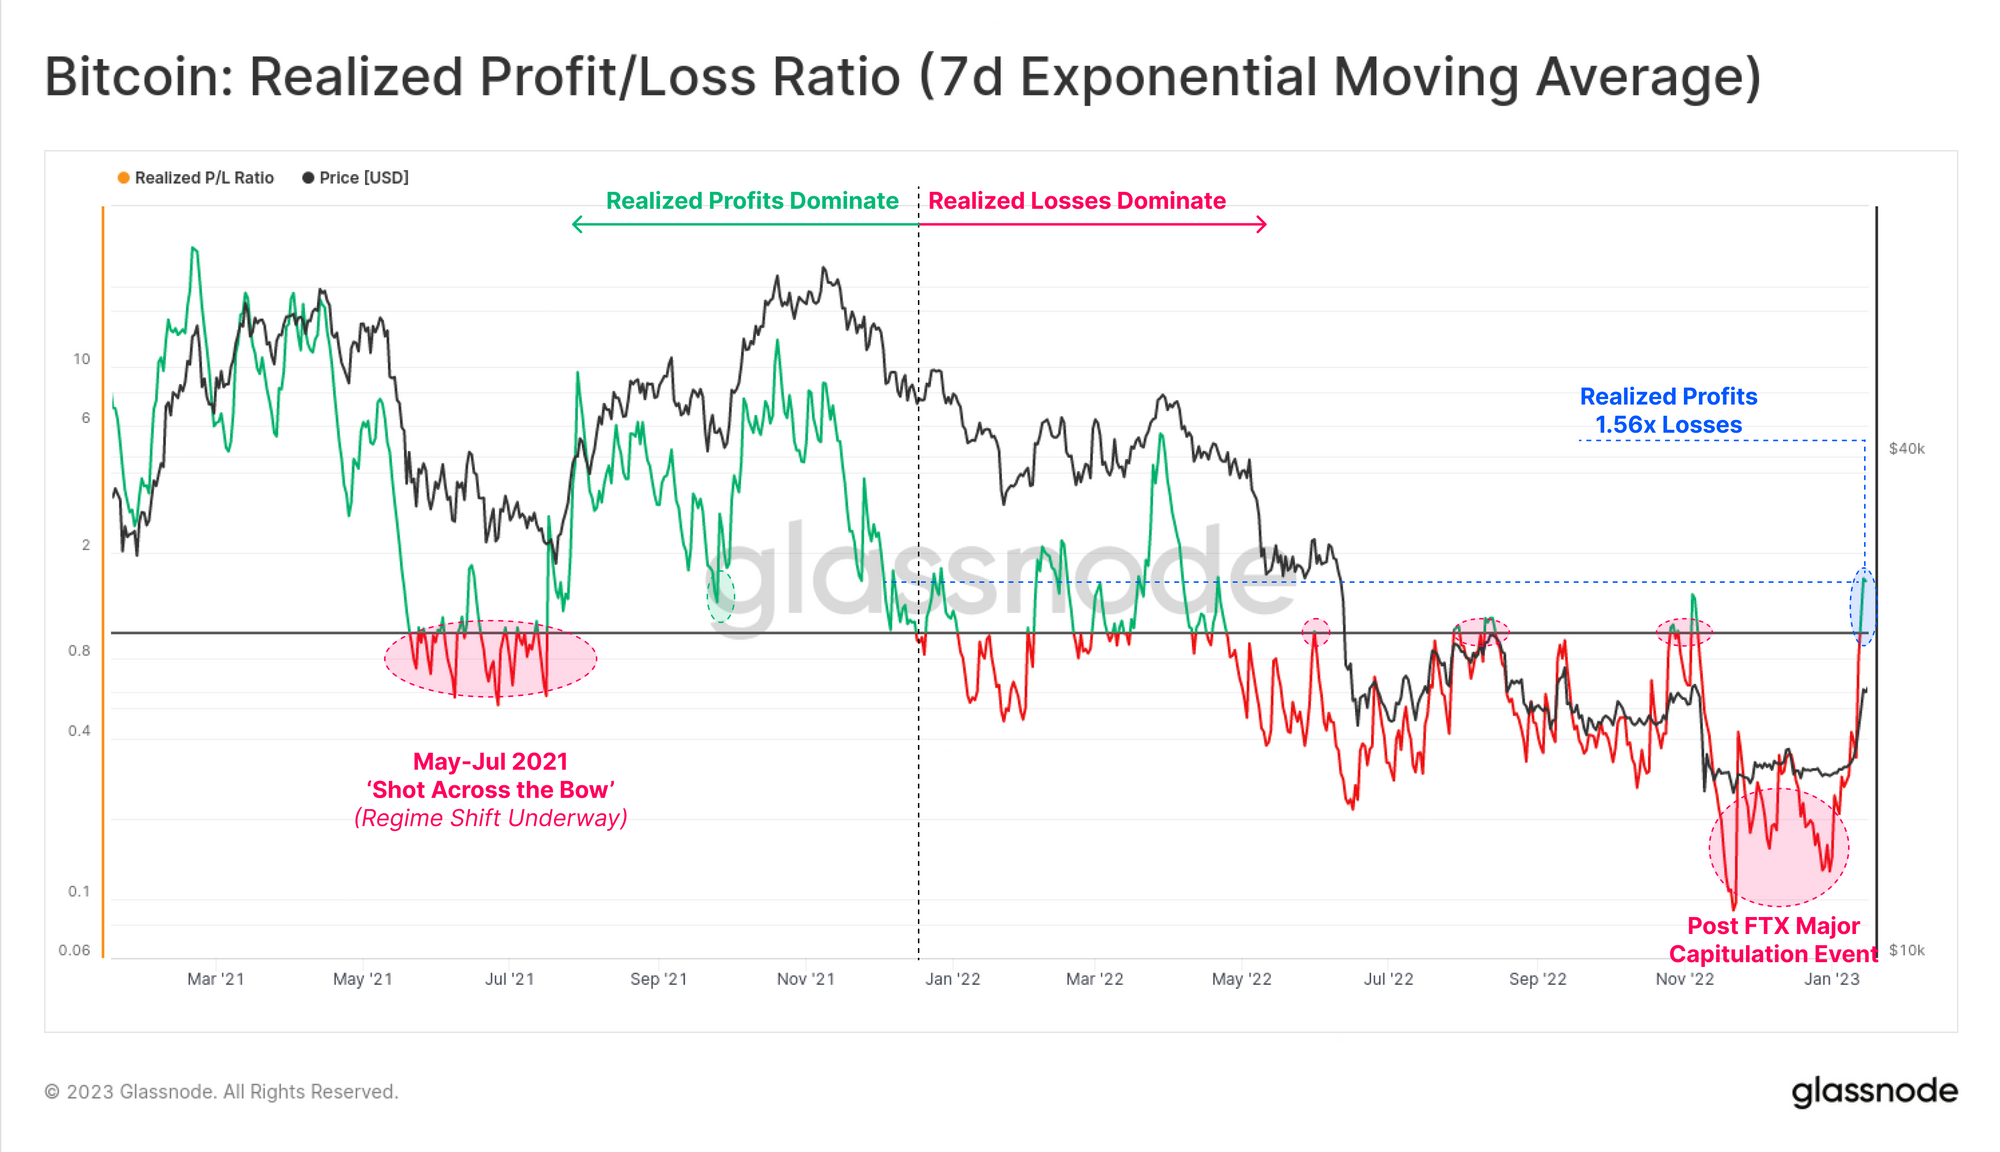
A similar observation can be made for the Realized P/L Ratio, which accounts for total USD size on the move. This model is also retesting 1.0 on the underside, providing a first indication that profitable transactions are occurring, and being absorbed by the market.
🔔 Alert Idea: Realized P/L Ratio (30DMA) breaking above 1.0 indicates a wide-scale return of profitability, and tends to signal macro market strength.
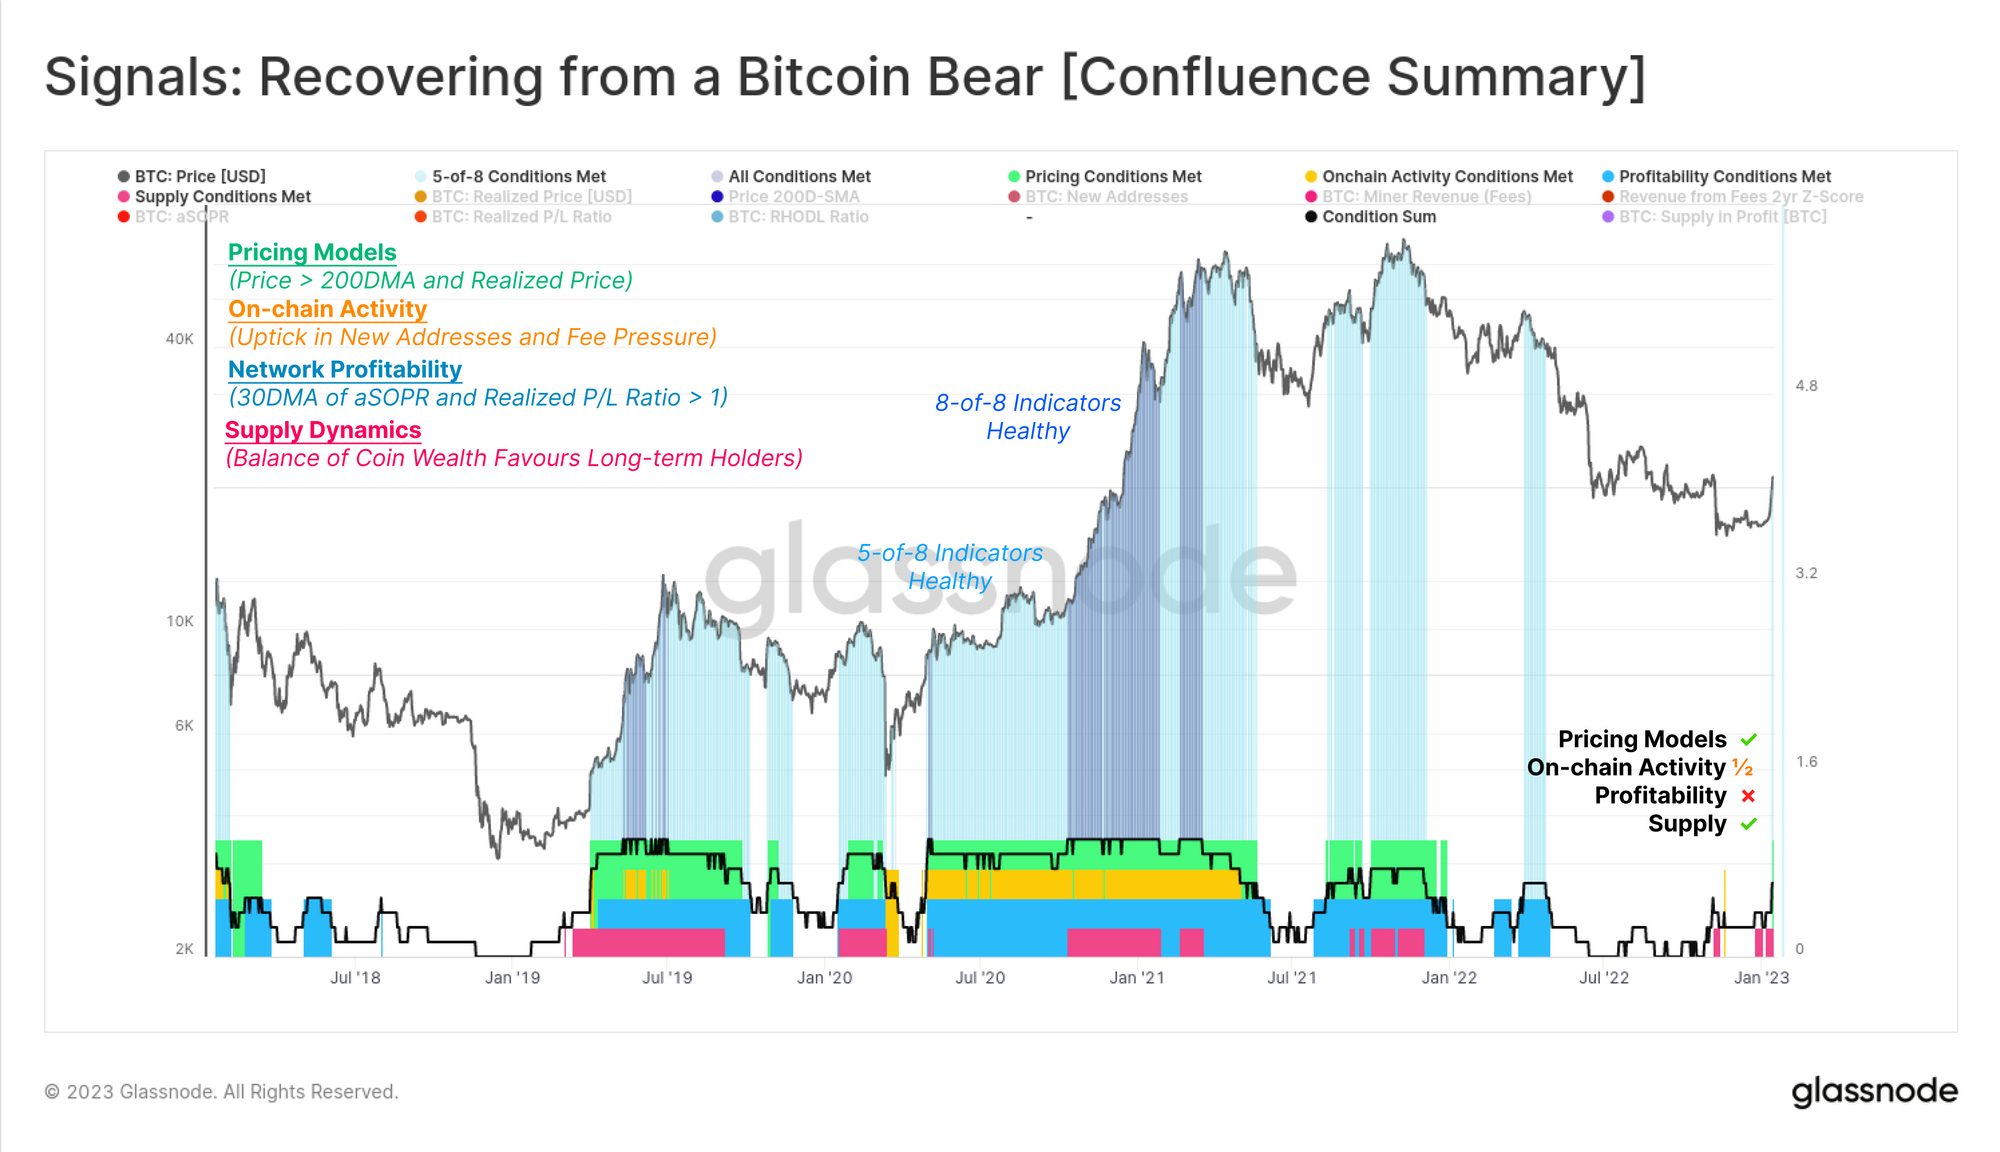
Seeking Confluence
To close, we have recently released a new Dashboard design, aimed at finding confluence amongst several on-chain metrics, across four core concepts. This model distils key levels and observations, that have historically signalled a robust recovery from a bear market is underway, into an easy to use visual tool.
For brevity we will not cover the full details in today's edition, but instead recommend reviewing our video guide, and the notes contained within the Dashboard itself (and future reports covering the subject).
Summary and Conclusions
With an explosive 23.3% rally to start off the year, a wide cross-section of Bitcoin investors (and miners) have seen their net holdings (and operations) return to a profit. This reflects the impact of both strong price appreciation, but also the tremendous volume of coins that changed hands over recent months, resetting their cost basis lower.
With aSOPR and the Realized P/L Ratio testing a break-even value of 1.0, the test as to whether the market can hold onto these gains becomes the next big question.
Disclaimer: This report does not provide any investment advice. All data is provided for information and educational purposes only. No investment decision shall be based on the information provided here and you are solely responsible for your own investment decisions.
Product Updates
December was a relatively quiet month for the markets, but the Glassnode team was still hard at work shipping our new Discovery Page feature, 4x new dashboards, and 23x Workbench constructions. See our latest Product Update for December for a full overview.

Translated channels
We are proud to have launched new social channels for:
- Spanish (Analyst: @ElCableR, Telegram, Twitter)
- Portuguese (Analyst: @pins_cripto, Telegram, Twitter)
- Turkish (Analyst: @wkriptoofficial, Telegram, Twitter)
- Farsi (Analyst: @CryptoVizArt, Telegram, Twitter)
- Follow us and reach out on Twitter
- Join our Telegram channel
- Visit Glassnode Forum for long-form discussions and analysis.
- For on-chain metrics, dashboards, and alerts, visit Glassnode Studio
- For automated alerts on core on-chain metrics and activity on exchanges, visit our Glassnode Alerts Twitter