Bitcoin Barely Hanging On

Near-term weakness continues to haunt numerous Bitcoin fundamentals, with prices faltering amidst minimal excess sell-side pressure. Investors who are spending appear to be taking advantage of any and all exit liquidity offered.

Bitcoin Barely Hanging On

It has been another tough week for asset markets, with Bitcoin, equities, forex, and bond markets experiencing volatility, and general price depreciation. The Euro has once again traded below USD parity as the European energy crisis worsens, and the DXY Dollar Index has punched up to a new twenty year high above 109.30.

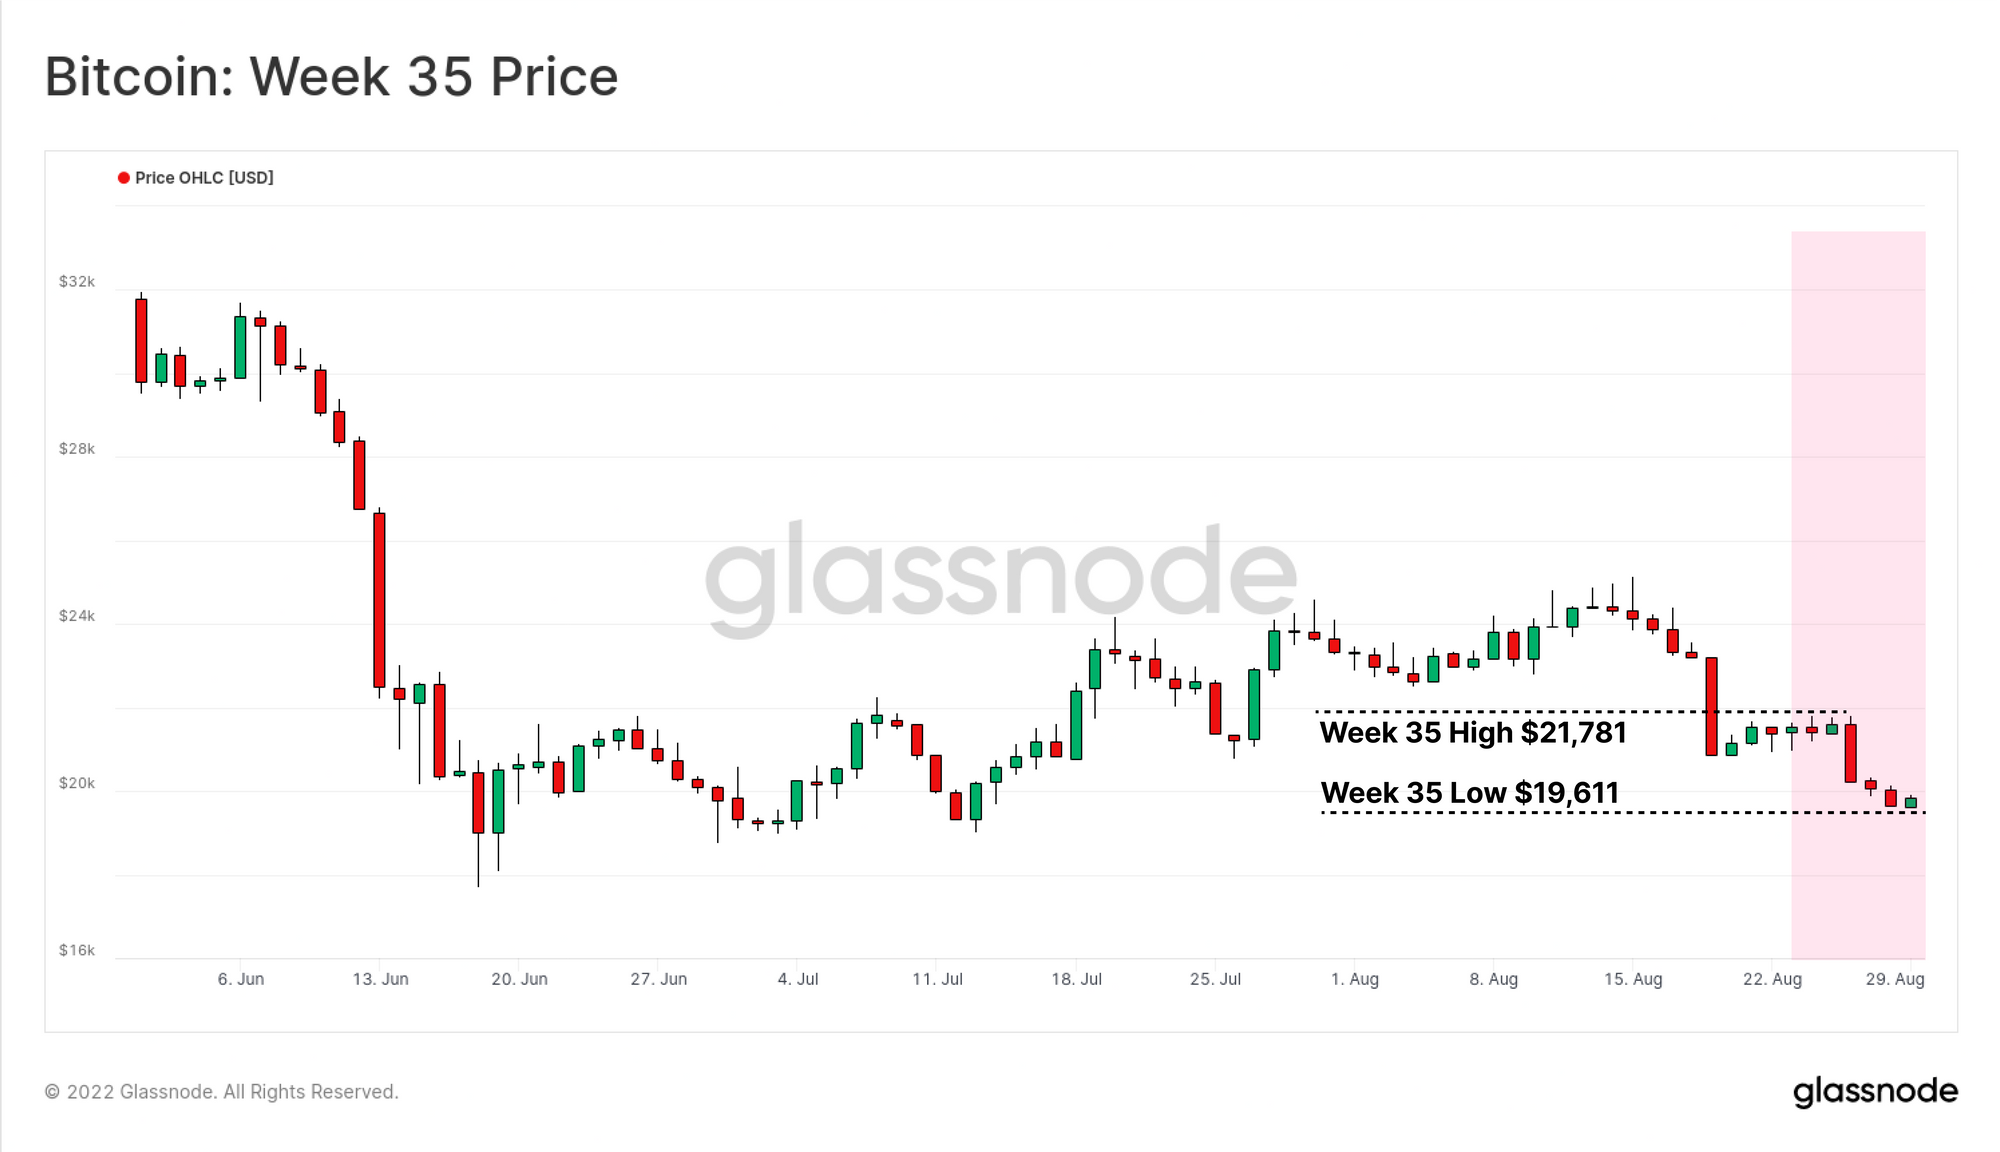
With the US Federal Reserve governors continuing to signal a hawkish stance on inflation at Jackson Hole, Bitcoin, as a developing index for global liquidity, reacted accordingly. Prices traded lower this week, coming off a high of $21,781, and hitting a multi-week low of $19,611.

In this edition, we will continue our assessment from last week (WoC 34), exploring how near-term weakness continues to be visible across many Bitcoin fundamental metrics. This creates a condition where prices are trading lower, even with very little additional sell-side pressure on-chain. This continues to signal both persistently weak demand, as well as an investor base who is willing to take whatever exit liquidity the market offers them, to 'get their money back' at cost.


🔔 Alert Ideas are presented throughout to help identify key metric levels of interest that may signify significant shifts in market/network performance. Any Glassnode member can set an alert directly from Glassnode Studio.


Translations

This Week On-chain is now being translated into Spanish, Italian, Chinese, Japanese, Turkish, French, Portuguese, Farsi, Polish, Russian, Arabic and Greek.

The Week Onchain Dashboard

The Week Onchain Newsletter has a live dashboard with all featured charts available here. This dashboard and all covered metrics are explored further in our Video Report, which is released on Tuesdays each week. Visit and subscribe to our Youtube Channel, and visit our Video Portal for more video content and metric tutorials.


Falling In the Breeze

We will start our assessment from the lens of lifespan metrics, which broadly describe the age of coins that are being spent on-chain. Generally speaking:

  • Lower lifespan values signify younger coins dominate transactions. It is usually encountered as the bear market grinds lower, and speculators are purged from the market.
  • Higher lifespan values signify older coins dominate transactions. It is usually experienced during bull markets as profits are taken, but also during bearish capitulation events, due to panic selling.

ASOL tracks the average age per spent output, but ignores coin volume. It has been in a macro decline since Jan 2021, coincident with the prevailing bear. It spiked higher over recent weeks, as a group of older coins were spent, however this was only for a fleeting moment.

Weak price action without a sustained trend higher in ASOL signifies that the available demand can barely hold up the day to day sell-side pressure, let alone additional spending by profit takers and/or capitulation events was to take place.

Live Professional Chart

We can further inspect this by looking at Dormancy, which is the average age per unit coin moved. This metric does account for spent coin volume. Here we can see that the average age per coin is near multi-year lows, which means the ASOL spike was actually very light on BTC volume, bolstering the observation of very weak demand for Bitcoin.

If prices were climbing, this would be a very constructive signal, as it shows older coins are staying dormant. As it stands, however, this indicates the reverse, whereby prices are still struggling to hold the line even with older coins staying put in investor wallets.

Live Advanced Chart

At a macro scale, the Coin-Years Destroyed metric continues to push lower, reaching a relatively significant low. This metric aggregates the total lifespan destroyed (in years) over the last 365-days, and similar to dormancy, low levels are usually constructive and typical of late stage bear markets.

It remains plausible that the Bitcoin market is trading within what may become a longer-term bottom formation pattern. However, it is clear that the market is only just hanging on at present and is far from out of the woods yet.

Live Advanced Chart

To really hammer home this point of fundamental weakness, we can top it off with the Active Entities chart below. This metric can be considered analogous to 'unique daily active users' of the Bitcoin network, and it is currently testing the lower end of the long-standing Bear Market Channel.

This indicates that there is little growth in the active user-base, and the network is currently trafficked by the bare minimum user base we would consider to be within 'historical bounds.' Should Active entities decline much further, it would suggest an unfortunate deterioration of the user base, and enter a zone of aggregate weakness which has not been seen for many years.


🔔 Alert Idea: Active Entities (7DMA) breaking below 230k/day could signal a deterioration in on-chain activity, whilst a break above 250k/day could signal an influx of new user demand.

Live Professional Chart

To end this first section on a slightly brighter note, it is quite clear that no widespread loss of HODLer conviction has taken place. The decline in lifespan metrics actually bodes well for the longer-term, as it indicates old coins are stationary, and declining prices have little psychological impact on this cohorts' conviction.

Whilst the resolve of the strong hands remains rock solid, it simply appears that their available demand inflows have not yet rebuffed the bears, who have driven the bulls back to the $20k line.


New Glassnode Content: Market Pulse

We are pleased to launch a new series of analysis content, available exclusively for Glassnode members. The Market Pulse is a weekly series hosted and discussed on Glassnode Forum, where our analysts explore advanced topics, and Workbench creations in greater detail.


Sold At Break Even Prices

In the section above, we established that the current Bitcoin user base performance is lacklustre at best, and that price action remains remarkably weak, even as older coin expenditure declines. To make matters worse, investor psychology appears to be one that is keen to simply 'get my money back,' with a great degree of spending taking place at and around their cost basis.

In aggregate, Bitcoin investors are realizing around $220M/day in net losses. On a relative scale, this is quite modest in magnitude, especially relative to recent multi-billion dollar capitulation events. However, even with this relatively light capital outflow of $220M/day, the bulls are fighting an uphill battle.


🔔 Alert Idea: Net Realized Profit/Loss (30DMA) breaking above Zero would signal that net spending is back in profit, suggesting potential market strength and demand recovery.

Live Advanced Chart

Looking at the aSOPR metric, we can observe the average profit (or loss) multiple on spent coins. Generally speaking, an aSOPR value near 1.0 is of heightened interest:

  • aSOPR of 1.0 in a bullish trend 🟢 often acts as support, as investors buy the dip and add to their position at or around their cost basis. This also signifies profitable coins prefer to stay dormant, reducing sell-side pressure at the lows.
  • aSOPR of 1.0 in a bearish trend 🔴 often acts as resistance, as investors sell the rally and offload their position at or around their cost basis. Psychologically this reflects a mentality of 'getting my money back' on whatever exit liquidity the market offers.

The recent sell-off was initiated after a convincing underside retest of 1.0 at a time where prices reached above $24k. Rejection from this level largely confirms weakness lay on the road ahead, as investors took the exit liquidity and spent coins around their acquisition cost basis.


🔔 Alert Idea: aSOPR (7DMA) breaking above 1.0 would signal that aggregate spending is back in profit, suggesting potential market strength and demand recovery.

Live Advanced Chart

Bitcoin Long-Term Holders are also feeling the pinch, with LTH-SOPR values trading around 0.60 to 0.65 for several consecutive weeks. This indicates that investors who have held their coins for at least 5-months, and are statistically the least likely to spend, are locking in losses between -35% and -40% on average. Buyers from the 2021-22 cycle continue to exit their positions at a meaningful loss.

Whilst not as severe as the -50% peak losses in 2018 (to date), this current bear market competes meaningfully with the worst bears of the past on the basis of most damage done. A meaningful recovery of LTH-SOPR above 1.0 would be a constructive signal, however has historically taken a number of months to achieve this escape velocity.


🔔 Alert Idea: LTH-SOPR (7DMA) breaking above 1.0 would signal that Long-Term Holder spending is back in profit, suggesting potential market strength and demand recovery.

Live Professional Chart

Finally, we close out with an aggregate view of recent on-chain losses, where we can see that the scale of capital outflow over the last month is historic. Surpassed only by the 2018 capitulation, the relative magnitude of investor losses in recent weeks is enormous, hitting 0.28% of the Market Cap per day.

Given this reality, it should be of little surprise that investors are willing to take whatever rallies and profits they can get.

Live Professional Chart in the Glassnode Engine Room

Summary and Conclusions

The 2022 bear market carries on and has clearly taken a toll on the aggregate Bitcoin investor base. Despite not seeing any widespread loss of conviction amongst the HODLers, as signalled by lifespan metrics in decline, the bulls still cannot establish a meaningful uptrend.

The psychology of investor spending patterns remains firmly in the bear market territory, as rallies are sold, and exit liquidity is taken at or around cost basis levels. Given the current remarkably low active user base, it could be considered impressive that the $20k level has held up to date.

It remains plausible that Bitcoin is in a bottom formation range and would be historically similar to all past bear markets. However, Bitcoin prices are just barely hanging on, and any uptick in the fundamentals would be a welcome change.


Product Updates

All product updates, improvements and manual updates to metrics and data are recorded in our changelog for your reference.

Disclaimer: This report does not provide any investment advice. All data is provided for information purposes only. No investment decision shall be based on the information provided here and you are solely responsible for your own investment decisions.