The Great Detox

Bitcoin has once again rejected below the psychological $20k region, plunging Short-Term Holders into severe unrealized loss. However, HODLers remain steadfast, with numerous metrics displaying a full cycle detox.

The Great Detox

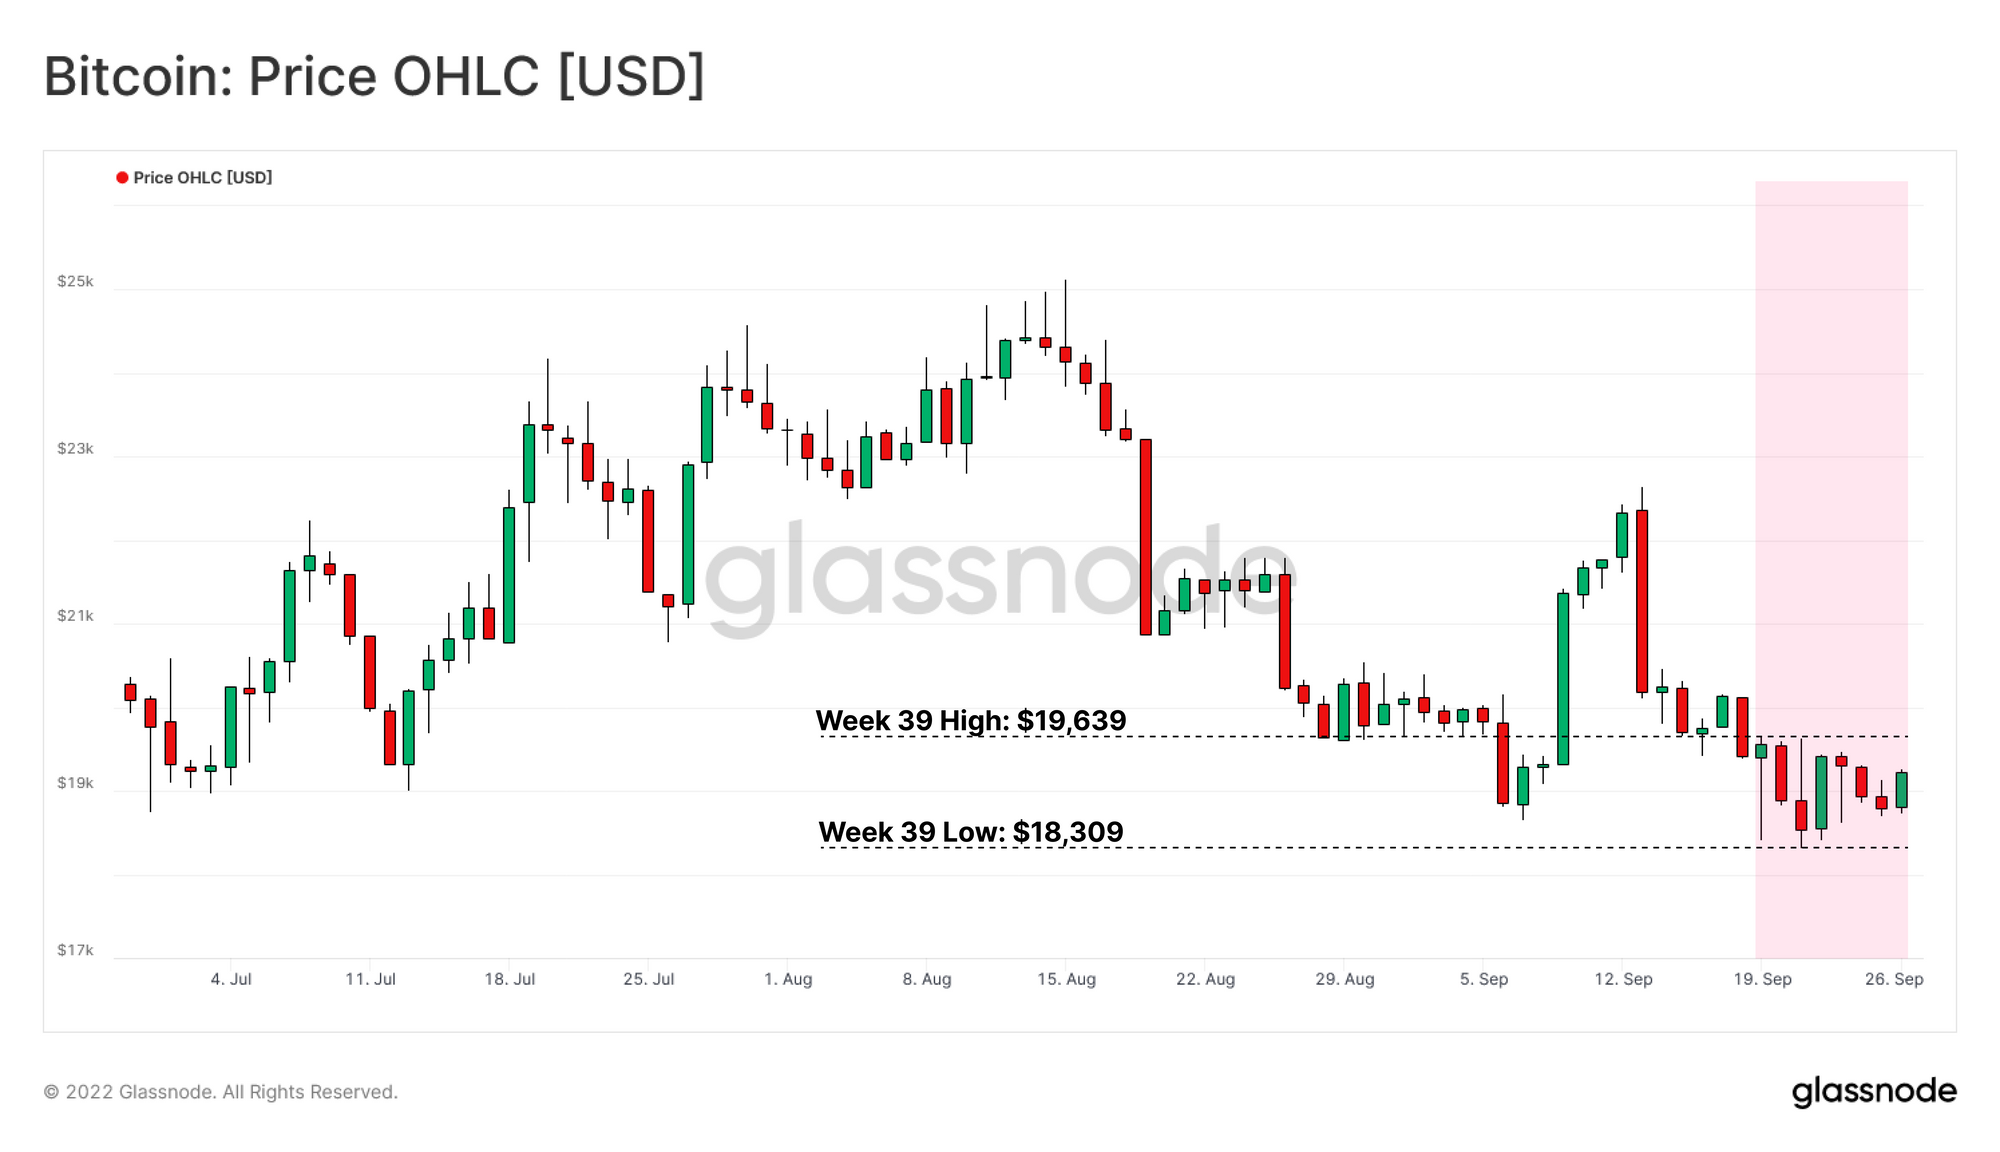
As the evaporation in global liquidity continues, emphasized by new local highs on the DXY index, Bitcoin has remarkably shown a degree of relative strength. BTC prices remained range bound this week, trading between a peak of $19,639 and lows of $18,309. However, price action is just barely hanging on to the consolidation range lows set in July, holding the line from what could be further capitulation.

In this edition, we shall analyze the activity profile of the network from the pillars of adoption, retail participation, and settlement utility. We will also explore the concept of lifespan to further understand the symbiotic relationship between network activity and participant spending behavior.


Translations

This Week On-chain is now being translated into Spanish, Italian, Chinese, Japanese, Turkish, French, Portuguese, Farsi, Polish, Arabic, Russian, Vietnamese and Greek.

The Week Onchain Dashboard

The Week Onchain Newsletter has a live dashboard with all featured charts available here. This dashboard and all covered metrics are explored further in our Video Report, which is released on Tuesdays each week. Visit and subscribe to our Youtube Channel, and visit our Video Portal for more video content and metric tutorials.


All That Remains

Initially, we will explore the New Entities Metric, which is a measure of network adoption, and captures a best estimate of the number of new unique entities that transacted on the Bitcoin Network. Here we can see that around 83.5k new entities are coming online per day, which a new macro low for the 2020-22 cycle, but remains higher than the 2018 bear market low, which reached a minimum influx of 66.5k new entities per day.

Live Professional Metric

By comparing the level of average monthly adoption, to the average yearly adoption, we can establish when a macro momentum shift in network adoption is underway.

  • If Monthly Growth 🟠 > Yearly Growth 🔵, network adoption can be considered to be expanding and recovering relative to the longer-term baseline (shown in 🟧 below).
  • If Monthly Growth 🟠 < Yearly Growth 🔵, the network adoption can be considered to be contracting and deteriorating relative to the longer-term baseline (shown in 🟪 below).

In our present cycle, network growth first entered a contracting regime 533 days ago, with only a brief period of 52-days respite in March-April 2022. The 2018-20 bear market has a few more periods of adoption recovery, notably around the mid-2019 rally to $14k.

Monthly network adoption recently collapsed below the level set following the Great Miner Migration in May-2021. This signifies that an appreciable recovery is not yet underway, and there is a declining influx of new users to the network.

Live Professional Workbench

Next, we can use the Median Transaction Volume metric to reflect the behavior of smaller sized transactions. As explored in the Market Pulse #3: Understanding Network Participation through Means and Medians, the Median Transfer Volume represents the “middle of the pack spend”, and thus can be used as a proxy to represent the participation of small entities. This can be considered under the following framework.

  • Increases in the Median Transfer Volume generally signifies to an increase in retail participation.
  • Decreases in the Median Transfer Volume generally signifies a decrease in retail market participation.
  • A stable Median Transfer Volume has historically occurred after an expulsion of retail participants, this a indicates stable usage of the remaining network participants (HODLers, career traders, large money).

Currently, the structural decline of the Median Transfer Volume appears to be in the process of gradually flattening out. This softening of trend suggests the market may be entering a phase of relative stability, indicating that the network is close to a full detox of speculative interest, and is approaching an equilibrium baseline of users.

Live Professional Metric

We can further explore this thesis by performing a similar monthly vs yearly check on the Median Transfer Volume. This ratio attempts to capture changes in the momentum of retail participation relative to longer-term trend.

  • If the Monthly Baseline > Yearly Baseline it signals an expansion in retail participation.
  • If the Monthly Baseline < Yearly Baseline it signals a decline in retail participation.

Following the Great Miner Migration, a period of retail expulsion can be observed 🟪 which has been in effect for 426 days. This is a similar duration to the retail investor purge observed during the 2018 bear market, which persisted for 474 days before the monthly average recovered above the yearly average.

Live Professional Workbench

The final metric to inspect network activity is Miner Revenue from Fees. Miner Revenue from Fees is directly related to the level of demand for blockspace and thus network congestion, which has historically been a leading indicator for macro market trend reversal.

  • A sustained high fee regime indicates consistent and persistent demand for blockspace, elevated network usage, and suggests a constructive view on demand.
  • A muted low fee regime indicates a lack of demand for blockspace, minimal network congestion, and suggests a lacklustre view of network participation.

It is clear that the Bitcoin network remains in an extended muted fee regime, further confirming a recovery in demand is not yet underway. Network activity by and large remains a barren wasteland, with New Entity Adoption falling beneath cycle lows whilst a complete exodus of retail participation is most apparent.

Live Advanced Workbench

August Product Update Post

  • 5x Week On-chain Newsletters
  • 5x Market Pulse Reports
  • 4x New Assets supported
  • 24x New Ethereum Breakdown metrics
  • 5x New Bitcoin Supply and Derivatives Metrics
  • 19x New Workbench Construction Pre-set Metrics
August Product Update

A Full Detox

Next we will explore the volumes of lifespan destroyed in the network, often considers synonymous with tracking the smart old money vs the new and inexperienced money. Lifespan incorporates both the age, and the volume of the coins spent in an attempt to gauge amount of “stored time” expended.

The Spent Volume Age Bands metric provides a breakdown of on-chain transfer volumes into age bands to assess whether spending is dominated by old hands losing conviction, or not.

Here we isolate only coins of mature status (6-months+), which displays a clear compression within the current price structure. The dominance of mature coins being spent has collapsed from an exuberant 8% at the height of the bull in Jan 2021, to a distribution of just 0.4% of all volumes.

This suggests that the cohort of investors with older coins remain steadfast, refusing to spend and exit their position at any meaningful scale. Whilst this is constructive in that it displays HODLer conviction, with such a lacklustre demand profile as a backdrop, such an observation may be best interpreted as HODLers bunkering down for the storms ahead.

Live Advanced Metric

This sentiment is echoed by the Realized Capitalization HODL Waves metric which displays the USD Wealth held by individual age bands. With mature spending severely muted, the degree of HODLing behavior is historically high.

In a binary system of just Young and Mature coins, an increase in mature coin wealth held in BTC directly leads to an equivalent decrease in Young coin wealth.

Currently, wealth held by mature coins is at an ATH, due to the dominant investor behavior being a refusal to spend despite exceedingly uncertain global markets. Thus, almost all market activity is being conducted by the same cohort of young coins repeatedly changing hands. As the number of young churning coins incrementally decreases, it can lead to an eventual supply squeeze if and when the market tides turn.

Live Advanced Metric

The 90-day Coin Days Destroyed (CDD-90) metric assesses the total sum of coin day destruction over a 90 day period, helping to visualize periods of higher, and lower coin age expenditure.

CDD-90 has reset to what is effectively an all-time-low (ignoring pre-price history) signifying that older coins are essentially the most dormant they have ever been. This emphasizes the historically significant scale of HODLing which is taking place in the market, and adds weight to the case of extreme HODLing being the dominant investor behavior.

Live Advanced Metric

Revived Supply 1+ Years provides confirmation that the volume of latent supply re-entering the active supply is extremely low. This metric has been statistically normalized to highlight large deviations from the mean spending behavior. This can be considered under the following framework.

  • Deviations above 2 Sigma 🔵 indicates that a large volume of supply has been revived relative to historic values.
  • Deviations below 2 Sigma 🟠 indicates that the volume of latent supply which is returning to the market is statistically low.

This metric provides confluence with the observations above, where a compression in the spending of long dormant coins is clear, and large upside deviations are occurring less frequently.

Live Professional Workbench

We can also observe a stark contrast between the magnitude of revived supply in a bull market, compared to the prevailing bear.

  • As prices broke out above the $20k cycle high in 2020, a flurry of mature aged supply realized profits into market strength. With prices pushed into the $40k region, this +13.5 sigma deviation marked the cyclical maxima, and acted as a warning of potential oversupply. This can be similarly compared to 2018 price action, which recorded a peak deviation of +14 sigma.
  • As prices collapse back towards $20k in 2022, the market has responded with an opposite reaction, a sustained period of exceptionally low mature coin spending, and in fact the most quiet since the 2018 bear market lows on a statistical basis.

It is clear that owners that have held their Bitcoin through the volatility of the last year are simply not interested in selling at these price levels, having experienced the full spectrum of volatility and downside that Bitcoin is infamous for. It appears increasingly likely that the Bitcoin HODLers who remain, are strapped in, and willing to go wherever the Bitcoin ship takes them.

Live Professional Workbench

A Short-Term Holders Market

By assessing the structure of coin distribution, separated into both Short-Term and Long-Term Holders, we can ascertain 3 key observations:

  • Almost all coins acquired above $30k are successfully migrating into Long-Term Holder status 🔵 which are statistically unlikely to be spent in the face of further volatility.
  • The majority of coin churn is apparent around the current market price with the Short-Term Holders 🔴 jostling for the best entry price. This reflects both a recent capitulation, and an equal an opposite influx of demand within the current consolidation price range.
  • A large supply airgap is apparent below $18k until the $11-12k range. Trading below the current cycle low would put an extraordinary volume of Short-Term Holder coins into a deep unrealized loss, which may exacerbate downside reflexivity, and trigger yet another wide ranging capitulation event.

The Long-Term Holder cohort appear relatively unfazed by the price action of 2022, and their supply price distribution remains constructive. In contrast, the Short-Term Holder cohort are responsible for the majority coin movement, with a heavy concentration around the current market price. Thus, it is the STH cohort which is of the most of interest from here.

Live Metric in the Glassnode Engine Room

We shall initially assess their profitability across cycles, to better understand typical spending behaviors. This structure can be considered in the following three phases.

  • Phase 1: Collapse 🔴: This occurs after cycle tops as a rapid collapse in price actions sends the STH cohort into deep loss.
  • Phase 2: Compression 🟡 :  As prices collapse lower, STH profitability also compresses. Eventually a point is reached STH coins are clustered around spot prices, and thus their cost basis is in-phase with the market.
  • Phase 3: Expansion 🟢: With the STH cost basis now close the market price, any meaningful market rally puts large swathes of STH coins into an unrealized profit, triggering easier psychological conditions to HODL through.

STH profitability remains deep within phase 2 and has been here for 431 days, which is the longest duration out of any bear market cycle to date.

Live Professional Metric

To further isolate STH behavior, we introduce a new variant of the Market Realized Gradient Oscillator specifically related to STHs (the STH-MRGO). This is a statistically normalized oscillator, designed to measure relative changes in momentum between speculative value, and true organic capital inflows for the STH cohort. Again, three distinct phases can be identified:

  • Expansion 🟢:An expansion in momentum as speculative capital outpaces organic STH inflows, leading to prices climbing rapidly.
  • Collapse 🔴: As prices reach unsustainable heights, a collapse in price action becomes inevitable, leading to an initial wash-out of the STH cohort.
  • Transition Period 🟠: The momentum of price action and STH capital flows establish an in-phase equilibrium with price, as sellers become exhausted, and STH coins concentrate at what  becomes the eventual price range of the bear market bottom.

Based on the two charts above, it appears as though the STH cohort is approaching an equilibrium, which historically occurs in the latest stages of a bear market. The principle risk is that this large concentration of STH coins around the current price, becomes yet another dam to break, requiring a new equilibrium to be established.

Live Professional Workbench

Summary and Conclusion

Network activity remains in a dire condition as network adoption levels slump to levels last seen during the COVID crisis. However, one constructive observation would be the expulsion of retail participants from the network leaving just the HODLers class, career traders and everyday Bitcoin users remaining. This suggests the user-base is at its foundational level.

The HODLer class remain resolute with both mature coin USD wealth reaching ATHs, and a multitude of lifespan metrics fully resetting to historical lows, emphasizing the unwillingness to spend held coins. This suggests the majority of current market churn is associated with the Short-Term Holder class.

The Short-Term Holders find themselves at an equilibrium period where speculative market flows, and the STH cost basis are in-phase. With such a large concentration of supply in the current consolidation range, a risk remains of a levee break, should prices lose the June $17.5k lows.


Product Updates

All product updates, improvements and manual updates to metrics and data are recorded in our changelog for your reference.


Translated channels

We are proud to have launched new social channels for:


--

Disclaimer: This report does not provide any investment advice. All data is provided for information purposes only. No investment decision shall be based on the information provided here and you are solely responsible for your own investment decisions.