Product Update: August 2022


August has been another busy month for Glassnode metric, content, and product releases. A brief summary for the month is as follows:
- Week-on-Chain Newsletters (5x) covering the bear market rally, and speculation on the Ethereum Merge in derivatives markets.
- New Assets Supported (4x): APE, SHIB, SAND and stETH
- Ethereum transaction breakdown metrics (24x) exploring gas usage, and transaction demand for Stablecoins, ERC-20 Tokens, DeFi, NFTs, Bridges and Vanilla ETH transfers.
- New Metrics in Studio (5x) including Year-on-year supply change, and Options Implied Volatility Smiles
- Workbench Constructions: 12x Derivatives metrics, 6x Market Indicators, and 1x Miner Capitulation Risk Tool.
- New Market Pulse Reports (5x) including a new Workbench Constructions for Top and Bottom detection.
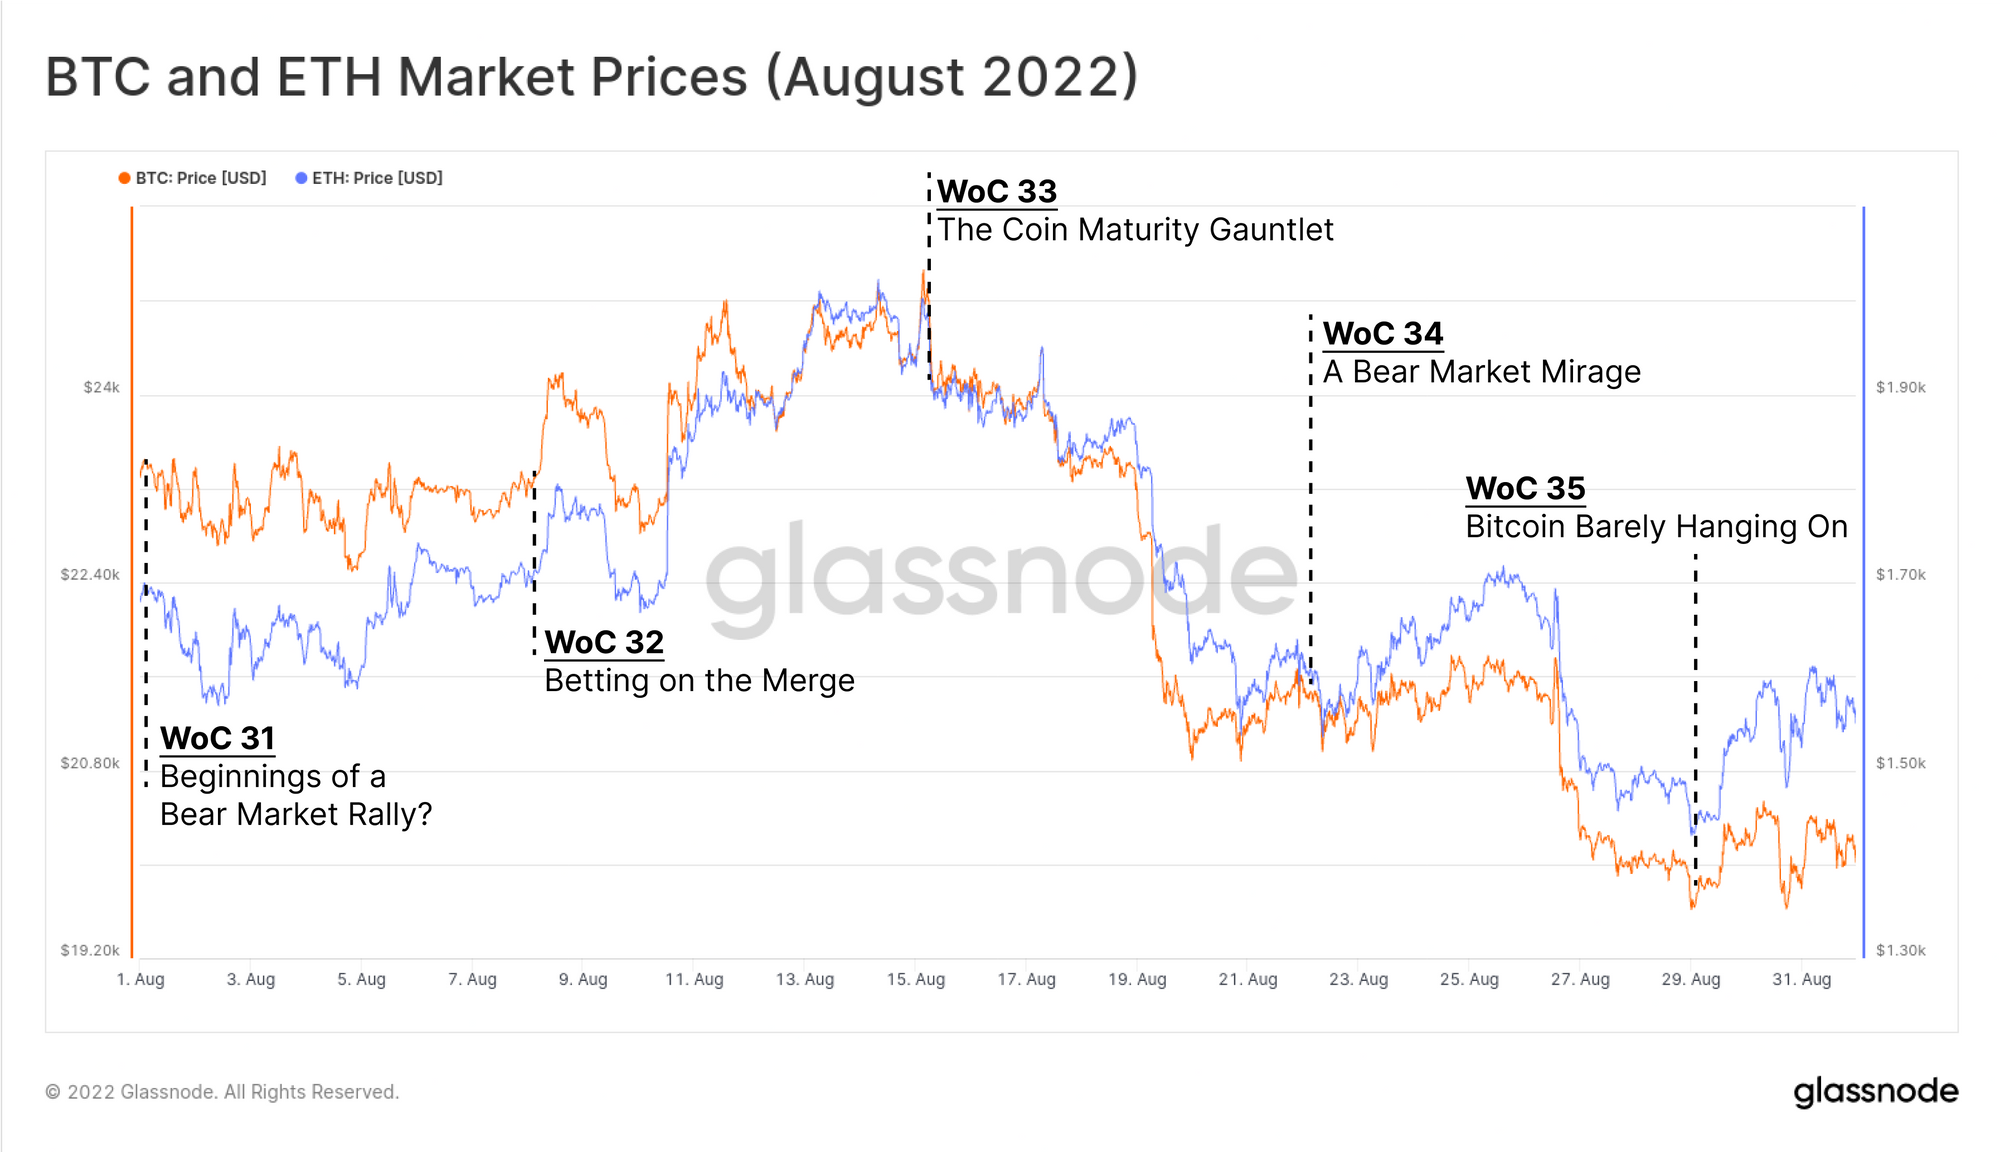
August was another volatile month for Bitcoin, with markets experiencing what appeared to be (WoC 31), and ultimately became a bear market rally (WoC 34). Prices traded off the local high of $24.5k, heading towards the consolidation range low at $19.5k. Additionally, we saw an enormous speculative premium enter Ethereum futures and options markets, as investors bet on a buy-the-rumour, sell-the-news style event (WoC 32).
For Bitcoin, we continue to see a dichotomy forming between Long-Term Holders, who are simply unwilling to spend and sell their coins (WoC 33), whilst Short-Term Holders continue to jostle for the best entry price. Aggregate demand metrics remain lacklustre, leaving Bitcoin markets hanging on by a thread (WoC 35).
The Week On-chain Newsletters Released
- WoC #31: Beginnings of a Bear Market Rally? (Report, Video)
- WoC #32: Betting on the Merge (Report, Video)
- WoC #33: The Coin Maturity Gauntlet (Report, Video)
- WoC #34: A Bear Market Mirage (Report, Video)
- WoC #35: Bitcoin Barely Hanging On (Report, Video)
New Assets Supported
We have released support for four new tokens:
- ApeCoin (APE)
- Shiba Inu (SHIB)
- The Sandbox (SAND)
- Lido Staked ETH (stETH)
New Ethereum Breakdown Metrics [T3]
This month we released a suite of 24x new Ethereum transaction breakdown metrics which explore both gas usage, and transaction demand for Stablecoins, ERC-20 Tokens, DeFi, NFTs, Bridges and Vanilla ETH transfers. Metrics are available in both Absolute and Relative denominations.
- Vanilla: Gas Usage by Vanilla Transactions (Absolute), Gas Usage by Vanilla Transactions (Relative), Vanilla Transactions (Absolute), Vanilla Transactions (Relative)
- Stablecoins: Gas Usage by Stablecoins (Absolute), Gas Usage by Stablecoins (Relative), Stablecoins Transactions (Absolute), Stablecoins Transactions (Relative)
- ERC-20 Tokens: Gas Usage by ERC-20 Tokens (Absolute), Gas Usage by ERC-20 Tokens (Relative), ERC-20 Tokens Transactions (Absolute), ERC-20 Tokens Transactions (Relative)
- DeFi: Gas Usage by Decentralized Finance (Absolute), Gas Usage by Decentralized Finance (Relative), Decentralized Finance Transactions (Absolute), Decentralized Finance Transactions (Relative)
- NFTs Gas Usage by NFTs (Absolute), Gas Usage by NFTs (Relative), NFTs Transactions (Absolute), NFTs Transactions (Relative),
- Bridges: Gas Usage by Bridges (Absolute), Gas Usage by Bridges (Relative), Bridges Transactions (Absolute), Bridges Transactions (Relative)
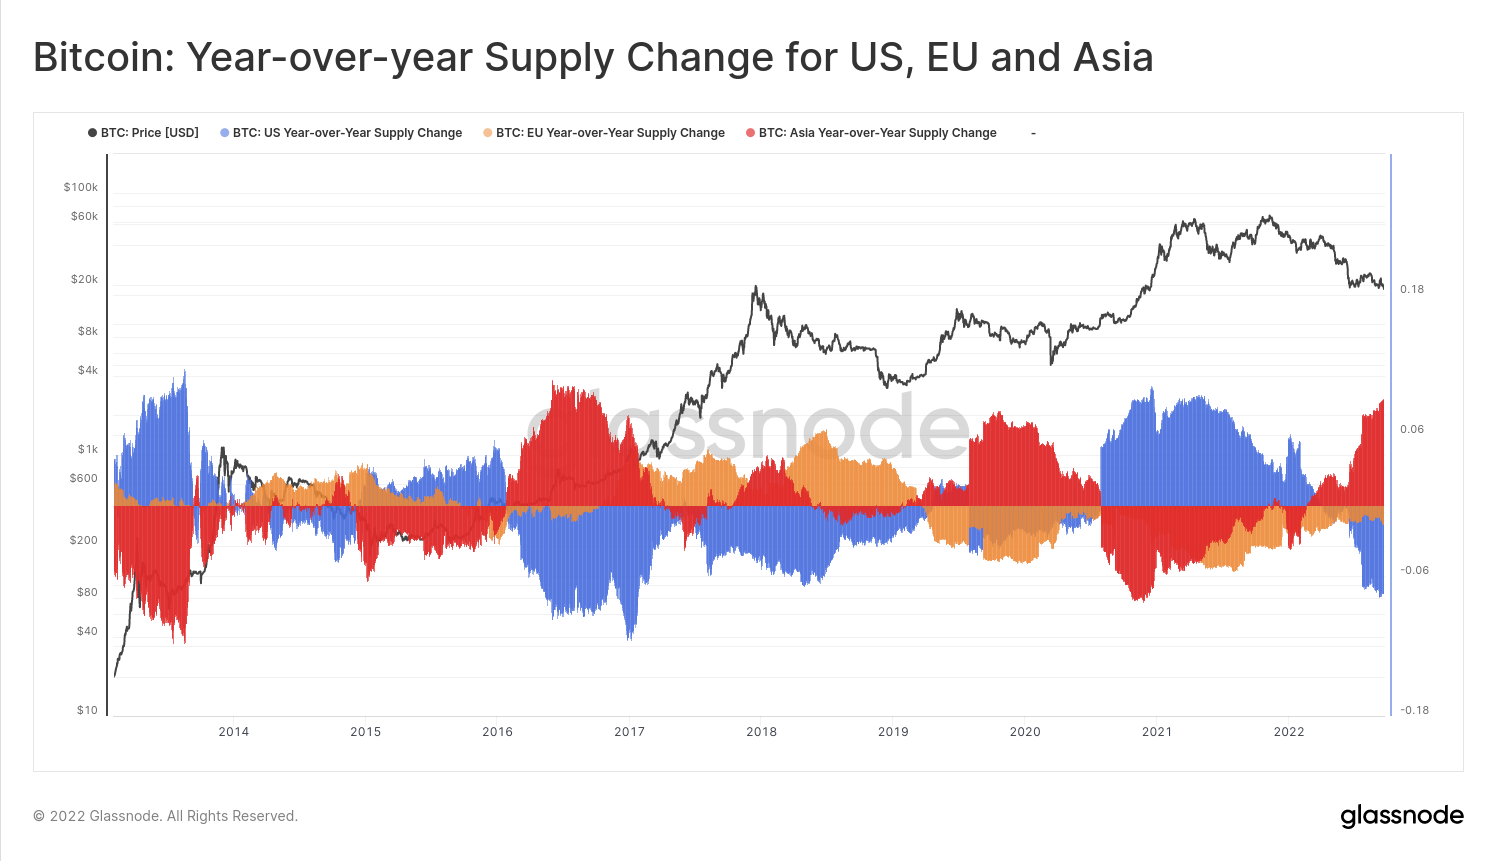
Bitcoin Year-over-year Supply Change metrics [T3]
We released three new Bitcoin metrics providing an estimate of the year-over-year change in the share of the Bitcoin supply to be held/traded in US, EU and Asia trading hours. Geolocation of Bitcoin supply is performed probabilistically at the entity level, where an entity's balance will only contribute to the supply in the respective region if the location can be determined with a high certainty.
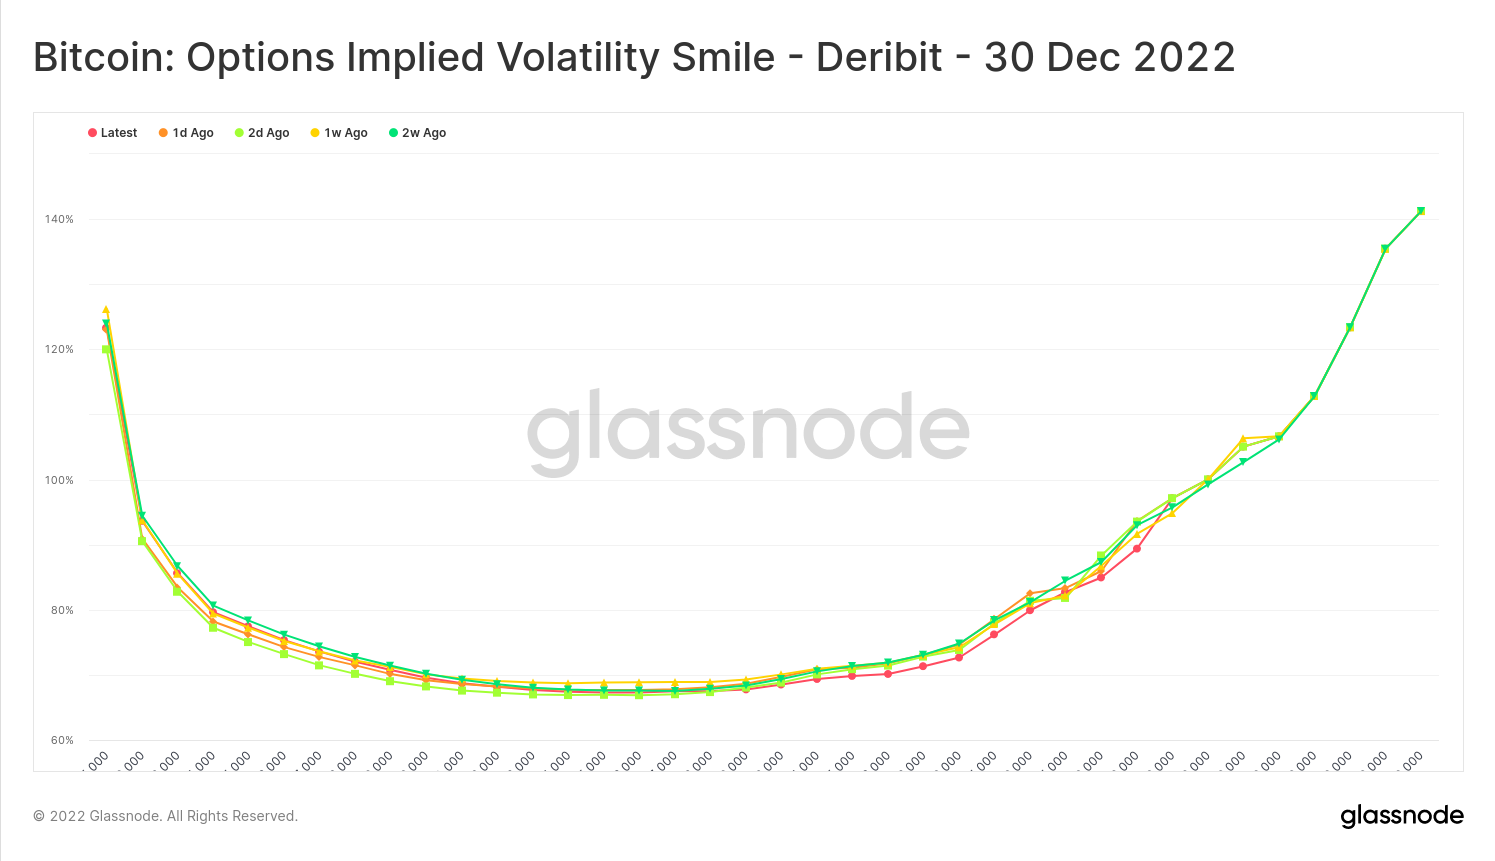
Options Implied Volatility Smile for BTC and ETH [T3]
Volatility Smile depicts the implied volatilities of options with different strikes for the chosen expiration date. The steepness and shape of this smile can be used to assess the relative expensiveness of options, and gauge what kind of tail risks the market is pricing in.
The Market Pulse is a new report series by the Glassnode team, available exclusively for Advanced and Professional members on Glassnode Forum. Market Pulse Reports provide unique insight into how we, as power-users, maximise value within the Glassnode suite. We explore both the creative, technical, and educational elements of on-chain and market concepts, accompanied by bespoke step-by-step Workbench demonstrations and guides.
Market Pulses Released
- A Bitcoin Utility Update: Using Network Utilization to Gauge the Market (Forum post)
- The Difference between Spent Outputs and Spent Volumes (Forum post)
- Understanding Network Participation through Means and Medians (Forum post)
- Using Glassnode Tools to Estimate Individual Miner Hashrate Share (Forum post)
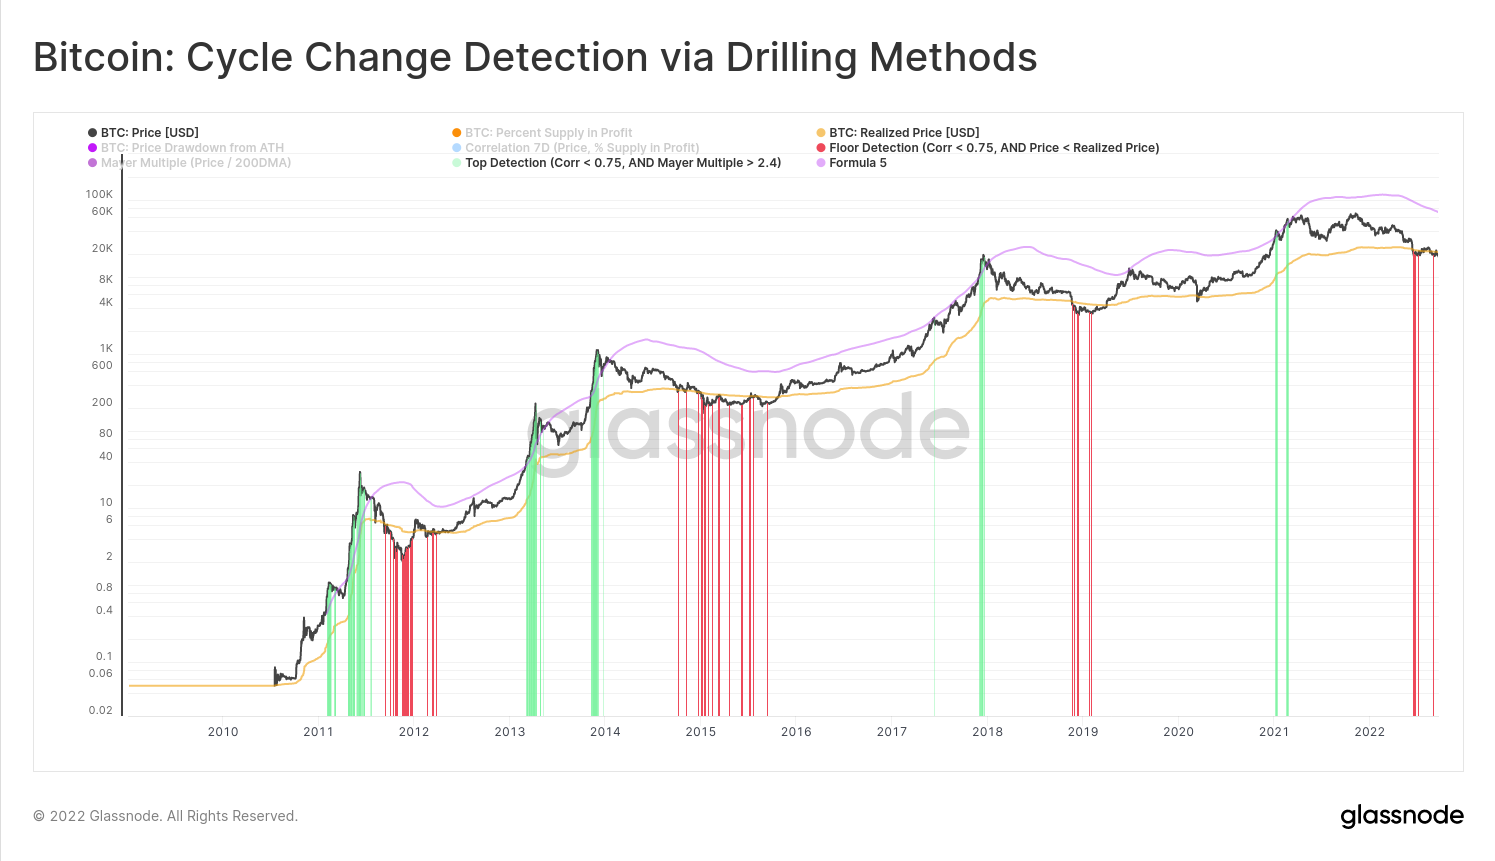
- Cycle Top/Bottom Detection using Drilling techniques (public post, Forum post, Chart)
The chart below is a Bitcoin cycle top and bottom detector, developed leveraging our analyst prior experience as engineers in hard rock drilling. It identifies price ranges where the correlation between investor profitability and price volatility break down, which tend to occur at market extremes. This post was released publicly on our Insights blog, and is now available as a live Workbench Construction.
Workbench is our premier tool for crafting bespoke metrics and visualizations, to elevate your Bitcoin, Ethereum, and crypto market analysis. This month we released new Workbench Constructions for 13x Derivative metrics,
Derivatives
- Annualized Perp Funding Rate vs 3m Basis (BTC, ETH)
- Perpetual Futures Dominance (BTC, ETH)
- Total Liquidations (BTC, ETH)
- Options Put/Call Ratios (BTC, ETH)
- Options Put/Call Open Interest (BTC, ETH)
- Options Put/Call Volume (BTC, ETH)
Market Indicators
- Bitcoin: Risk Reserve (Adjusted)
- Bitcoin Sell-side Risk Ratio
- Bitcoin: Relative Activity of Small and Large Entities
- Bitcoin 4yr CAGR
- Ethereum: 4yr CAGR
- Ethereum Monthly Returns
Miners
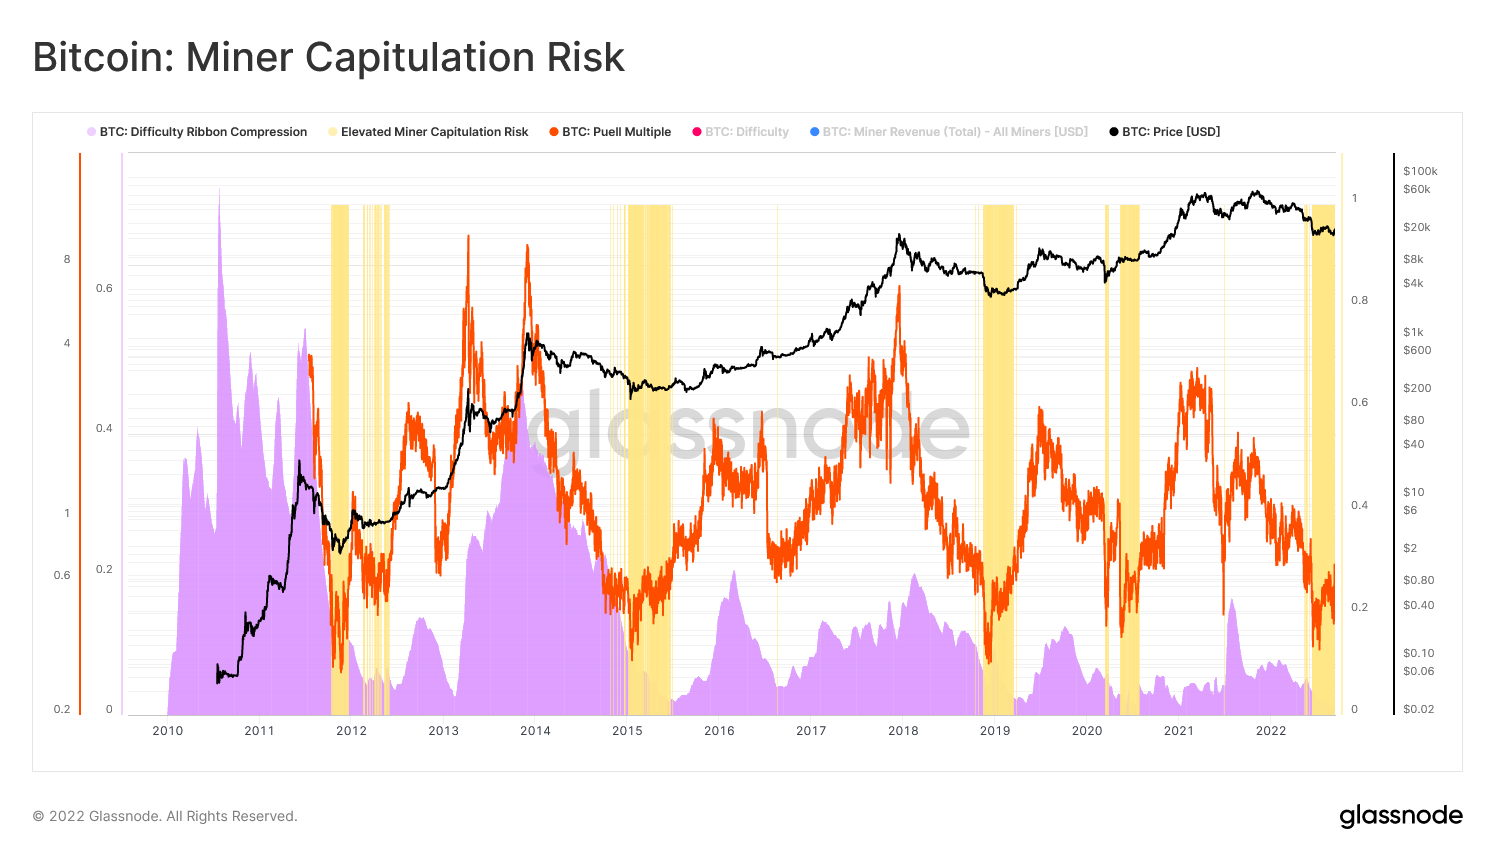
Construction of the Month: Bitcoin Miner Capitulation Risk
The miner capitulation risk tool is a two part model, which seeks confluence between implied miner income stress (Puell Multiple), and observed hashrate decline (Difficulty Ribbon Compression). It highlights periods where there is an elevated risk of capitulation in the mining industry, which may lead to the release of additional BTC volume from distressed miner balance sheets. The model is constructed as follows:
- 🟠 The Puell Multiple (PM) tracks aggregate miner income in USD, relative to the 1-year average. Values below 1.0 indicate that miner incomes are lower than the yearly average, with values below 0.6 typically associated with periods of elevated financial stress.
- 🟣 The Difficulty Ribbon Compression (DRC) signals when hashrate is coming offline, causing protocol difficulty to fall in a statistically significant way. This is an explicit observation that mining rigs are being switched off due to income stress, and becoming unprofitable.
- 🟨 Elevated Miner Capitulation Risk zones highlight periods where both metrics are signalling meaningful lows, and generally correlate with extreme bear market lows, and an elevated risk of miner capitulation events. A threshold of
PM + DRC < 0.65is selected as the definition of elevated miner capitulation risk.

- Follow us and reach out on Twitter
- Join our Telegram channel
- Visit Glassnode Forum for long-form discussions and analysis.
- For on-chain metrics and activity graphs, visit Glassnode Studio
- For automated alerts on core on-chain metrics and activity on exchanges, visit our Glassnode Alerts Twitter