Hammering Out The Bottom

Bitcoin has rallied back above the key $20k psychological level this week, after many months of extremely low volatility. In this edition, we analyse how Bitcoin may be hammering out a near-textbook bear market floor, and what risks may lay on the road ahead.

Hammering Out The Bottom

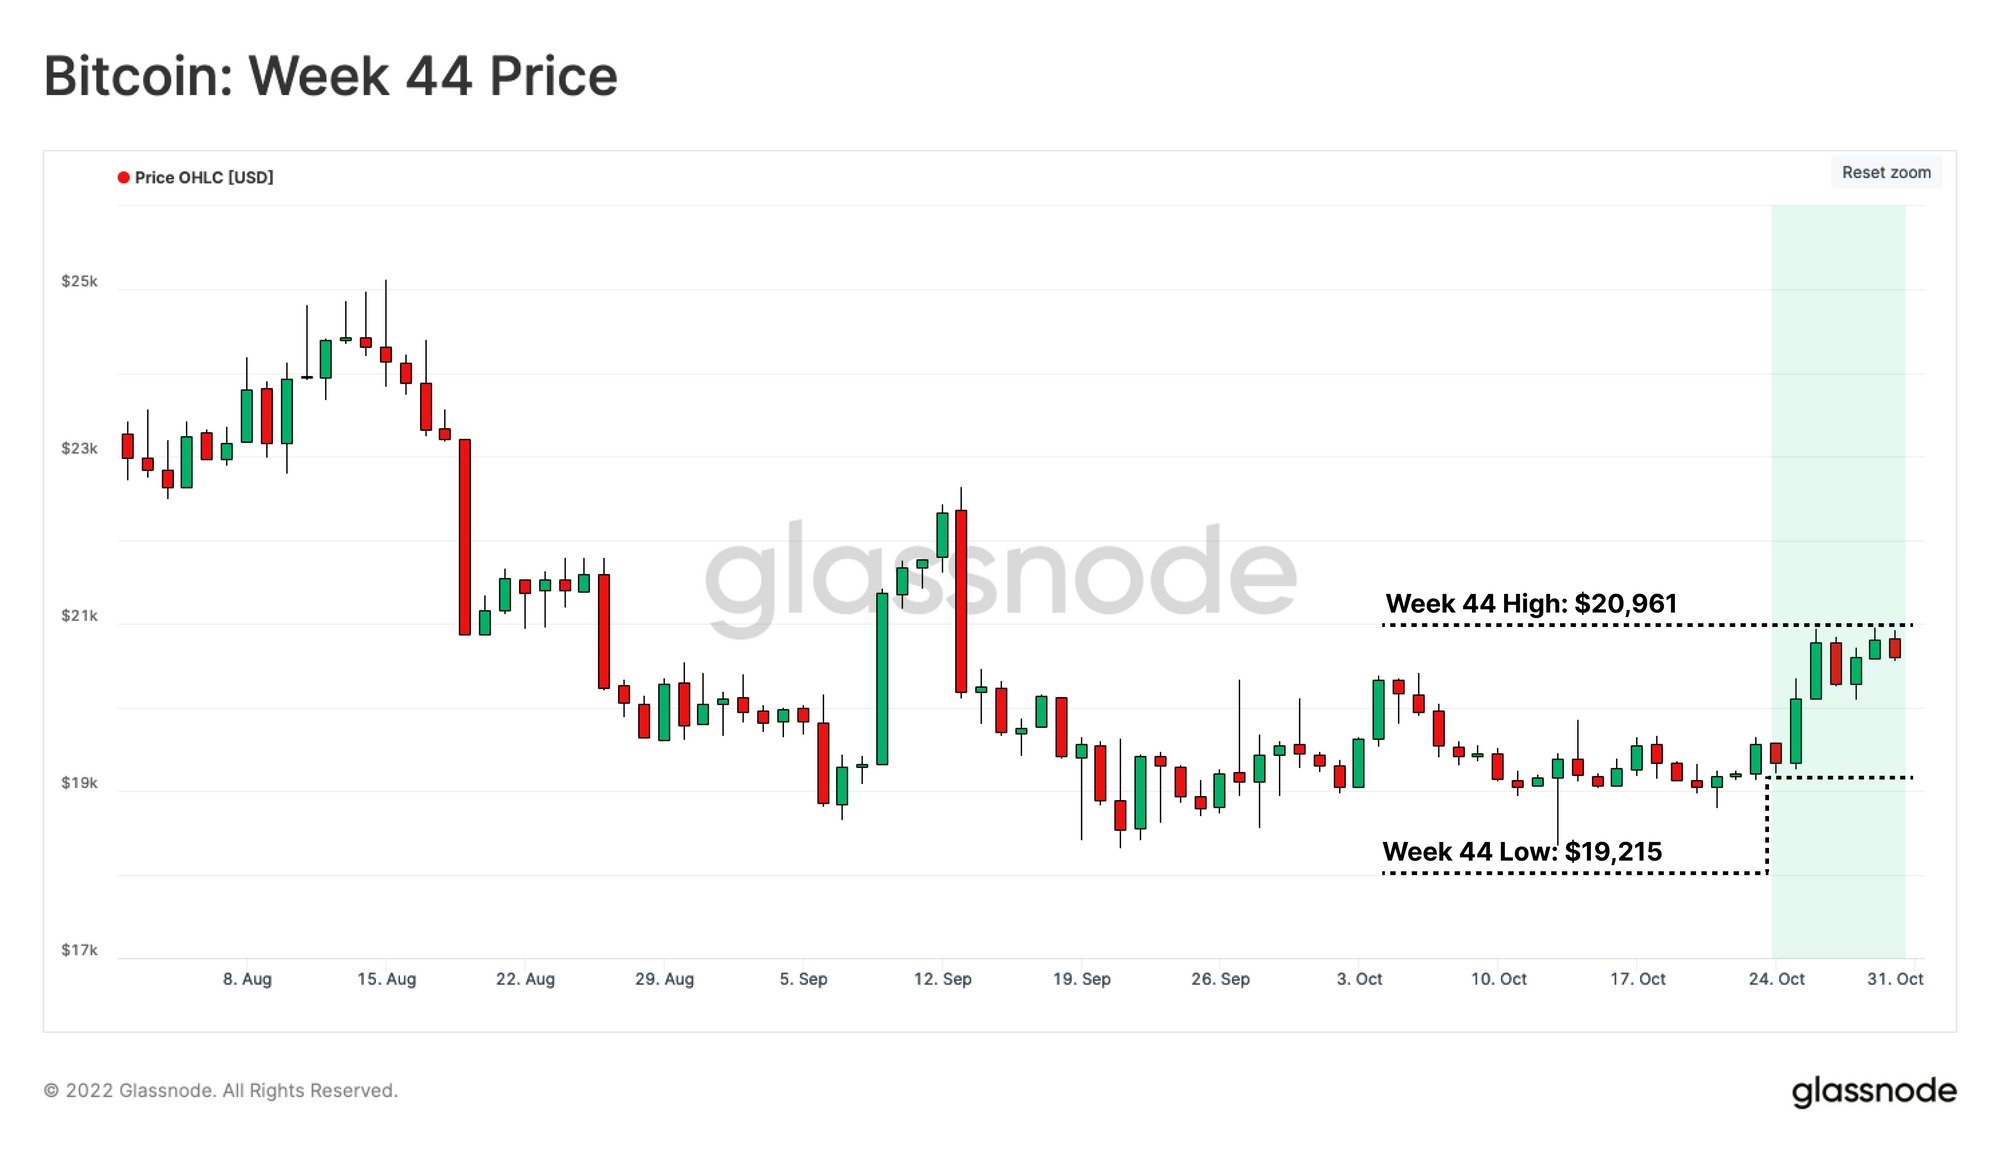
Bitcoin has rallied back above the $20k level this week, pushing off a low of $19,215, and trading as high as $20,961. After consolidating in an increasingly tight range since early September, this is the first relief rally in many months.

In this weeks edition, we will assess a suite of metrics which present a relatively consistent case for the market hammering out a Bitcoin bottom, with almost textbook resemblance to prior cycle lows. At this stage, the 2022 bear has inflicted severe financial loss, both on investors who have capitulated, and those who still weather the storm. The last remaining piece of the puzzle appears to be a component of duration, time, and ultimately, investor apathy.


Translations

This Week On-chain is now being translated into Spanish, Italian, Chinese, Japanese, Turkish, French, Portuguese, Farsi, Polish, Arabic, Russian, Vietnamese and Greek.

The Week Onchain Dashboard

The Week Onchain Newsletter has a live dashboard with all featured charts available here. This dashboard and all covered metrics are explored further in our Video Report, which is released on Tuesdays each week. Visit and subscribe to our Youtube Channel, and visit our Video Portal for more video content and metric tutorials.


Hammering Out The Bottom

In our previous WoC 41 report, we described the market conditions of the Bottom Discovery phase, particularly following a significant capitulation through the primary bear market floor (shown in dashed lines). This phase 🟪 has historically seen prices range bound between two well-known floor-tracking models:

  • Realized Price 🟠: which can be considered as the average acquisition price per coin for the wider market. When the spot price trades below the realized price, the aggregate market can be considered to be in unrealized loss.
  • Mayer Multiple Lower Band (0.6*200 DMA) 🟢: The Mayer Multiple is simply the ratio between price and the 200D-SMA, a widely observed model in traditional financial analysis. This metric helps gauge over, and under-bought conditions, with cyclical oversold conditions historically coinciding with Mayer Multiple values below 0.6.

Remarkably, this pattern has repeated in the current bear market, with the June lows trading below both models for 35 days. The market is currently approaching the underside of the Realized Price at $21,111, where a break above would be a notable sign of strength.

Live Advanced Workbench-

After identifying initial signposts for a typical bottoming formation, the next step is to define a potential range of price fluctuation for this stage of the bear market.

Two ideal candidates for approximating the range bottoming formation are the aforementioned Realized Price (Upper Band ~$21.1k) 🟠, as well as the Balanced Price (Lower Band ~ 16.5k) 🔵. Balanced Price represents the difference between Realized Price and Transferred Price (coinday time-weighted price). This can be thought of as a form of a “Fair Value” model, capturing the difference between what was paid (cost-basis) and what was spent (transferred).

Compared to historical precedence, price has traded within this range for ~3 months, in comparison to prior cycles which lasted between 5.5 and 10 months. This suggests duration may remain a missing component from our current cycle.

Live Advanced Workbench

Product Updates

October was an exciting month at Glassnode, as we announced our acquisition of Accointing.com, and continued to release suites of new metrics, workbench constructions, dashboards, and more. See our latest Product Update for October for a full overview.

October Product Update

Coins Changing Hands

As highlighted in July (WoC 28), throughout the Bottom Discovery phase, diminishing investor profitability results in the redistribution of coin wealth, as weaker hands capitulate into extreme financial pain. This progressive changing of hands can be analyzed by tracking the UTXO Realized Price Distribution (URPD), which illustrates the distribution of supply based on the acquisition price.

The magnitude of wealth redistribution can be highlighted by monitoring the change in the volume of coins with an acquisition price within the two pricing models highlighted above. The following two charts compare the URPD on the entry, and exit dates for the 2018-19 bear market:

  • URPD as of 19-Nov 2018 when price first broke below the Realized Price.
  • URPD as of 2-Apr-2019 when price broke out above the Realized Price.

During the 2018-2019 bottom discovery phase, around 22.7% of the total supply (30.36% - 7.65%) was redistributed as spot prices traded within in the aforementioned range.

Live Professional Chart

Performing the same analysis in 2022, we can see that around 14.0% of supply has been redistributed since the price fell below the Realized Price in July, with a total of 20.1% of supply now having been acquired in this price range.

Compared to the end of the 2018-19 cycle, both the magnitude of wealth redistribution, and the final supply concentration at the bottom are somewhat lower in the 2022 cycle. This adds further evidence to the case that additional consolidation and duration may still be required to fully form a bear market floor.

That said, the redistribution which has occurred to date is significant, and certainly indicates that a resilient holder base is actively accumulating within this range.

Live Professional Chart

Seeking the Light

With many longer-term components of a bear market floor in play, the next step is to introduce a series of indicators which are useful for mapping out a potential transition back towards a bull market. The Percent of Supply in Profit metric can be used to establish three distinct states of each market cycle:

  • Euphoria (Profit-Dominance) 🟩: When a parabolic price uptrend is in play during the bull market, the Percent of Supply in Profit exceeds 80%.
  • Bottom Discovery (Loss-Dominance) 🟥: At the twilight of the bear market, when an extended period of price depreciation causes the share of supply in loss to become dominant (Percent Supply in Profit < 55%)
  • Bull/Bear Transition (Profit-Loss Equilibrium) 🟧: The transition periods between the two prior conditions, where Percent Supply in Profit remains between 55% and 80%.

At present, the Percent of Supply in Profit is at 56%, which indicates that the recent price recovery above $20k is at the lower bound of the transitional phase, signalling that an appreciable redistribution has occurred below $20k to date.

Live Advanced Workbench

We can also assess the implied financial strain on the Long-Term Holder (LTH) cohort and their corresponding reaction.

During the late stages of a bear market, a pattern that is congruent through all cycles is the capitulation of a sub-set of the LTH cohort 🟥. These capitulations are identified by periods where the aggregate LTH Cost Basis 🔵 is above than the overall market cost-basis Realized Price 🟠. This means that the average Long-Term Holder, who has weathered the full cycles volatility, has actually underperformed the wider market.

This condition of acute financial stress has been in play for 3.5 months so far, which is shorter than similar intervals in previous bear markets. However, note that this condition is usually in play until well into the bull market transition.

Live Professional Workbench 

Confirming the ongoing stress on Long-Term investors, we can define a simple but powerful compass to spot early indications of new demand entering the market 🟩.

When the capital inflow of new investors (Short-Term Holders) begins to exceed sell side pressure, the aggregated profit held by the wider market will exceed that of the Long-Term Holder cohort.

Interestingly, we have not yet observed this shift in profitability, with the Percent of LTH Supply in Profit 🔴 currently at 60%. Considering the total Percent Supply in Profit 🔵 is at 56%, in order for this model signal to signal a recovery 🟩, spot prices likely need to reclaim the $21.7k level.

Live Professional Workbench

Embracing Losses

So far, we have assessed the market from the holders perspective (the unrealized profit/loss). The aforementioned shift in momentum can also be examined from the active investors point of view (realized profit/loss).

To accomplish this goal, we utilize the Realized Profit/Loss Ratio metric, which measures the ratio between the volume of coins moved in profit to those coins that are transferred in the loss. Tracking the quarterly average of this metric enables analysts to gauge the macro dominance of coins moving in profit.

  • Profit Dominant Regime > 1 🟩: At the early stages of the bear markets, and throughout the bull run, demand is strong enough to adsorb selling pressure, and profits exceed losses by a wide margin.
  • Loss Dominant Regime < 1 🟥: During the extended phase of the bear markets, where the supply side is not met with sufficient demand. This generally culminates as a large-scale capitulation event, which acts to entice smart capital back into the system.

The interval between dropping below, and reclaiming the 1.0 level, is often where bearish sentiment is at its peak and demand liquidity at its lightest 🔵.

The 90D-SMA of Realized Profit/Loss Ratio typically collapses and remains below 1.0 mid-way through a bear, but before ultimate capitulation, providing an early warning signal. Moreover, this metric has historically recorded a sharp cross over the 1.0 level in early bull phases.

At the current state, this indicator is at 0.57, denoting the dominance of coins moving at a loss remains. Therefore, the new wave of capital, and profit taking has not yet fully eclipsed the magnitude of sellers realizing losses.

Live Advanced Chart

As the final piece of this investigation, we aim to analyze the magnitude of Realized Losses. To account for the rising market capitalization each cycle, we normalize Realized Loss by the market cap to produce a Relative Realized Loss metric. Next, we can construct an indicator using the the Monthly 🔴 and Yearly 🔵 sum of Relative Realized Loss to identify shifts in momentum, and significant capitulation events.

During the last three bear markets, the monthly value has abruptly peaked above the yearly during two distinct periods of extreme realized loss.

  • Post-ATH Wave (A): At the early stages of a bear market, when a top-heavy market undergoes its first large wave of loss realization during the post-ATH sell-off.
  • Bottom Discovery Wave (B): Late stage bear markets often culminate with a major capitulation event, where a significant wave of loss realization occurs, and peak negative sentiment is reached. This wave is often intensified by the stress of the time component of establishing a market floor, until sellers finally hit exhaustion.

Revisiting the historical instances of this pattern, it is evident that both A/B waves of loss realization have occurred at scale. The second wave B is usually of a much higher magnitude, and is often followed by a notable descending trend in the yearly trace 🔵. This is the result of the market reaching peak apathy and seller exhaustion.

These are the constructive signs of the market embracing the financial pain inflicted on remaining investors by both the time, and price components. However, the final condition before a convincing transition towards a bull market is a substantial decline ↘️ in the yearly cumulative trend.

Live Advanced Workbench

Summary and Conclusion

In this edition, we have leveraged multiple floor-price tracking models and demonstrated that the market certainly appears to be in a near textbook example of a Bitcoin Bottom Discovery phase. The Balanced Price ($16.5k) and Realized Price ($21.1k) have once again helped establish range-bounds while the market hammers out a foundational floor.

The portion of supply which has changed hands and been repriced so far is significant, although smaller in magnitude compared to the 2018-19 lows. We also demonstrate that across several metrics, the 2022 floor lacks a degree of duration, and perhaps an additional phase of redistribution is needed to test investor resolve.

From both the Unrealized and the Realized Profit/Loss standpoints, the results indicate that a fragile but constructive balance between supply and demand exists in the market. However, the network has not yet experienced a convincing influx of new demand yet. It does not appear that the bear-to-bull transition has formed as yet, however, there does appear to be seeds planted in the ground.


Translated channels

We are proud to have launched new social channels for:


Disclaimer: This report does not provide any investment advice. All data is provided for information purposes only. No investment decision shall be based on the information provided here and you are solely responsible for your own investment decisions.