A Rally Off the Bear Market Lows

After the market rejected a rally to $24.5k, Bitcoin prices have dropped to $18.5k setting the second lowest low of the bear cycle. This has plunged over 11.8% of the supply back into an unrealized loss, allowing us to survey the risk of downside, and the possibility of bottom formation.

A Rally Off the Bear Market Lows

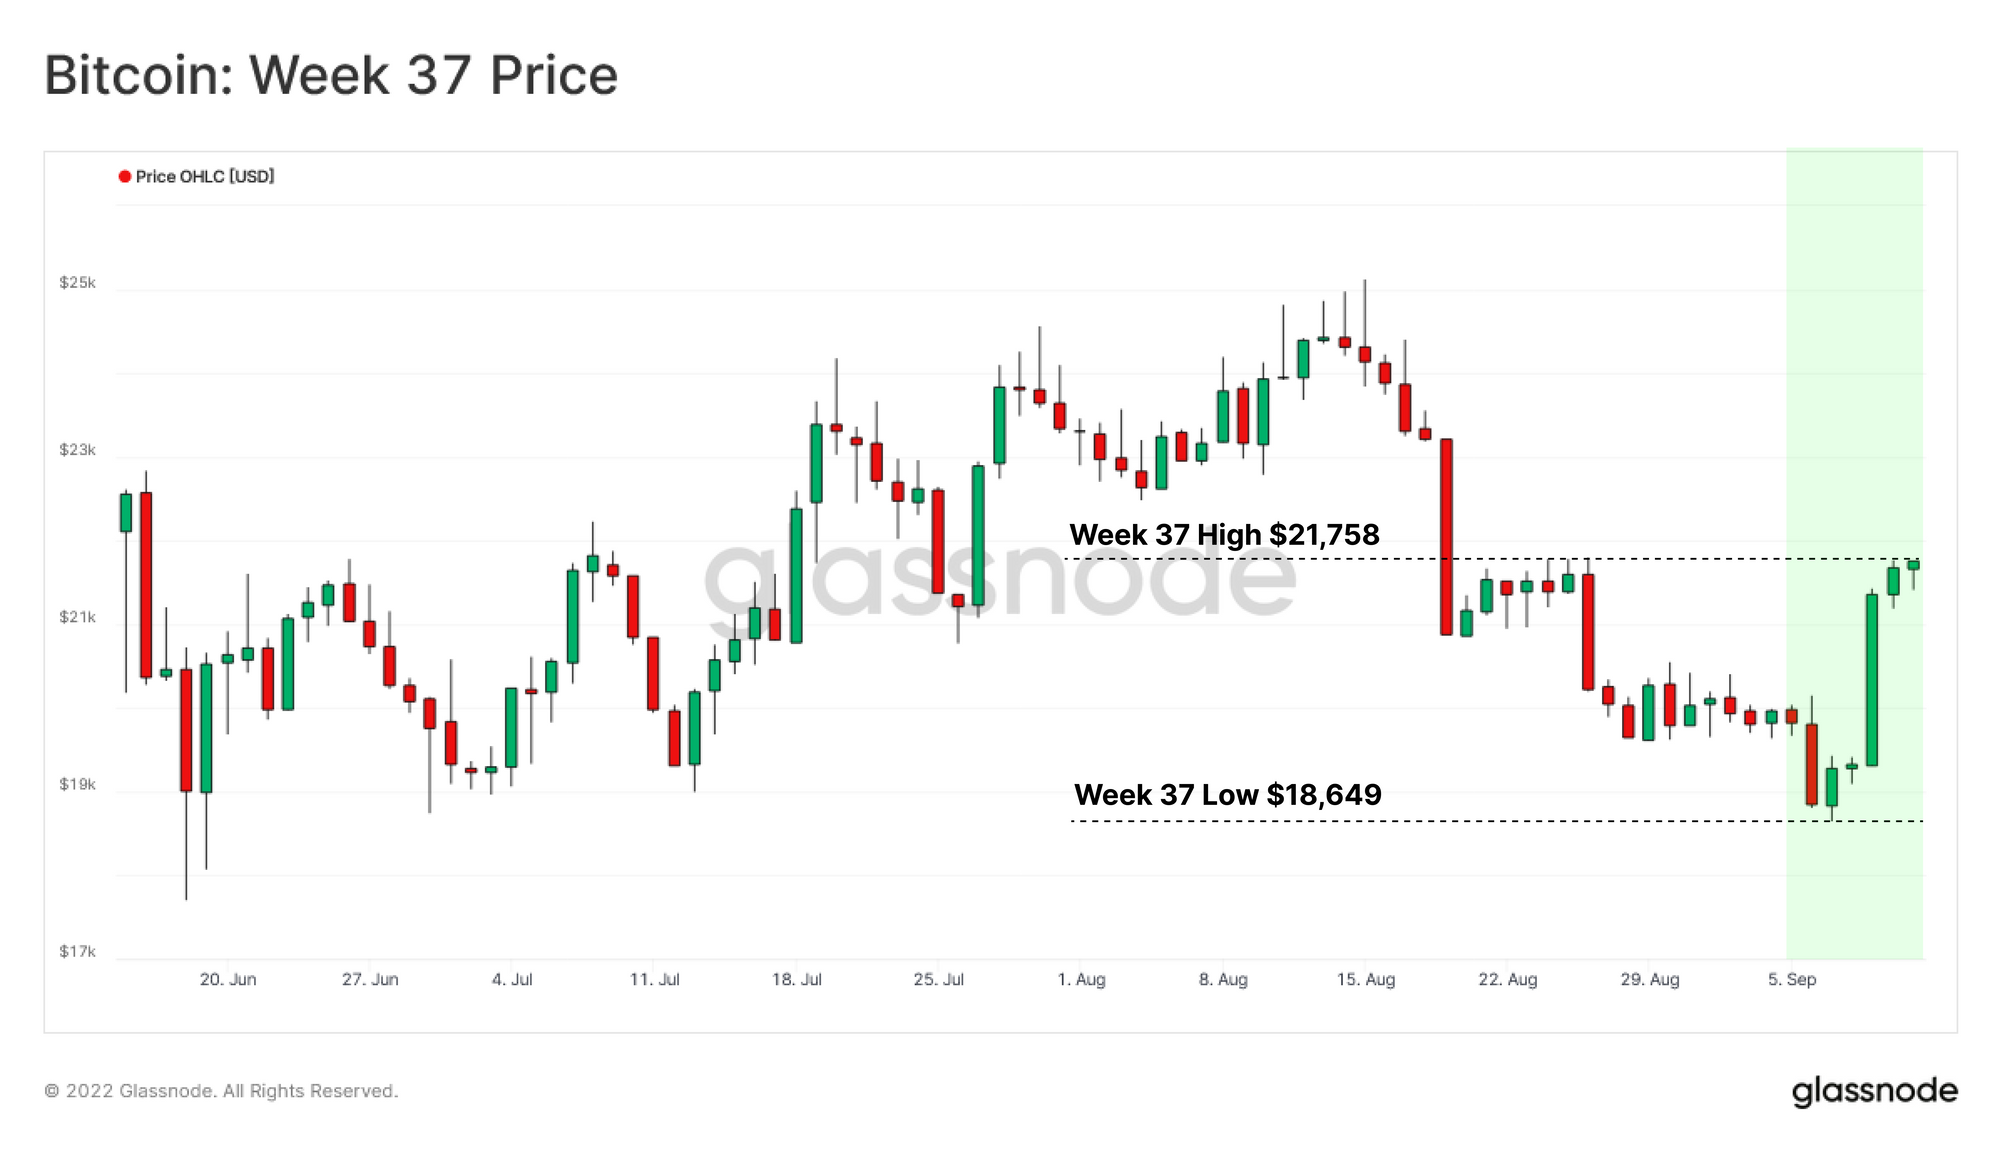
Bitcoin markets have experienced a powerful rally, bouncing off the second lowest low ($18,649) of the prevailing bear market. Prices peaked at $21,758, but remain firmly within the consolidation range which has now been established for more than three months.

Since mid-August, the market has been trading down from the consolidation rage high, which peaked at around $24.5k. As the market reaches towards the range low this week, we have an opportunity to observe the volume of coins that flipped from an unrealized profit (at $24.5k) to an unrealized loss through this process. These moments provide valuable insight on to the degree of coin accumulation, and cost basis concentration within an established consolidation range.

In this edition, we will zoom in on this concept of on-chain cost basis, and changing coin profitability. We will also analyze a very rare event, where three ~5k BTC whale sized transactions, aged 7y-10y, were spent over recent weeks. These coins were accumulated back in Dec-2013, realizing over $163M in profit.


Translations

This Week On-chain is now being translated into Spanish, Italian, Chinese, Japanese, Turkish, French, Portuguese, Farsi, Polish, Arabic, Russian, Vietnamese and Greek.

We are also proud to have launched new social channels for:


The Week Onchain Dashboard

The Week Onchain Newsletter has a live dashboard with all featured charts available here. This dashboard and all covered metrics are explored further in our Video Report, which is released on Tuesdays each week. Visit and subscribe to our Youtube Channel, and visit our Video Portal for more video content and metric tutorials.


Discounts Across the Board

Bitcoin has now been within a persistent market downtrend for ten months since the ATH in November 2021. This week, Bitcoin spot prices touched the $18,649 level, marking the second lowest local low at a 72.5%  drawdown from the cycle top. Compared to prior bear cyclical bottoms, the 2022 contraction has not been as significant on a percent drawdown perspective. The lows in 2015, 2018 and 2020 reached over 77%+ drawdowns from ATH.

However, even with a lower drawdown magnitude, the scale of financial loss in this bear market can be reasonably argued to be the largest in history (covered in our June Report).

Live Advanced Chart

In this edition, we will assess the current market structure using a framework, of weighing spot prices against the cost basis of distinct cohorts of market participants:

  • Overall Market (MVRV) 🟠: Measuring the ratio of spot price and the on-chain cost basis of all investors in the market
  • Long-Term Holders (LTH-MVRV) 🔵:  Calculates MVRV considering only Long-Term Holders, owning coins older than 155 days on average, and statistically the least likely to spend.
  • Short-Term Holders (STH-MVRV) 🔴: Calculates MVRV considering only Short-Term Holders, owning coins younger than 155 days on average, and statistically the most likely to spend.

Historically, bottoming formation coincides with spot prices trading below all three of the aforementioned cost basis (i.e. MVRV < 1.0, WoC 25). This indicates a point in time where all cohorts are, in aggregate, holding an unrealized loss 🟪.

The current bear market has spent 56 days in this condition, despite a brief bounce back above the Realized Price and Long-Term Holder variant. Compared to the typical duration of ~190-days below the Realized Price in previous bear markets, 56-days remains a relatively short period of time.

In line with our June report, the lowest STH-MVRV values recorded this cycle are lower than during the Dec 2018 capitulation, suggesting that Short-Term Holders in particular, have experienced a historically large degree of financial pain.

Live Professional Workbench

Next, we can compare the average acquisition price per coin for the STH cohort (🔴) against the LTH average acquisition price (🔵), to compare financial stress levels. Throughout the bear, persistent price depreciation leads the STH Realized Price to fall below the LTH Realized Price 🟪.

Such events only occur during the late stage of bear markets, and denote periods where the average cost of acquisition over the past 155 days, is now more advantageous than the average long-term holder cost basis. This is synonymous with a capitulation, where coins purchased near the cycle top are sold and change hands at much lower prices.

Despite a 10-month downtrend, this bear market has not yet reached this cross-over stage. Previous bears took between 145 days and 339 days to recover after such a cross-over. by Given the trajectory of these two realized price traces, we can expect a cross-over by mid-September.

Live Professional Workbench

The market recently rejected the rally above $24.5k, giving us an opportunity to observe the volume of coins that have fallen from profit, back into an unrealized loss.

Core Concept: Sharp price moves off the highs or lows of a consolidation range can be exceptionally rich in analysis value. These events highlight the volume of coins which swapped between holding an unrealized profit to an unrealized loss (or vice-versa). Metrics like Percent Supply in Profit can therefore be used to measure the volume of coins which changed hands within that concentrated price range.

Since mid-August, the total Percent Supply in Loss jumped by 11.8%, reaching 48.1%. As shown in the figure below, the contribution of Short-Term Holders 🟥 (9.3%) is significantly higher than Long-Term Holders 🟦 (2.5%). This difference highlights the rising momentum of capital inflow in the period since spot prices crashed below the Realized Price in early Jun.

In other words, this high concentration of STH coins between $24k and $18.5k shows that 9.3% of the coin supply has recently transacted, suggesting both capitulation, and an equivalent demand inflow within this price range. It also highlights a risk, in that a large volume of investor coins (48.1% of supply) are underwater below $18.5k, and 11.8% of supply has a cost basis between $18.5k and $24.5k.

Live Professional Metric

Next, we will explore the Realized Profit/Loss Ratio metric, which measures the ratio between the volume of coins moved in profit, to those coins that are transferred in loss. Tracking the monthly average of this metric enables analysts to gauge shifts in market momentum, and sentiment, and to characterise the dominant profile of coins which are on the move.

  • Profit Dominant Regime>1 🟩: At the early stages of the bull markets, where new demand is strong enough to adsorb selling pressure, and profits are taken at scale. This metric has historically recorded a sharp cross over the 1.0 level in early bull phases.
  • Loss Dominant Regime < 1 🟥: During the extended phase of the bear markets, where the supply is not met with sufficient demand until the ultimate capitulation takes place. This indicator typically collapses and remains below 1.0 mid-way through a bear but is usually before capitulation, providing an early warning signal.

The interval between dropping below, and reclaiming the 1.0 level, is where bearish sentiment is at its peak, and due to inadequate demand liquidity. From a qualitative standpoint, the current Low Liquidity regime began ~4 months ago, and can be compared to the 6-month period experienced in the 2018-2019 bear.

An interesting observation is the upward trend which initiated in early June, and peaked in mid-August, having since descended to 0.58. This pattern reconfirms that an uptick in profit taking took place by investors during that relief rally (explored more in WoC 35).


🔔 Alert Idea: Realized Profit/Loss Ratio (30DMA) breaking above 1.0 could signal recovery of investor profitability, and signal a constructive influx of new demand.

Live Advanced Metric

New Content: Before The Merge - Analyzing the Ethereum Beacon Chain

The #Ethereum Merge is now on the horizon, expected to happen this week. In our latest collaboration with CoinMarketCap, we explore a suite of new Proof-of-Stake metrics to detail network performance. Read our new report profiling the Beacon Chain.

Before The Merge - Analyzing the Ethereum Beacon Chain

Bear Market Volatility

The picture portrayed so far highlights the significant role of Short-Term Holder behavior in recent price moves. Therefore, as a key cohort of interest, assessment of STH spending is paramount for identifying a resilient bottom formation. A core tool to examine Short-Term Holders’ profitability is the Short-Term Holder SOPR, indicating the average profit multiple on spent coins.

The STH-SOPR structure provides a strong compass for mapping different bear market stages:

A) Post-ATH Phase 🟥: The heavy loss realization after the ATH bubble bursts manifests as an abrupt plunge to levels below 1, usually followed by a volatile market regime.

B) Bear Market Rallies 🟦: As the bear market progresses, a fragile equilibrium forms as a by-product of weak demand, and new supply as holders seek exit liquidity. This stage is set for numerous bear market rallies, peaking at various profit and loss levels, but all ultimately failing to sustain breaks higher.

C) Post-Capitulation 🟨: As the time component of bear markets starts to exhaust investors psychologically, the potential of a capitulation event rises accordingly. Following this wash-out, a period of recovering profitability, and a SOPR uptrend often follows.

The June 2022 sell-off has many similarities to phase C, and the recent $24k rejection showed a convincing underside retest of STH-SOPR = 1.0, showing investors sold at their cost basis. Underside rejections like this are typical of bear market formation patterns.


🔔 Alert Idea: Short-Term Holder SOPR and/or aSOPR breaking above 1.0 could signal a recovery of investor profitability and an improvement in underlying market strength.

Live Professional Metric

We can use the STH Supply Profit/Loss Ratio metric to assess the behavior of STHs during the transition from a bear to a bull market. This indicator measures the ratio of STH unspent coins in profit to those in the loss, a similar idea to SOPR, however, using unspent (held) coins rather than spent coins.

We can identify extremes in short-term holder market conditions:

  • STH-Supply Profit/Loss Ratio > 1 🟩: During bull markets, more than half of short-term holders’ supply stays in profit, leading this ratio to fluctuate above 1. Higher values indicate a larger incentive for profit taking.
  • STH-Supply Profit/Loss Ratio < 1 🟥: Throughout bear markets, this ratio trades below 1 since the short-term holder supply is primarily in loss. Lower values indicate a larger probability of capitulation and where capitulation has taken place, preceding a strong recovery upwards.

Utilizing the 1.0 level as a reference point, we can anticipate potential pivot points for counter-trend events, such as bull market corrections, or bear market rallies. The recent rejection by the $24k level (❌) was an example of a possible turning point for the bear market rally, which failed to gain momentum. However note the ascending lows of late, which is similar in structure to STH-SOPR, suggesting a slow, but observable recovery could be underway.


🔔 Alert Idea: Short-Term Holder Supply Profit/Loss Ratio breaking above 1.0 could signal a recovery of investor profitability, and an improvement in underlying market strength.

Live Professional Metric

Old Whales Come Back to Life

Bitcoin bear markets have the ability to flush out even the most steadfast investors. This regime of Low Profitability for LTHs can be observed via LTH-SOPR. Historically, a sharp break back above 1 has signalled the transition back to bullish momentum in the market.

Compared to 11 months of Low Profitability in the 2018-19 bear market 🟥, the current market has LTH-SOPR trading below 1 for just 4 months. Occasionally, we can observe an abrupt spike higher in LTH-SOPR 🟦. These sudden spikes are usually attributed to the transfer of a large volume of older coins, which realize historically large profits.


🔔 Alert Idea: Long-Term Holder SOPR breaking above 1.0 could signal a recovery of investor profitability, and an improvement in underlying market strength.

Live Professional Metric

Generally, decoding these events requires detailed investigation via detailed blockchain data science. In the next section, we will detail an analysis associated with the recent expenditure of three UTXOs, which contained over 5,000 BTC each, were all acquired in December 2013, and when bitcoin prices were $543.

First, to underline the significance of the recent bounce in LTH-SOPR, we can refer to the following chart presenting the daily spent volume of 7-10 Years old coins. Remarkably, there are only 11 instances in history where the daily volume of 7y-10y old coins crossed over 4k BTC/day, with three of them in the last two weeks.

Live Advanced Metric

The highlighted transactions can be characterized as follows:

  • A- Block # 751518, 28-Aug-2022 ($19.6k), Spending 5,000 BTC (1,500 BTC to an unknown receiver and 3,500 BTC to Kraken), Original Purchase Date: 19-Dec-2013 ($543.14)
  • B- Block # 751723, 29-Aug-2022 ($20.2k), Spending 5,000 BTC (BTC split to 170 addresses in one transaction), Original Purchase Date: 19-Dec-2013 ($543.14)
  • C- Block # 752637, 04-Sep-2022 ($19.9k), Spending 5,000 BTC (the immediate receiver of the transaction is Kraken), Original Purchase Date: 19-Dec-2013 ($543.14)

Therefore, the sudden peak in LTH-SOPR above was most likely attributed to these three old large wallets that realized a massive volume of profit by moving their funds acquired in late 2013. The following chart shows the two of these transactions which deposited funds into Kraken, realizing a total of $163.48M in profit on the 8.5k BTC sent directly to Kraken.

Live Advanced Metric

Summary and Conclusions

With Bitcoin trading 72.5% below the Nov 2021 ATH this week, the market has many similarities to the latest phase of the 2018-19 bear market. The recent bear market rally sold off from $24.5k down to below $18.5k, plunging a significant volume of short-term holder supply back into an unrealized loss.

All in all, the primary factors influencing the current market structure appear to be these short-term holders, whom are jostling for the best entry price, and what little profit is available to take. The sensitivity and conviction of these investors within the volatile macroeconomic environment is a key factor in near-term market direction. Long-Term Holders have experienced a significant wash-out already and generally shift towards keeping coins dormant during these phases.

The recent bear market rally failed to achieve escape velocity, as shown by rejections across numerous SOPR and investor profitability ratios. Inflows of demand have proven insufficient to date to absorb this sell-side pressure. The battle is now in defence of the $20k region, noting that bear market history often takes several months before the final touches on a bear market floor are established.


Product Updates

All product updates, improvements and manual updates to metrics and data are recorded in our changelog for your reference.

  • Released a large set of Derivatives, Supply, and Market Indicator Workbench Pre-sets for Bitcoin and Ethereum.

Disclaimer: This report does not provide any investment advice. All data is provided for information purposes only. No investment decision shall be based on the information provided here and you are solely responsible for your own investment decisions.