Hashrate Hits New Highs

As global equity and bond markets continue to tread challenging ground, Bitcoin hashrate defies the odds, pushing to yet another all-time high. In this piece, we deep dive into the mining sector to assess whether the worst of the miner capitulation is over, or not.

Hashrate Hits New Highs

Global equity and bond markets continue to tread challenging ground, with growing evidence of stress developing in sovereign debt and currency markets this week. Of particular note was the dislocation experienced in the United Kingdom Gilt market, where bond yields soared, the British pound fell to all-time-lows against the US Dollar, and the Bank of England reestablished quantitative easing to reliquify markets.

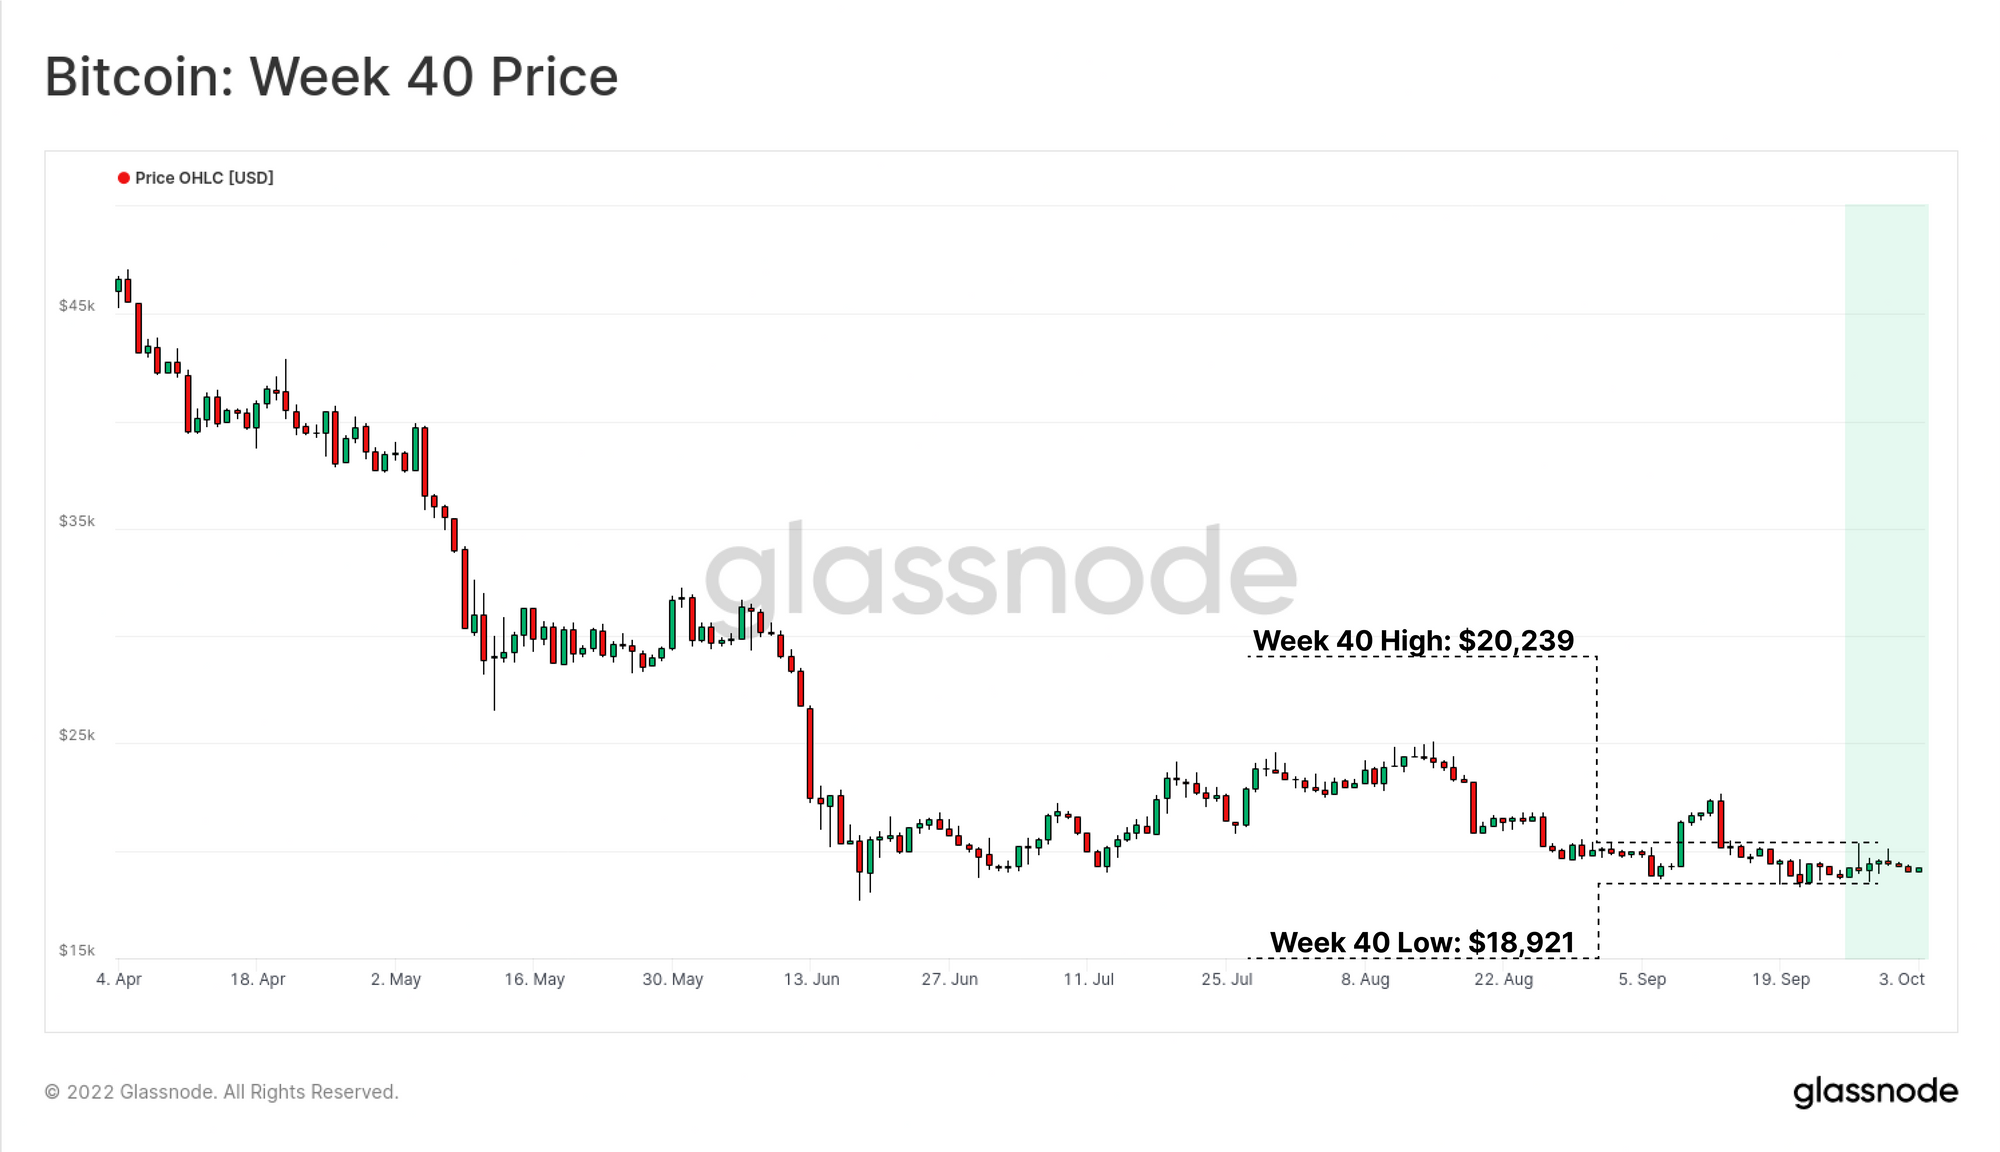
Amidst such extremes, Bitcoin prices have remained notably stable, consolidating within an increasingly narrow range between $19,921 and $20,239. Such quiet periods are very uncommon for Bitcoin, with semblance to both pre-crash November 2018, but equally to pre-rally March 2019.

Despite severe price drawdowns, and global macro turmoil, Bitcoin hashrate has remarkably pushed to yet another all-time high this week. We last covered the stress developing in the Bitcoin Mining sector back in June (see WoC 23, and WoC 25). This week, we will revisit with a deep dive into the production side of Bitcoin, which appears to be recovering remarkably well, a signal which has historically been constructive in the months that followed.


Translations

This Week On-chain is now being translated into Spanish, Italian, Chinese, Japanese, Turkish, French, Portuguese, Farsi, Polish, Arabic, Russian, Vietnamese and Greek.

The Week Onchain Dashboard

The Week Onchain Newsletter has a live dashboard with all featured charts available here. This dashboard and all covered metrics are explored further in our Video Report, which is released on Tuesdays each week. Visit and subscribe to our Youtube Channel, and visit our Video Portal for more video content and metric tutorials.


Mining Competition Increases

As the bear market rages on, Bitcoin hashrate has reached a new all-time-high of 242 Exahash per second. To give an analogy for scale, this is equivalent to all 7.753 Billion people on earth, each completing a SHA-256 hash calculation approximately 30 Billion times every second. These are extraordinarily large numbers.

Live Chart

The Bitcoin hash-ribbons commenced an unwind in late August, providing an indication that mining conditions were improving, and hashrate was coming back online. Interestingly, the current environment has not yet seen prices recover, signalling this hashrate rise is due to more efficient mining hardware coming online and/or miners with superior balance sheets having a larger share of the hashpower network.

Almost all historical hash-ribbon unwinds have preceded greener pastures in the months that followed.

Live Advanced Chart

The Mining Pulse provides another tool to monitor miner activity, measuring the average block interval relative to the target of 600-seconds.

  • Lower values indicate blocks are faster than 600-sec, signalling hashrate is growing faster than the regulating difficulty adjustment can keep up.
  • Higher values indicate blocks are slower than 600-sec, signalling hashrate is coming offline, often in response to industry shocks such as capitulation events.

As shown in blue, the recent miner capitulation has been a multi-month affair, starting in late May and with recovery starting in early August. As shown in pink, previous bear markets have typically ended with more of a dramatic event, with severe and rapid declines in hashrate.

It remains to be seen if this is more subdued but protracted capitulation event is simply the appetiser, or whether it reflects a new dynamic as more of the hashpower is held by better capitalised publicly traded mining companies.

Live Advanced Workbench

New Product Updates: September

September was an extremely exciting month for Glassnode, engaging our entire team, from engineering, data scientists, and analysts, to deploy a brand new suite of Ethereum Merge and Proof-of-Stake metrics. We released 8x Analysis Reports, 16x Metrics, 19x Workbench Constructions, and 2x Dashboards.

Read our Product Updates for September

The Price of Production

As hashrate comes back online, Mining Difficulty has recommenced a series of upwards adjustments, having risen 27.9% since the Great Miner Migration peak in May 2021.

Higher protocol Difficulty implies an increasing cost of production per unit of BTC as more hashpower competition enters the network. This is occurring at a time where miner revenues are already stressed due to lower coin prices, which should, in theory, create elevated income stress on the mining industry.

Live Chart

Indeed, we can see that the revenue earned per Exahash has been in a persistent and long-term downtrend, with the BTC-denominated reward currently at an all-time-low of 4.06 BTC per EH per day.

On a USD-denominated basis, this equates to between $78k to $88k in revenue per EH per day. This has returned to Oct-2020 levels, which was after the 2020 halving event, and where BTC prices were around $10k (currently ~$20k). From this, we can see that a 66% increase in Difficulty and Hashrate since Oct-2020 corresponds to an approximate halving in revenue per hash.

Live Advanced Workbench

Numerous models have been proposed to evaluate, and estimate the network wide cost of production for BTC, many of which consider Difficulty as an essential input parameter. Difficulty effectively represents a protocol defined measure of the all-in-hurdle-rate in order to solve the next block, and win the reward.

The Difficulty Regression model is a fairly simple interpretation of this, calculated as a log-log regression between Difficulty and Market Cap, sporting an exceptionally high R2 coefficient of 0.944. This model last intersected spot prices around $17,840, at the lows of the June 2022 sell-off. It is currently hovering around $18,300, which is just below this weeks market lows.

This would indicate that miners are somewhat on the cusp of acute income stress.

Live Workbench

A brand new valuation framework was proposed by analyst kuntah this week, which fits a non linear relationship between the cost of production, and the input parameters of Difficulty, and Issuance. The model seeks to capture the point of maximum miner efficiency, being at the bottom of bear markets when only the strongest miner balance sheets and operations are profitable.

Three traces are shown:

  • 🔴 Current Estimate Cost of Production of $12,140, located around the centroid of the last cycles trading history, and the genesis of the 2020-21 bull run. Note that this reflects a price floor model, fitted to the lows of bear market capitulations.
  • 🟣 Post 2024 Halving Cost of Production $24,230 (assuming constant difficulty).
  • 🟠 Geometric mean of the two aforementioned traces $17,080, providing a gauge of the most likely price of acute miner income stress.

Similar to the Difficulty Regression Model, the price range between $17k and $18k has confluence as being an area that induced miner stress in June, and aligns with numerous cost of production estimates.

Live Advanced Workbench

Has Miner Capitulation Risk Passed?

Having established price areas of interest relating to miner profitability and income stress, we can review a series of metrics which help describe these events.

First, the Puell Multiple, which is a cyclical oscillator that compares the current daily mining revenue to their yearly average. The Puell Multiple hit the current lows of around 0.33 in June, indicating that miners were earning just 33% of their yearly average revenue. It has since recovered to around 0.63, implying a degree of stress relief, and adjustment to this new pricing regime.

All previous bear cycles have experienced a strong rally off the lows in the Puell Multiple, associated with short-term price relief once a true bear market low is established.

Live Advanced Chart

The Puell Multiple and cost of production models are implied stress models, where we estimate prices where miner revenues may come under pressure (thus necessitating additional coin distribution). We can bolster this case by using explicit stress models such as the Hash ribbons, or the Difficulty Ribbon Compression, which react only to the observable changes in the hashpower markets.

The model below combines the implied income stress of the Puell Multiple, with the explict stress observation of the Difficulty Ribbon Compression. As of the time of writing, this model has only just exited levels where miner capitulation is statistically likely.

However, note that in all previous bear markets, there are a handful of days where this happens fleetingly. Thus full confirmation is yet to be established, but is one to watch for a more sustained recovery.

Live Advanced Workbench

If we look at the aggregate size of miner balances, we can see that around 78.4k BTC remain held by miners we have labelled (accounting for ~96% of current hashrate). The cohort of 'Other' unlabelled miners is much larger at around 660k BTC, however this includes accumulated (and likely lost coins) from miners from the early years of Bitcoin.

This provides a gauge of the risk, with some 78.4k BTC held by miners who may come under income stress.

Live Professional Workbench

To finalise our assessment, we look to the actual coin distribution patterns of miners to see impacts on their treasury balances. The chart below is the 30-day change in miner wallets, and whilst distribution has slowed, it remains at a level of around 4.5k BTC per month. This is a decline of 50% since the peak in early September, however.

Live Professional Chart

However, digging further into this, we can identify that a great majority of current expenditure is sourced from miners associated with Poolin. The orange curve below shows the all-miner 30-day change, whilst the blue curve is specific to Poolin, demonstrating that almost all spending is associated with this cohort.

Live Professional Workbench

Poolin was, until very recently, one of the largest mining pools in the industry, accounting for over 15% of hashrate in early 2020, and 12% at the start of September. After an announcement that Poolin was experiencing 'liquidity issues', the estimated hashrate directed at the pool plummeted, representing just 3.7% of the hashpower network today.

In a Market Pulse report released at the time, we demonstrated how to use Glassnode tools to estimate the hashrate of a specific mining pool. The methodology uses their share of block reward revenue relative to the total as a proxy, enabling us to visualise just how quickly miners can redirect hashrate in times of distress.

Live Advanced Workbench

Summary and Conclusions

Amidst global chaos in traditional markets, Bitcoin prices remain remarkably stable, in a multi-month consolidation between $18k and $20k. It is extremely rare for BTC prices to stay so stationary for long, suggesting heightened probabilities of volatility on the horizon.

Bitcoin mining hashrate reached new all-time-highs this week, driving up the cost of production for BTC, at a time where miner revenues have only just recovered from the recent capitulation. By numerous models, we estimate that the average cost of BTC production hovers just below current prices, such that any significant price decline could turn an implied income stress, into acute and explicit stress.

This risk could manifest as a second stage miner capitulation, with around 78.4k BTC still held in miner treasuries. It is extremely unlikely this full amount would be distributed, however provides an upper bound gauge on the potential risks at hand.


Translated channels

We are proud to have launched new social channels for:


--

Disclaimer: This report does not provide any investment advice. All data is provided for information purposes only. No investment decision shall be based on the information provided here and you are solely responsible for your own investment decisions.