Hardened HODLers Double Down

In the aftermath of the sell-off in early May, a noteworthy shift in accumulation trends is underway. The Bitcoin HODLer class remain the only ones left, however their accumulation behaviour signals a doubling down as prices correct below $30k.

Hardened HODLers Double Down

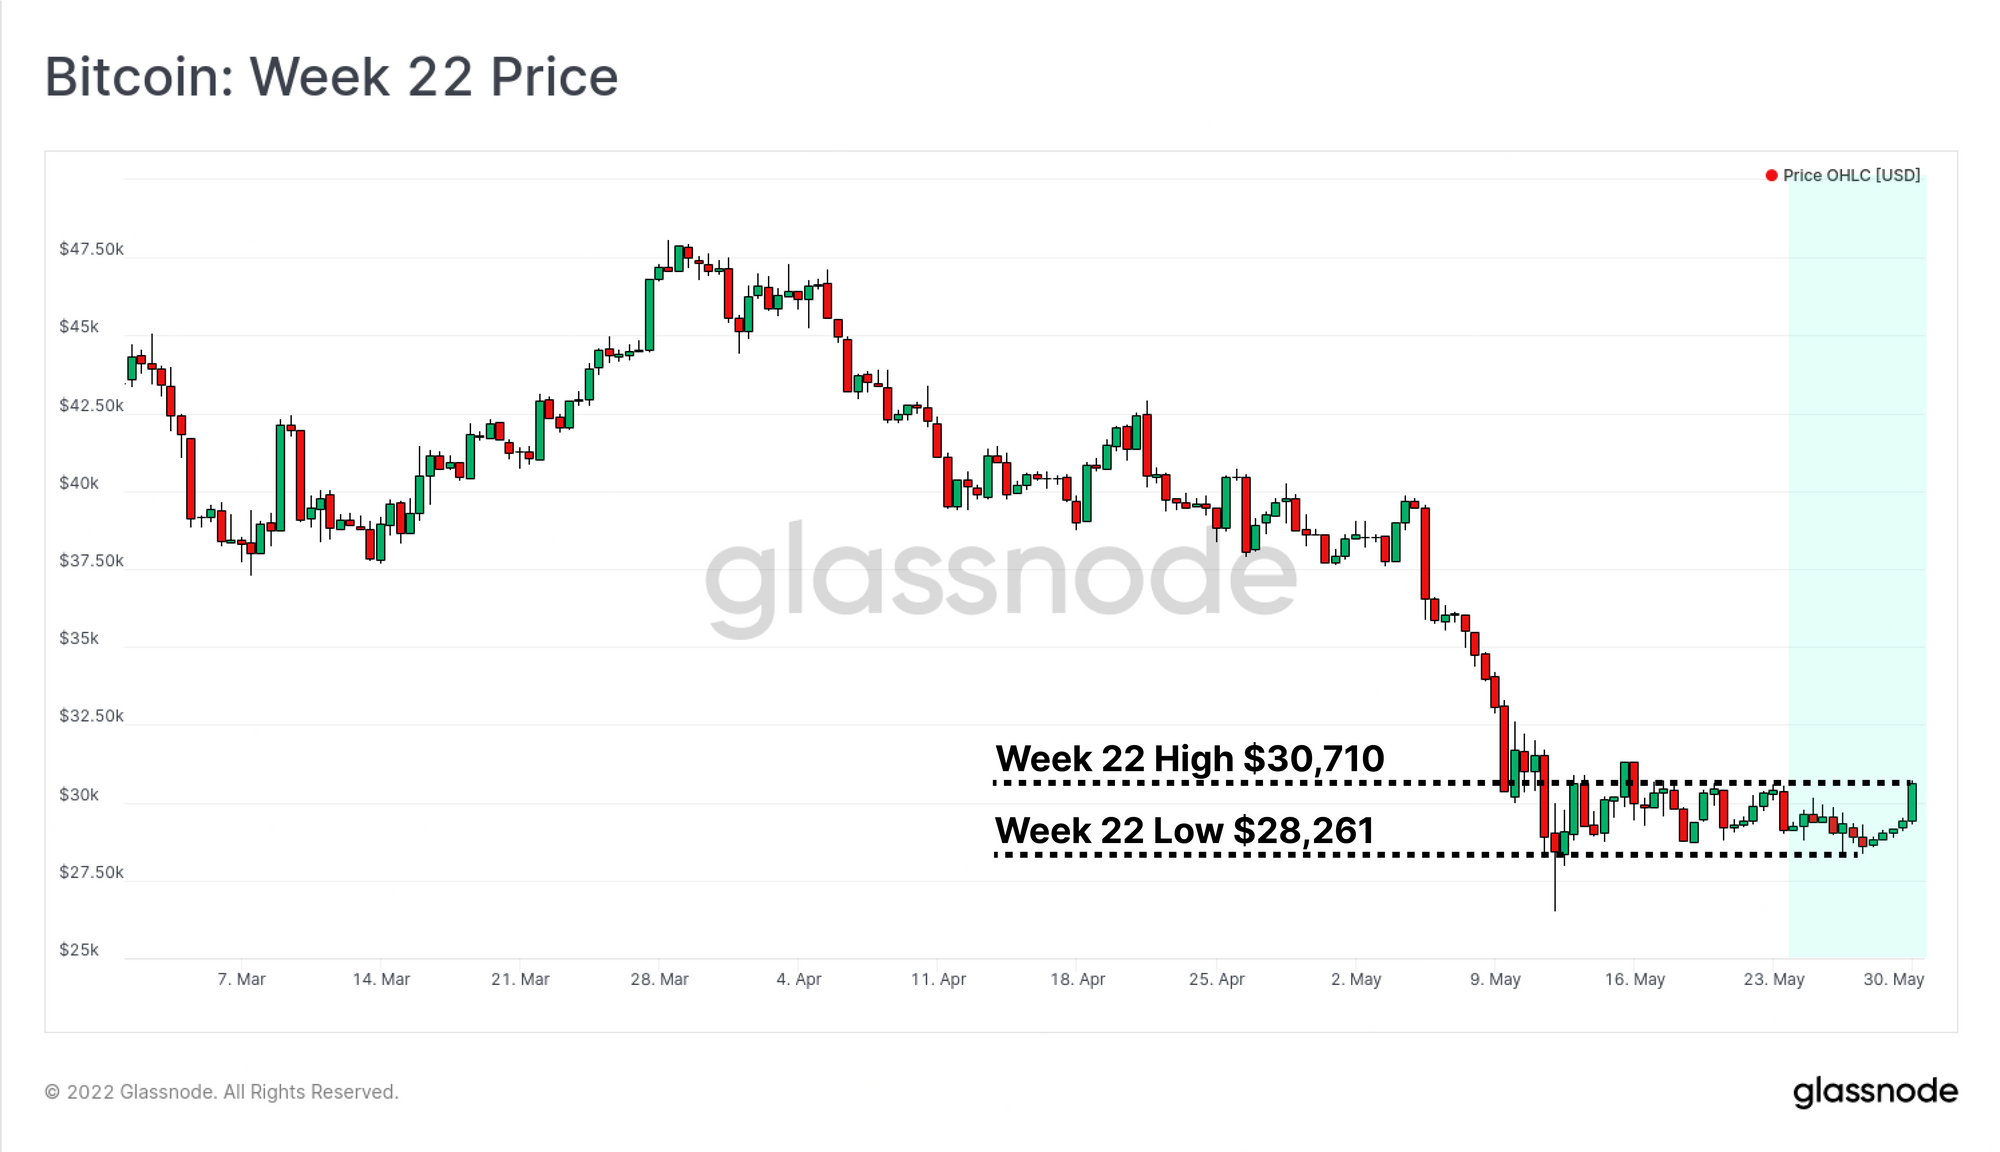
Bitcoin prices continued to consolidate this week, after initial signs of a potential decoupling between digital asset markets, and traditional equity markets, albeit in the wrong direction. The S&P500 index rallied 7.4% from the lows this week, and the NASDAQ was up 9.6%. Meanwhile, Bitcoin traded down to a low of $28,261, and only rallied early on Monday to recover the weekly high of $30,710. Ethereum also had a tough week, shedding 17.8% of its value to a low of $1,700, before rebounding to $1,900 on Monday morning.

After the LUNA motivated sell-off event earlier in the month, there has been a distinct behavioural change in Bitcoin on-chain accumulation trends. In particular, entities with balances < 100 BTC, and those with >10k BTC have been significant accumulators. The remaining wallet cohorts have also transitioned from net distributors, to neutral. This reflects a notable shift in behaviour compared to the Feb-mid May period which was intermittent accumulation and distribution, reflecting uncertainty and a rotating capital.

However, on-chain activity remains extremely soft, with little signal of new interest in the asset outside the existing HODLer base. That said, the HODLers who remain, appear to be willing to double down as prices fall, and remain unwilling to spend coins, even if held at a loss.


Translations

This Week On-chain is now being translated into Spanish, Italian, Chinese, Japanese, Turkish, French, Portuguese, Farsi, Polish, and Greek.

The Week Onchain Dashboard

The Week Onchain Newsletter has a live dashboard with all featured charts available here. This dashboard and all covered metrics are explored further on our Video Report which is released on Tuesdays each week. Visit and subscribe to our Youtube Channel, and visit our Video Portal for more video content and metric tutorials.


Only the HODLers Remain

Over recent months, we have highlighted how the on-chain activity for Bitcoin remains both lacklustre, and stable. This is a typical characteristic of past bear markets, where the transaction activity of the network is dominated by the HODLer class, who are far more price insensitive.

After the May 2021 sell-off, we witnessed a modest 'purge' of wallets, as investors completely emptied out their coin holdings. This was followed by four month long plateau in wallet growth as uncertainty crept into investor psychology, and marginal buyers were flushed out of the market by the drawdown.

As we can see in the chart below, the poor price performance of late has put wallet growth on a near term pause, although not on the same scale as in May 2021.

Live Chart

During highly volatile events like the LUNA inspired sell-off, we often see an uptick in on-chain activity, as investors panic, sell, or otherwise move coins to post margin and cover positions. In March 2020 and November 2018, this upswing in activity post sell-off initiated the subsequent bull runs.

Whilst this possibility cannot be ruled out, we can see that both Active Addresses and Entities have 'given back' all of this upswing in activity, and returned to the range established since Sept 2021. In other words, the recent sell-off, and lower prices has not yet inspired an influx of new users to the space, and only the HODLers remain.

Live Workbench Chart

A Shift in Accumulation Behaviour

Of course on-chain activity is only a part of the story. Whilst wallet growth and active entities may be stagnant, this analysis does not account for the economic value of the investors and wallets that remain. As prices correct lower, the ability for HODLers to acquire more BTC per dollar increases, which leads us to investigate the domain of supply dynamics.

The Accumulation Trend Score has seen a noteworthy shift in behaviour. For almost 2-weeks, it has returned near perfect score above 0.9. This indicates that existing entities on the network are adding significantly to their holdings. This is a clear break from the intermittent scores returned during the Jan-April consolidation range (orange) which can reasonably be classified as relatively low conviction accumulation.

Previous instances of sustained high accumulation trend scores fall into two buckets:

  • High scores during a bull-run (blue) - which usually occur near tops as the smart money distribute their balance, but are matched with an even larger influx of less experienced new buyers.
  • High scores during bearish trends (green) - which generally trigger after very significant corrections in price, as investor psychology shifts from uncertainty, to value accumulation. A notable exception is the post ATH period of Dec 2021 where 'the dip' turned out to not be THE dip, and many of these coins were redistributed lower at a loss.
Live Chart

If we dissect the various wallet cohorts whom are contributing to this high accumulation score, we can identify two particular groups: entities with <100 BTC, and entities with >10k BTC.

Inspecting the former, we can see that the gradient of their aggregate wallet holdings increased following the recent sell-off. Furthermore, the aggregate balance of this cohort has increased by 80,724 BTC, remarkably similar to the net 80,081 BTC liquidated by the LUNA Foundation Guard (details here). In effect, the increased demand from < 100 BTC entities at lower prices has offset in the supply liquidated by LFG in the attempt to defend the UST peg.

Live Workbench Chart

The other cohort which has contributed to the high Accumulation Trend Score are whales with > 10k BTC holdings. Over the course of May, these entities have added 46,269 BTC to their balance, and note that this includes the distribution of 80k BTC from the LFG wallet.

Live Workbench Chart

These observations can be largely confirmed by inspection of the Accumulation Trend Score breakdown by wallet cohorts metric. Here we can see that since the sell-off, entities holding < 100 BTC and >10k BTC have returned blue signals indicating a significant increase to their balance in recent weeks.

This is a notable shift from the relatively weak values (yellow-red) during the lead-up to the sell-off, with Whales in particular being large scale distributors. The remaining wallet cohorts with 100-10k BTC have maintained a more neutral rating around 0.5, suggesting relatively little net change to their holdings.

In the next section, we will investigate the behaviour of the Long-term Holders to further refine our observations.

Live Metric in the Glassnode Engine Room

Product Launch: The Glassnode Engine Room

Welcome to the Glassnode Engine Room, a new product release for our Professional and Institutional members. This suite of exclusive image metrics provides an inside look at the research, innovation and experimentation happening behind the scenes. Engine Room metrics are designed to inspect increasingly bespoke segments of market and network data. Examples include:

  • Breaking down the URPD into Age, Wallet, and LTH-STH cohorts.
  • Profit and Loss bands by cohort and age.
  • Accumulation Trend Score by wallet cohort.

You will find the Glassnode Engine room located under the Bitcoin category in your list of pre-set dashboards. We look forward to releasing new metrics, research, and concepts to the Engine Room on a semi-regular basis, and to hearing your feedback in the Professionals Lounge on Forum.


Long-Term Losses

We have now established a case for the various wallet size cohorts that participated in recent accumulation on-chain. Next we turn to the Long-Term Holders, whom represent the least likely to spend during volatility to gauge investor conviction. Note that the transition into Long-Term Holder status is approximately 155-days ago, which is located in late December when prices were at ~$47k.

If we take a look at the URPD metric on 1-Apr-2022, prior to the LUNA sell-off, we can map out the coin distribution profile with a focus on on the 2021-22 cycle.

Live Chart

We now bring this 1-Apr profile and overlay it with today's URPD in blue below. From this we can assess the change in coin distribution and make the following observations:

  • A sizeable reallocation of 1.5M BTC has occurred from buyers largely in the $42k to $49k range, down to buyers in the current range of $26.7k to $33k.
  • The coin distribution elsewhere remains remarkably similar to the 1-Apr profile, suggesting the relatively price insensitive HODLer cohort continues to dominate the Bitcoin investor profile.
Live Chart

The current downtrend in coins younger than 3-months supports this observation. Looking back 3-months captures all coins last spent after 1-March, which is the middle the last consolidation range. When a downtrend in 3m old HODL waves is in effect, it means that on net, coin supply is migrating up to more senior age bans.

The key takeaway from these two metrics is that the coin holders who accumulated after the Nov ATH appear to be relatively price insensitive. Despite continued drawdowns in price, and a major spot liquidation event of 80k+ BTC, they remain unwilling to let their coins go.

Live Chart

Recalling that the Long-Term Holder threshold is located in late-December, it is no surprise that the total LTH supply has plateaued of late. For the last few months, the LTH threshold was traversing along the downtrend that was in play from Nov-Jan.

Typically, supply accumulation occurs during sideways price ranges. This means that in around 1-month time, the LTH threshold will enter the previous consolidation range established between $33k and $42k. Based on the URPD profile, a very large volume of supply was acquired here between January and April.

Long-Term Holder supply has recently returned to the ATH of 13.048M BTC. Unless significant coin redistribution occurs, we can therefore expect this supply metric to commence climbing over the course of the next 3-4 months, suggesting HODLers continue to gradually soak up, and hold onto supply.

Live Chart

However, despite the constructive forward view, there remains a sub-set of LTHs whom are currently spending coins and realizing losses. The LTH-SOPR metric can be viewed as the average profit multiple realized by the LTH cohort each day, and it rarely trades below 1.0.

This week, we have seen the average LTH spent coin locking in a 27% loss compared to the point of coin acquisition. Such events in the past have only occurred during the final capitulation lows of bear markets such as 2015, 2018 and briefly in March 2020.

Live Chart

With the concept of LTH-SOPR as a realized profit multiple, we can thus derive the average price from where LTH spent coins are 'coming from', termed the Spent Price. The LTH Spent Price (pink) rarely trades above the market price, but however is currently trading at $32.8k on a 7-day moving average basis. The last time LTHs locked in losses like this was briefly following the March 2020 sell-off event. In the case of the 2018 bear, this preceded many months of LTH losses and culminated in an additional 50% price decline.

Live Chart

Summary and Conclusions

The plateauing on-chain activity for Bitcoin has been in effect since September 2021, and as yet, there are few signs of this changing course. What this indicates is that the HODLer class, the Bitcoin buyers of last resort, and the only ones that remain. This can also be observed in the unwillingness to spend held supply, even if it is now held at a loss.

A notable shift occurred in on-chain accumulation trends following the LUNA induced sell-off. Entities with < 100BTC appear to have soaked up an equivalent coin volume to that sold in distress by the Luna Foundation Guard. Alongside a majority of Long-Term Holders an increasingly large volume of BTC appears HODLed and acquired at these lower prices. This trend, unless disrupted, can be expected to propel Long-Term Holder supply above its ATH over the coming months.

Keeping both eyes on the macro environment which Bitcoin remains within, there are signals of a decoupling between digital assets and equities. Whether renewed correlation returns remains to be seen, and as does the ultimate direction of markets in reaction to monetary tightening. Risks of significant scale remain, however, impressively,  so does the population of price insensitive Bitcoin HODLers.


Product Updates

All product updates, improvements and manual updates to metrics and data are recorded in our changelog for your reference.


New Research: A Short History of the Etherverse

Ethereum is a permissionless platform, and as such, doesn't have an inherent purpose that is enforceable. In any meaningful sense, a permissionless platform is defined empirically by its usage. Our latest research piece explores the Etherverse from the perspective of the market share captured by various use cases in relation to on-chain transactions, and gas consumption.

Read our latest analysis piece here.

A Short History of the Etherverse

Disclaimer: This report does not provide any investment advice. All data is provided for information purposes only. No investment decision shall be based on the information provided here and you are solely responsible for your own investment decisions.